Walla Walla East, WA Map & Demographics
Walla Walla East Map
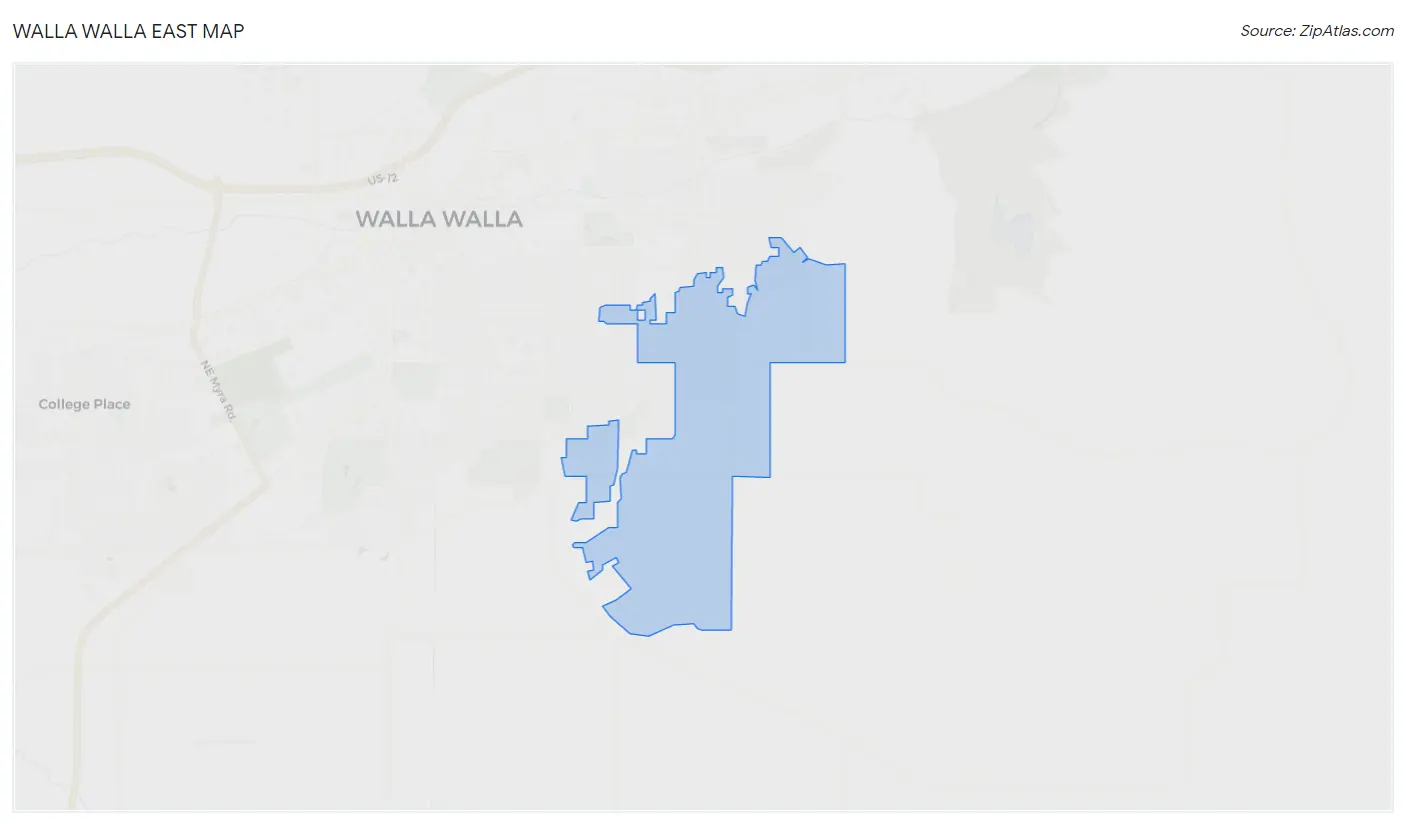
Walla Walla East Overview
$41,499
PER CAPITA INCOME
$86,525
AVG FAMILY INCOME
$79,336
AVG HOUSEHOLD INCOME
67.0%
WAGE / INCOME GAP [ % ]
33.0¢/ $1
WAGE / INCOME GAP [ $ ]
0.42
INEQUALITY / GINI INDEX
1,826
TOTAL POPULATION
724
MALE POPULATION
1,102
FEMALE POPULATION
65.70
MALES / 100 FEMALES
152.21
FEMALES / 100 MALES
46.1
MEDIAN AGE
3.0
AVG FAMILY SIZE
2.4
AVG HOUSEHOLD SIZE
635
LABOR FORCE [ PEOPLE ]
43.8%
PERCENT IN LABOR FORCE
Income in Walla Walla East
Income Overview in Walla Walla East
Per Capita Income in Walla Walla East is $41,499, while median incomes of families and households are $86,525 and $79,336 respectively.
| Characteristic | Number | Measure |
| Per Capita Income | 1,826 | $41,499 |
| Median Family Income | 533 | $86,525 |
| Mean Family Income | 533 | $125,313 |
| Median Household Income | 747 | $79,336 |
| Mean Household Income | 747 | $100,328 |
| Income Deficit | 533 | $0 |
| Wage / Income Gap (%) | 1,826 | 66.99% |
| Wage / Income Gap ($) | 1,826 | 33.01¢ per $1 |
| Gini / Inequality Index | 1,826 | 0.42 |
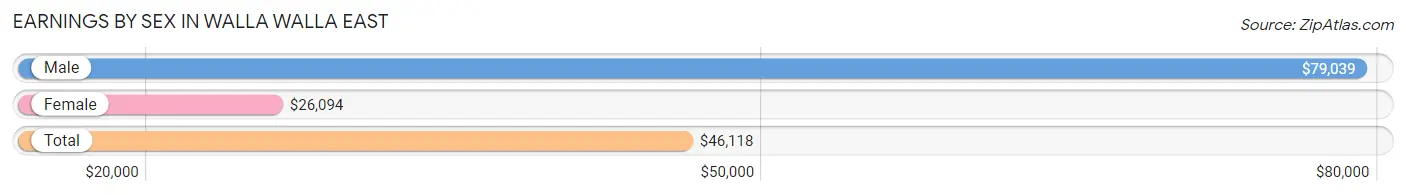
Earnings by Sex in Walla Walla East
Average Earnings in Walla Walla East are $46,118, $79,039 for men and $26,094 for women, a difference of 67.0%.
| Sex | Number | Average Earnings |
| Male | 391 (50.3%) | $79,039 |
| Female | 386 (49.7%) | $26,094 |
| Total | 777 (100.0%) | $46,118 |
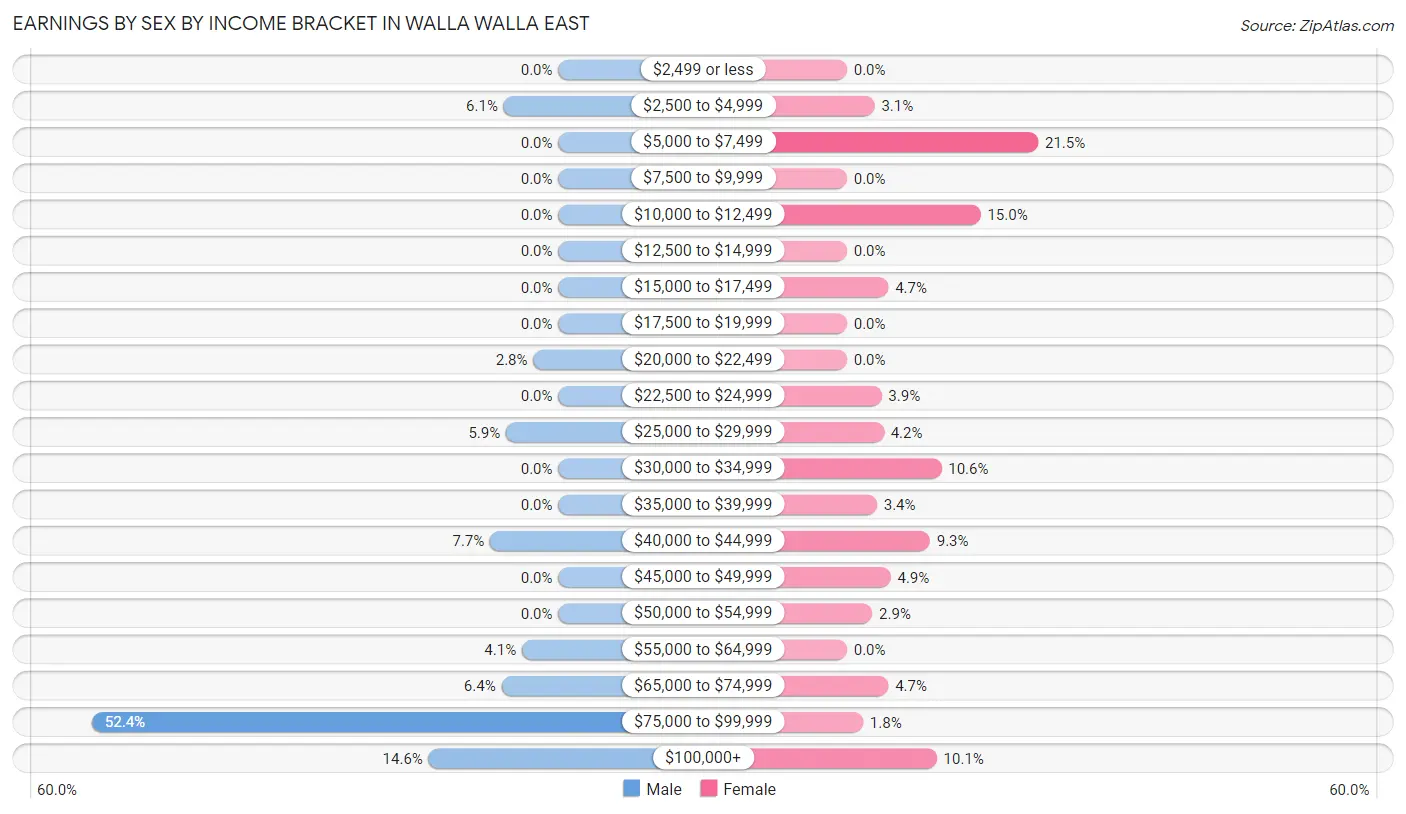
Earnings by Sex by Income Bracket in Walla Walla East
The most common earnings brackets in Walla Walla East are $75,000 to $99,999 for men (205 | 52.4%) and $5,000 to $7,499 for women (83 | 21.5%).
| Income | Male | Female |
| $2,499 or less | 0 (0.0%) | 0 (0.0%) |
| $2,500 to $4,999 | 24 (6.1%) | 12 (3.1%) |
| $5,000 to $7,499 | 0 (0.0%) | 83 (21.5%) |
| $7,500 to $9,999 | 0 (0.0%) | 0 (0.0%) |
| $10,000 to $12,499 | 0 (0.0%) | 58 (15.0%) |
| $12,500 to $14,999 | 0 (0.0%) | 0 (0.0%) |
| $15,000 to $17,499 | 0 (0.0%) | 18 (4.7%) |
| $17,500 to $19,999 | 0 (0.0%) | 0 (0.0%) |
| $20,000 to $22,499 | 11 (2.8%) | 0 (0.0%) |
| $22,500 to $24,999 | 0 (0.0%) | 15 (3.9%) |
| $25,000 to $29,999 | 23 (5.9%) | 16 (4.2%) |
| $30,000 to $34,999 | 0 (0.0%) | 41 (10.6%) |
| $35,000 to $39,999 | 0 (0.0%) | 13 (3.4%) |
| $40,000 to $44,999 | 30 (7.7%) | 36 (9.3%) |
| $45,000 to $49,999 | 0 (0.0%) | 19 (4.9%) |
| $50,000 to $54,999 | 0 (0.0%) | 11 (2.9%) |
| $55,000 to $64,999 | 16 (4.1%) | 0 (0.0%) |
| $65,000 to $74,999 | 25 (6.4%) | 18 (4.7%) |
| $75,000 to $99,999 | 205 (52.4%) | 7 (1.8%) |
| $100,000+ | 57 (14.6%) | 39 (10.1%) |
| Total | 391 (100.0%) | 386 (100.0%) |
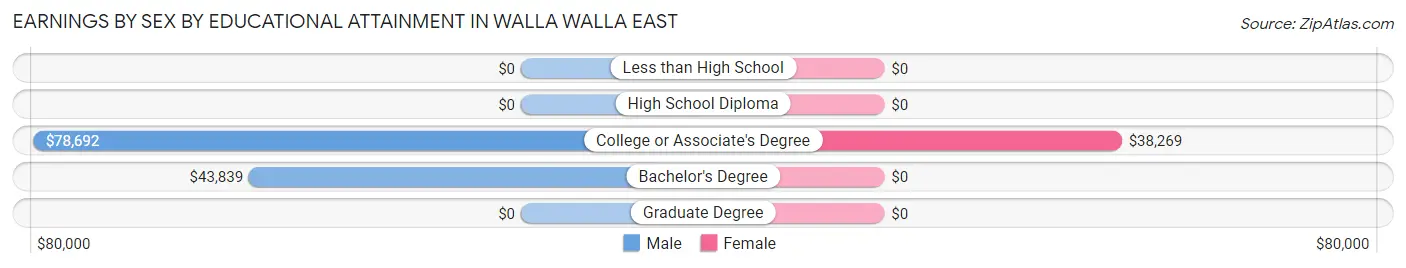
Earnings by Sex by Educational Attainment in Walla Walla East
Average earnings in Walla Walla East are $79,167 for men and $32,000 for women, a difference of 59.6%. Men with an educational attainment of college or associate's degree enjoy the highest average annual earnings of $78,692, while those with bachelor's degree education earn the least with $43,839. Women with an educational attainment of college or associate's degree earn the most with the average annual earnings of $38,269, while those with college or associate's degree education have the smallest earnings of $38,269.
| Educational Attainment | Male Income | Female Income |
| Less than High School | - | - |
| High School Diploma | - | - |
| College or Associate's Degree | $78,692 | $38,269 |
| Bachelor's Degree | $43,839 | $0 |
| Graduate Degree | - | - |
| Total | $79,167 | $32,000 |
Family Income in Walla Walla East
Family Income Brackets in Walla Walla East
According to the Walla Walla East family income data, there are 188 families falling into the $75,000 to $99,999 income range, which is the most common income bracket and makes up 35.3% of all families.
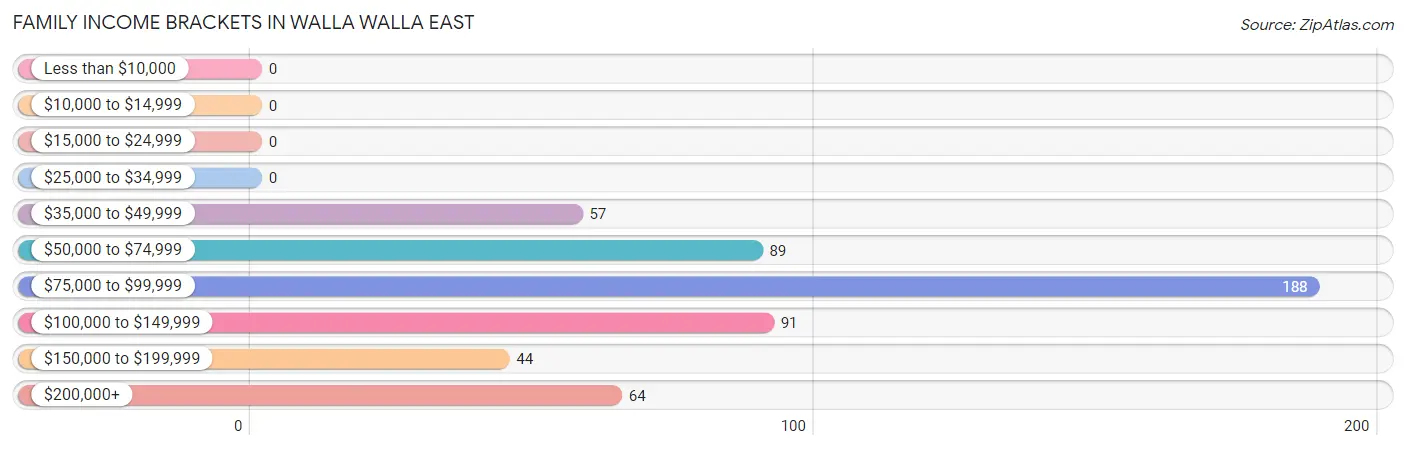
| Income Bracket | # Families | % Families |
| Less than $10,000 | 0 | 0.0% |
| $10,000 to $14,999 | 0 | 0.0% |
| $15,000 to $24,999 | 0 | 0.0% |
| $25,000 to $34,999 | 0 | 0.0% |
| $35,000 to $49,999 | 57 | 10.7% |
| $50,000 to $74,999 | 89 | 16.7% |
| $75,000 to $99,999 | 188 | 35.3% |
| $100,000 to $149,999 | 91 | 17.1% |
| $150,000 to $199,999 | 44 | 8.3% |
| $200,000+ | 64 | 12.0% |
Family Income by Famaliy Size in Walla Walla East
2-person families (318 | 59.7%) account for the highest median family income in Walla Walla East with $91,607 per family, while 2-person families (318 | 59.7%) have the highest median income of $45,804 per family member.
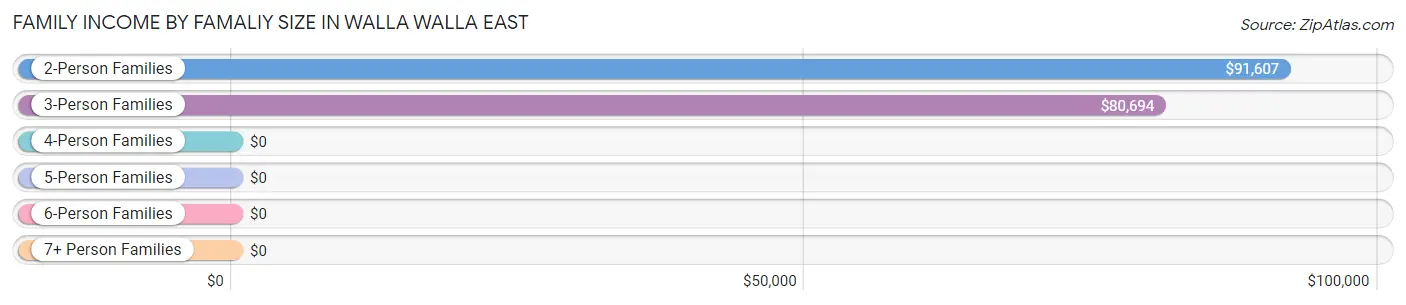
| Income Bracket | # Families | Median Income |
| 2-Person Families | 318 (59.7%) | $91,607 |
| 3-Person Families | 124 (23.3%) | $80,694 |
| 4-Person Families | 0 (0.0%) | $0 |
| 5-Person Families | 21 (3.9%) | $0 |
| 6-Person Families | 70 (13.1%) | $0 |
| 7+ Person Families | 0 (0.0%) | $0 |
| Total | 533 (100.0%) | $86,525 |
Family Income by Number of Earners in Walla Walla East
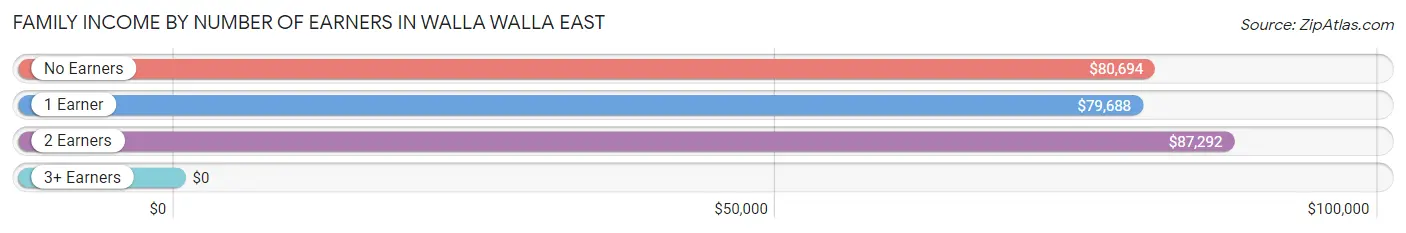
| Number of Earners | # Families | Median Income |
| No Earners | 108 (20.3%) | $80,694 |
| 1 Earner | 178 (33.4%) | $79,688 |
| 2 Earners | 226 (42.4%) | $87,292 |
| 3+ Earners | 21 (3.9%) | $0 |
| Total | 533 (100.0%) | $86,525 |
Household Income in Walla Walla East
Household Income Brackets in Walla Walla East
With 183 households falling in the category, the $75,000 to $99,999 income range is the most frequent in Walla Walla East, accounting for 24.5% of all households.
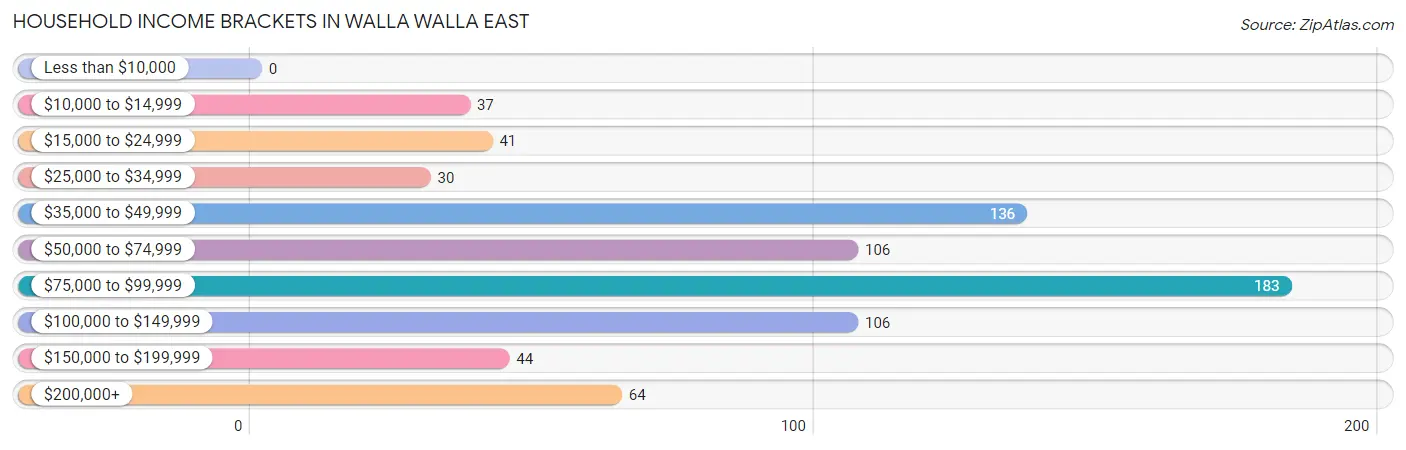
| Income Bracket | # Households | % Households |
| Less than $10,000 | 0 | 0.0% |
| $10,000 to $14,999 | 37 | 5.0% |
| $15,000 to $24,999 | 41 | 5.5% |
| $25,000 to $34,999 | 30 | 4.0% |
| $35,000 to $49,999 | 136 | 18.2% |
| $50,000 to $74,999 | 106 | 14.2% |
| $75,000 to $99,999 | 183 | 24.5% |
| $100,000 to $149,999 | 106 | 14.2% |
| $150,000 to $199,999 | 44 | 5.9% |
| $200,000+ | 64 | 8.6% |
Household Income by Householder Age in Walla Walla East
The median household income in Walla Walla East is $79,336, with the highest median household income of $85,789 found in the 25 to 44 years age bracket for the primary householder. A total of 179 households (24.0%) fall into this category.
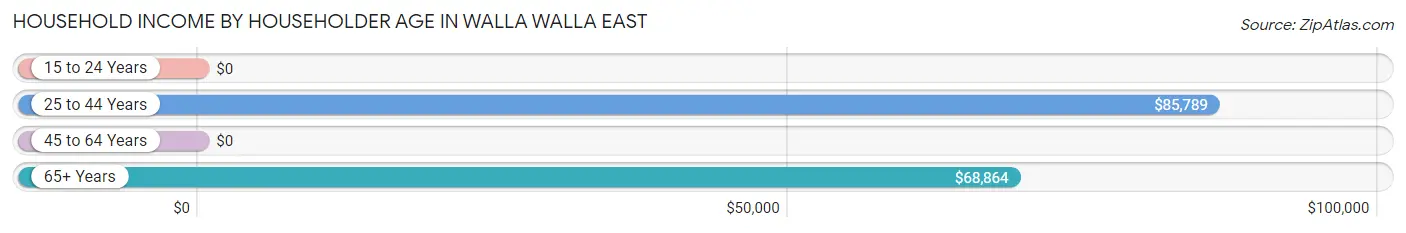
| Income Bracket | # Households | Median Income |
| 15 to 24 Years | 0 (0.0%) | $0 |
| 25 to 44 Years | 179 (24.0%) | $85,789 |
| 45 to 64 Years | 304 (40.7%) | $0 |
| 65+ Years | 264 (35.3%) | $68,864 |
| Total | 747 (100.0%) | $79,336 |
Poverty in Walla Walla East
Income Below Poverty by Sex and Age in Walla Walla East
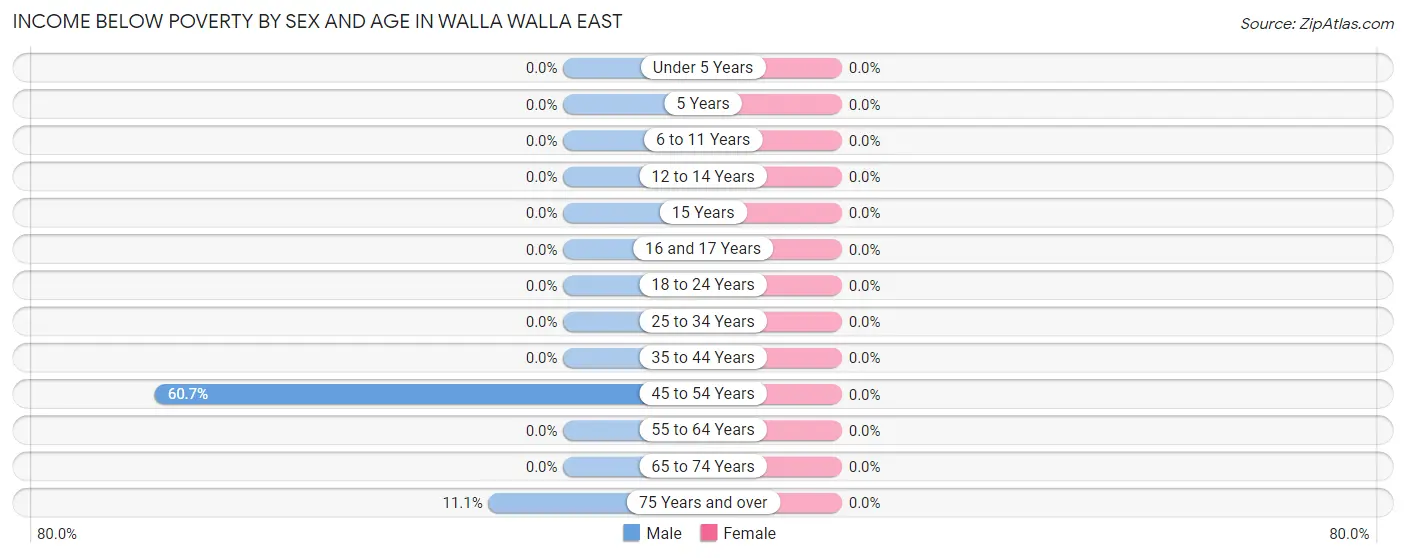
| Age Bracket | Male | Female |
| Under 5 Years | 0 (0.0%) | 0 (0.0%) |
| 5 Years | 0 (0.0%) | 0 (0.0%) |
| 6 to 11 Years | 0 (0.0%) | 0 (0.0%) |
| 12 to 14 Years | 0 (0.0%) | 0 (0.0%) |
| 15 Years | 0 (0.0%) | 0 (0.0%) |
| 16 and 17 Years | 0 (0.0%) | 0 (0.0%) |
| 18 to 24 Years | 0 (0.0%) | 0 (0.0%) |
| 25 to 34 Years | 0 (0.0%) | 0 (0.0%) |
| 35 to 44 Years | 0 (0.0%) | 0 (0.0%) |
| 45 to 54 Years | 37 (60.7%) | 0 (0.0%) |
| 55 to 64 Years | 0 (0.0%) | 0 (0.0%) |
| 65 to 74 Years | 0 (0.0%) | 0 (0.0%) |
| 75 Years and over | 12 (11.1%) | 0 (0.0%) |
| Total | 49 (6.8%) | 0 (0.0%) |
Income Above Poverty by Sex and Age in Walla Walla East
According to the poverty statistics in Walla Walla East, males aged under 5 years and females aged under 5 years are the age groups that are most secure financially, with 100.0% of males and 100.0% of females in these age groups living above the poverty line.
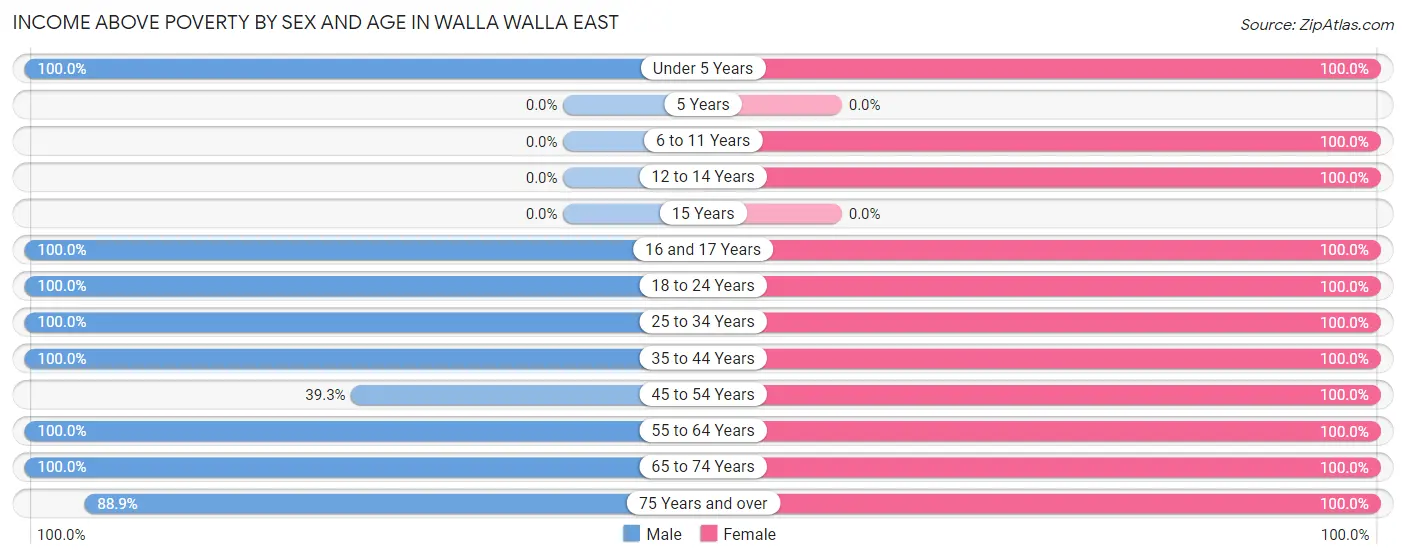
| Age Bracket | Male | Female |
| Under 5 Years | 76 (100.0%) | 116 (100.0%) |
| 5 Years | 0 (0.0%) | 0 (0.0%) |
| 6 to 11 Years | 0 (0.0%) | 126 (100.0%) |
| 12 to 14 Years | 0 (0.0%) | 58 (100.0%) |
| 15 Years | 0 (0.0%) | 0 (0.0%) |
| 16 and 17 Years | 15 (100.0%) | 73 (100.0%) |
| 18 to 24 Years | 11 (100.0%) | 58 (100.0%) |
| 25 to 34 Years | 30 (100.0%) | 62 (100.0%) |
| 35 to 44 Years | 158 (100.0%) | 126 (100.0%) |
| 45 to 54 Years | 24 (39.3%) | 51 (100.0%) |
| 55 to 64 Years | 175 (100.0%) | 146 (100.0%) |
| 65 to 74 Years | 90 (100.0%) | 152 (100.0%) |
| 75 Years and over | 96 (88.9%) | 134 (100.0%) |
| Total | 675 (93.2%) | 1,102 (100.0%) |
Income Below Poverty Among Married-Couple Families in Walla Walla East
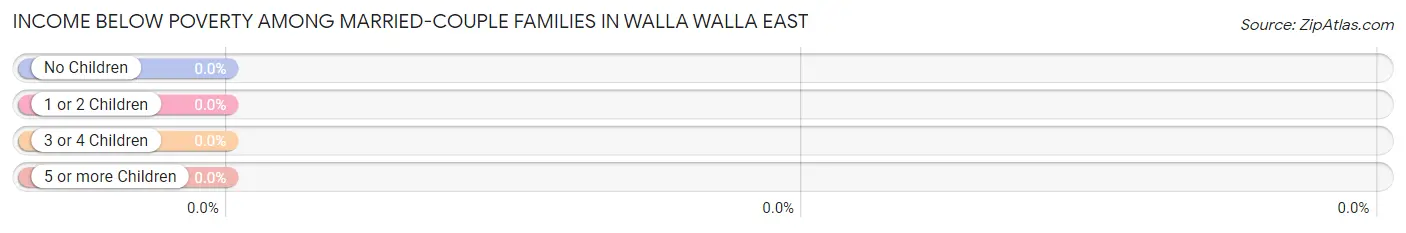
| Children | Above Poverty | Below Poverty |
| No Children | 304 (100.0%) | 0 (0.0%) |
| 1 or 2 Children | 82 (100.0%) | 0 (0.0%) |
| 3 or 4 Children | 70 (100.0%) | 0 (0.0%) |
| 5 or more Children | 0 (0.0%) | 0 (0.0%) |
| Total | 456 (100.0%) | 0 (0.0%) |
Income Below Poverty Among Single-Parent Households in Walla Walla East
| Children | Single Father | Single Mother |
| No Children | 0 (0.0%) | 0 (0.0%) |
| 1 or 2 Children | 0 (0.0%) | 0 (0.0%) |
| 3 or 4 Children | 0 (0.0%) | 0 (0.0%) |
| 5 or more Children | 0 (0.0%) | 0 (0.0%) |
| Total | 0 (0.0%) | 0 (0.0%) |
Income Below Poverty Among Married-Couple vs Single-Parent Households in Walla Walla East
| Children | Married-Couple Families | Single-Parent Households |
| No Children | 0 (0.0%) | 0 (0.0%) |
| 1 or 2 Children | 0 (0.0%) | 0 (0.0%) |
| 3 or 4 Children | 0 (0.0%) | 0 (0.0%) |
| 5 or more Children | 0 (0.0%) | 0 (0.0%) |
| Total | 0 (0.0%) | 0 (0.0%) |
Race in Walla Walla East
The most populous races in Walla Walla East are White / Caucasian (1,611 | 88.2%), Hispanic or Latino (157 | 8.6%), and Some other Race (123 | 6.7%).
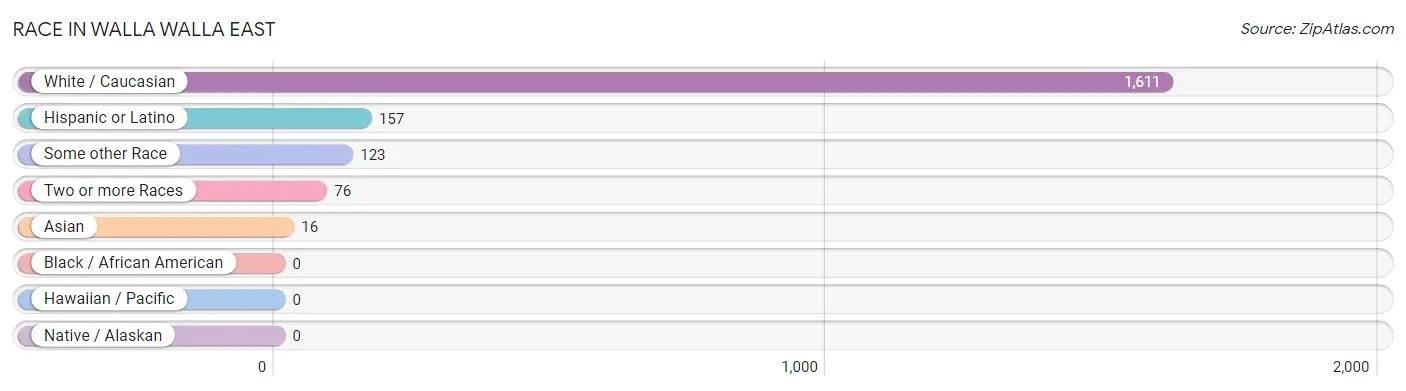
| Race | # Population | % Population |
| Asian | 16 | 0.9% |
| Black / African American | 0 | 0.0% |
| Hawaiian / Pacific | 0 | 0.0% |
| Hispanic or Latino | 157 | 8.6% |
| Native / Alaskan | 0 | 0.0% |
| White / Caucasian | 1,611 | 88.2% |
| Two or more Races | 76 | 4.2% |
| Some other Race | 123 | 6.7% |
| Total | 1,826 | 100.0% |
Ancestry in Walla Walla East
The most populous ancestries reported in Walla Walla East are English (730 | 40.0%), Irish (271 | 14.8%), German (173 | 9.5%), Mexican (139 | 7.6%), and Italian (135 | 7.4%), together accounting for 79.3% of all Walla Walla East residents.
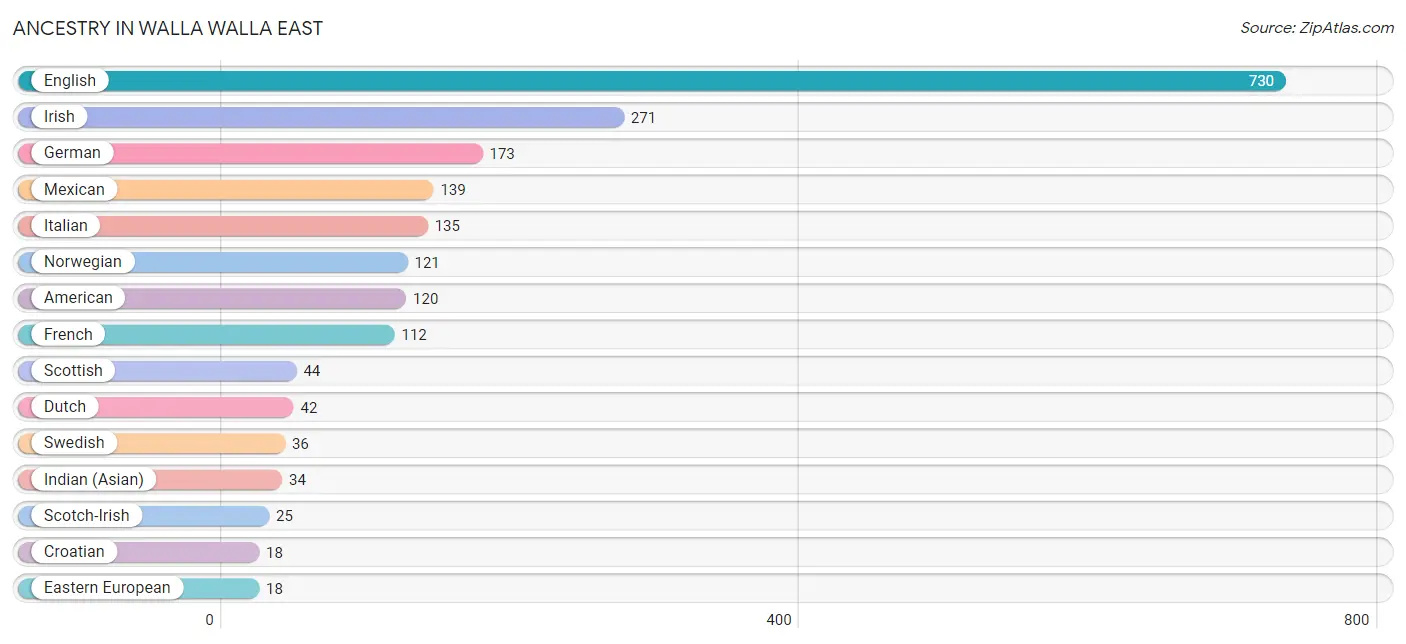
| Ancestry | # Population | % Population |
| American | 120 | 6.6% |
| Croatian | 18 | 1.0% |
| Dutch | 42 | 2.3% |
| Eastern European | 18 | 1.0% |
| English | 730 | 40.0% |
| French | 112 | 6.1% |
| German | 173 | 9.5% |
| Indian (Asian) | 34 | 1.9% |
| Irish | 271 | 14.8% |
| Italian | 135 | 7.4% |
| Mexican | 139 | 7.6% |
| Northern European | 14 | 0.8% |
| Norwegian | 121 | 6.6% |
| Peruvian | 18 | 1.0% |
| Russian | 14 | 0.8% |
| Scandinavian | 18 | 1.0% |
| Scotch-Irish | 25 | 1.4% |
| Scottish | 44 | 2.4% |
| Slovak | 14 | 0.8% |
| South American | 18 | 1.0% |
| Swedish | 36 | 2.0% |
| Swiss | 3 | 0.2% | View All 22 Rows |
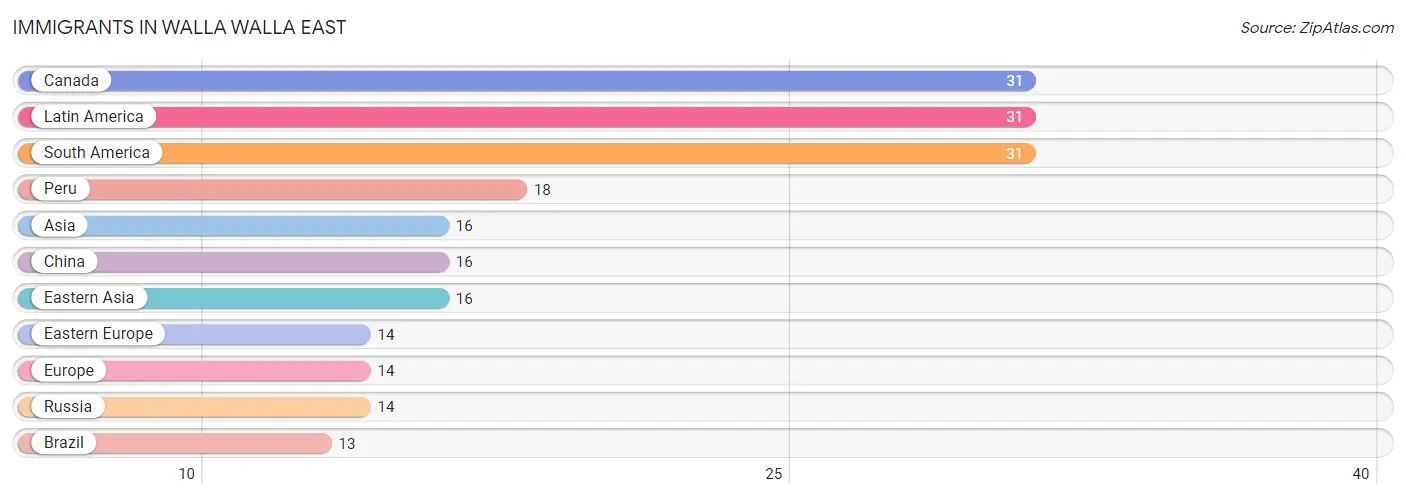
Immigrants in Walla Walla East
The most numerous immigrant groups reported in Walla Walla East came from Canada (31 | 1.7%), Latin America (31 | 1.7%), South America (31 | 1.7%), Peru (18 | 1.0%), and Asia (16 | 0.9%), together accounting for 7.0% of all Walla Walla East residents.
| Immigration Origin | # Population | % Population |
| Asia | 16 | 0.9% |
| Brazil | 13 | 0.7% |
| Canada | 31 | 1.7% |
| China | 16 | 0.9% |
| Eastern Asia | 16 | 0.9% |
| Eastern Europe | 14 | 0.8% |
| Europe | 14 | 0.8% |
| Latin America | 31 | 1.7% |
| Peru | 18 | 1.0% |
| Russia | 14 | 0.8% |
| South America | 31 | 1.7% | View All 11 Rows |
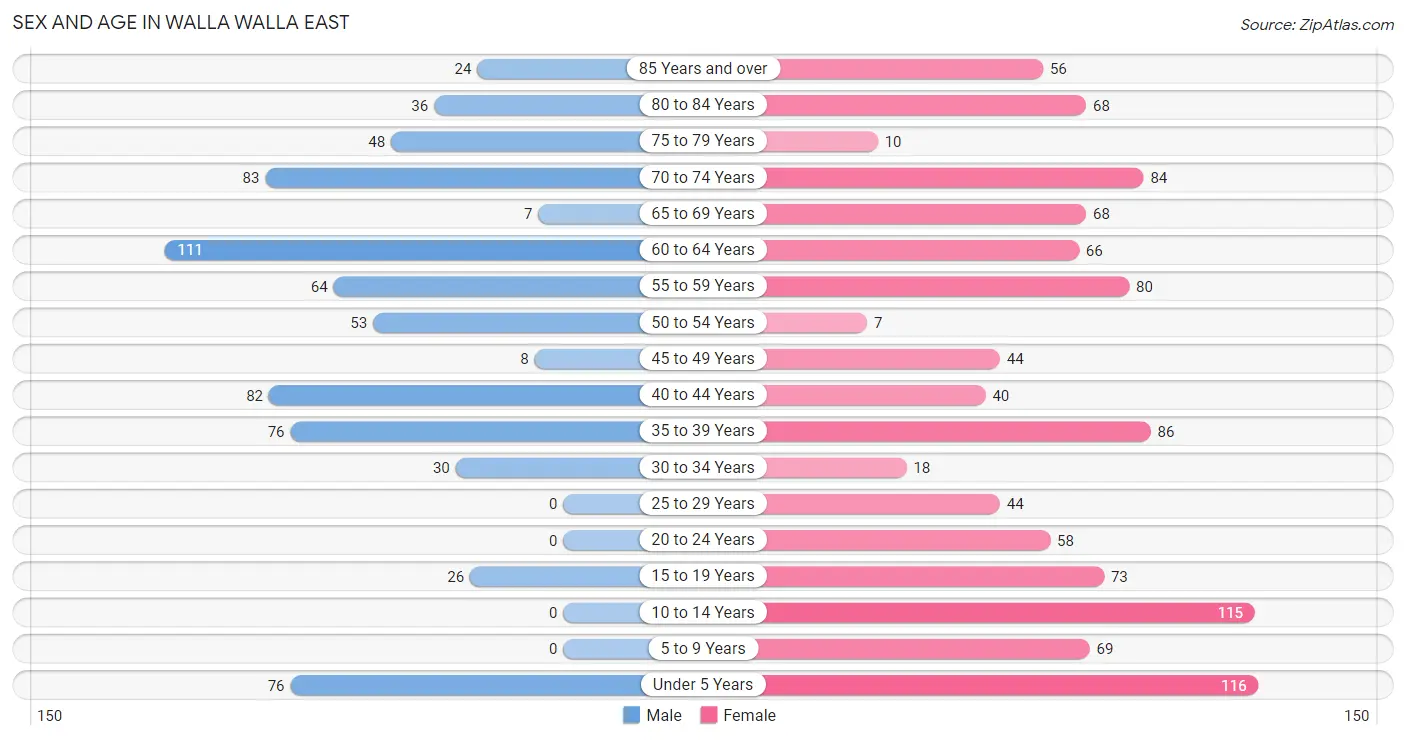
Sex and Age in Walla Walla East
Sex and Age in Walla Walla East
The most populous age groups in Walla Walla East are 60 to 64 Years (111 | 15.3%) for men and Under 5 Years (116 | 10.5%) for women.
| Age Bracket | Male | Female |
| Under 5 Years | 76 (10.5%) | 116 (10.5%) |
| 5 to 9 Years | 0 (0.0%) | 69 (6.3%) |
| 10 to 14 Years | 0 (0.0%) | 115 (10.4%) |
| 15 to 19 Years | 26 (3.6%) | 73 (6.6%) |
| 20 to 24 Years | 0 (0.0%) | 58 (5.3%) |
| 25 to 29 Years | 0 (0.0%) | 44 (4.0%) |
| 30 to 34 Years | 30 (4.1%) | 18 (1.6%) |
| 35 to 39 Years | 76 (10.5%) | 86 (7.8%) |
| 40 to 44 Years | 82 (11.3%) | 40 (3.6%) |
| 45 to 49 Years | 8 (1.1%) | 44 (4.0%) |
| 50 to 54 Years | 53 (7.3%) | 7 (0.6%) |
| 55 to 59 Years | 64 (8.8%) | 80 (7.3%) |
| 60 to 64 Years | 111 (15.3%) | 66 (6.0%) |
| 65 to 69 Years | 7 (1.0%) | 68 (6.2%) |
| 70 to 74 Years | 83 (11.5%) | 84 (7.6%) |
| 75 to 79 Years | 48 (6.6%) | 10 (0.9%) |
| 80 to 84 Years | 36 (5.0%) | 68 (6.2%) |
| 85 Years and over | 24 (3.3%) | 56 (5.1%) |
| Total | 724 (100.0%) | 1,102 (100.0%) |
Families and Households in Walla Walla East
Median Family Size in Walla Walla East
The median family size in Walla Walla East is 2.96 persons per family, with single male/father families (32 | 6.0%) accounting for the largest median family size of 3.28 persons per family. On the other hand, single female/mother families (45 | 8.4%) represent the smallest median family size with 2.56 persons per family.
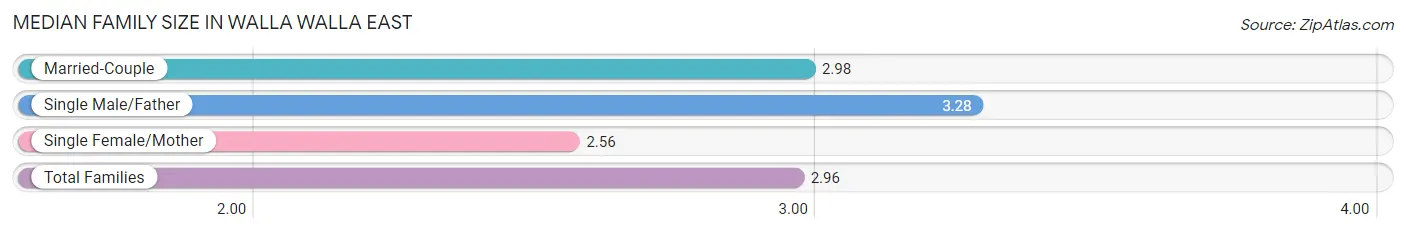
| Family Type | # Families | Family Size |
| Married-Couple | 456 (85.6%) | 2.98 |
| Single Male/Father | 32 (6.0%) | 3.28 |
| Single Female/Mother | 45 (8.4%) | 2.56 |
| Total Families | 533 (100.0%) | 2.96 |
Median Household Size in Walla Walla East
The median household size in Walla Walla East is 2.44 persons per household, with single male/father households (32 | 4.3%) accounting for the largest median household size of 3.28 persons per household. non-family households (214 | 28.6%) represent the smallest median household size with 1.05 persons per household.
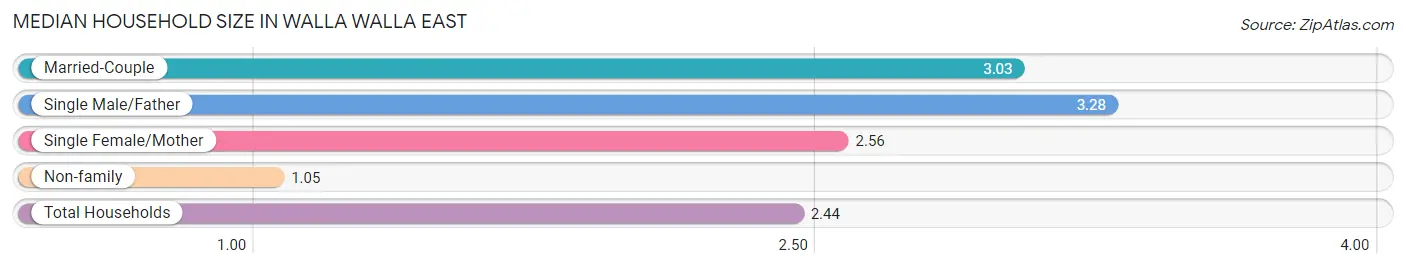
| Household Type | # Households | Household Size |
| Married-Couple | 456 (61.0%) | 3.03 |
| Single Male/Father | 32 (4.3%) | 3.28 |
| Single Female/Mother | 45 (6.0%) | 2.56 |
| Non-family | 214 (28.6%) | 1.05 |
| Total Households | 747 (100.0%) | 2.44 |
Household Size by Marriage Status in Walla Walla East
Out of a total of 747 households in Walla Walla East, 533 (71.4%) are family households, while 214 (28.6%) are nonfamily households. The most numerous type of family households are 2-person households, comprising 303, and the most common type of nonfamily households are 1-person households, comprising 204.
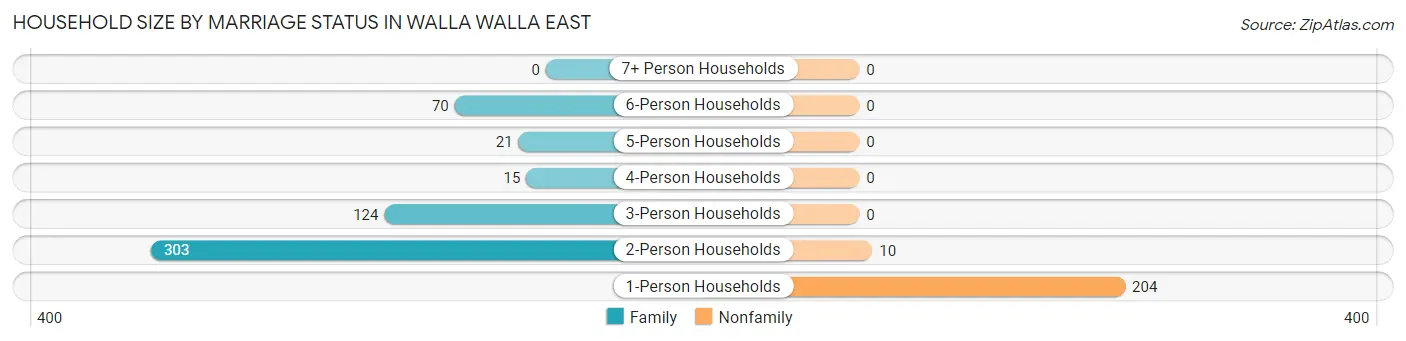
| Household Size | Family Households | Nonfamily Households |
| 1-Person Households | - | 204 (27.3%) |
| 2-Person Households | 303 (40.6%) | 10 (1.3%) |
| 3-Person Households | 124 (16.6%) | 0 (0.0%) |
| 4-Person Households | 15 (2.0%) | 0 (0.0%) |
| 5-Person Households | 21 (2.8%) | 0 (0.0%) |
| 6-Person Households | 70 (9.4%) | 0 (0.0%) |
| 7+ Person Households | 0 (0.0%) | 0 (0.0%) |
| Total | 533 (71.4%) | 214 (28.6%) |
Female Fertility in Walla Walla East
Fertility by Age in Walla Walla East
| Age Bracket | Women with Births | Births / 1,000 Women |
| 15 to 19 years | 0 (0.0%) | 0.0 |
| 20 to 34 years | 0 (0.0%) | 0.0 |
| 35 to 50 years | 0 (0.0%) | 0.0 |
| Total | 0 (0.0%) | 0.0 |
Fertility by Age by Marriage Status in Walla Walla East
| Age Bracket | Married | Unmarried |
| 15 to 19 years | 0 (0.0%) | 0 (0.0%) |
| 20 to 34 years | 0 (0.0%) | 0 (0.0%) |
| 35 to 50 years | 0 (0.0%) | 0 (0.0%) |
| Total | 0 (0.0%) | 0 (0.0%) |
Fertility by Education in Walla Walla East
| Educational Attainment | Women with Births | Births / 1,000 Women |
| Less than High School | 0 (0.0%) | 0.0 |
| High School Diploma | 0 (0.0%) | 0.0 |
| College or Associate's Degree | 0 (0.0%) | 0.0 |
| Bachelor's Degree | 0 (0.0%) | 0.0 |
| Graduate Degree | 0 (0.0%) | 0.0 |
| Total | 0 (0.0%) | 0.0 |
Fertility by Education by Marriage Status in Walla Walla East
| Educational Attainment | Married | Unmarried |
| Less than High School | 0 (0.0%) | 0 (0.0%) |
| High School Diploma | 0 (0.0%) | 0 (0.0%) |
| College or Associate's Degree | 0 (0.0%) | 0 (0.0%) |
| Bachelor's Degree | 0 (0.0%) | 0 (0.0%) |
| Graduate Degree | 0 (0.0%) | 0 (0.0%) |
| Total | 0 (0.0%) | 0 (0.0%) |
Employment Characteristics in Walla Walla East
Employment by Class of Employer in Walla Walla East
Among the 635 employed individuals in Walla Walla East, private company employees (272 | 42.8%), self-employed (not incorporated) (111 | 17.5%), and local government employees (85 | 13.4%) make up the most common classes of employment.
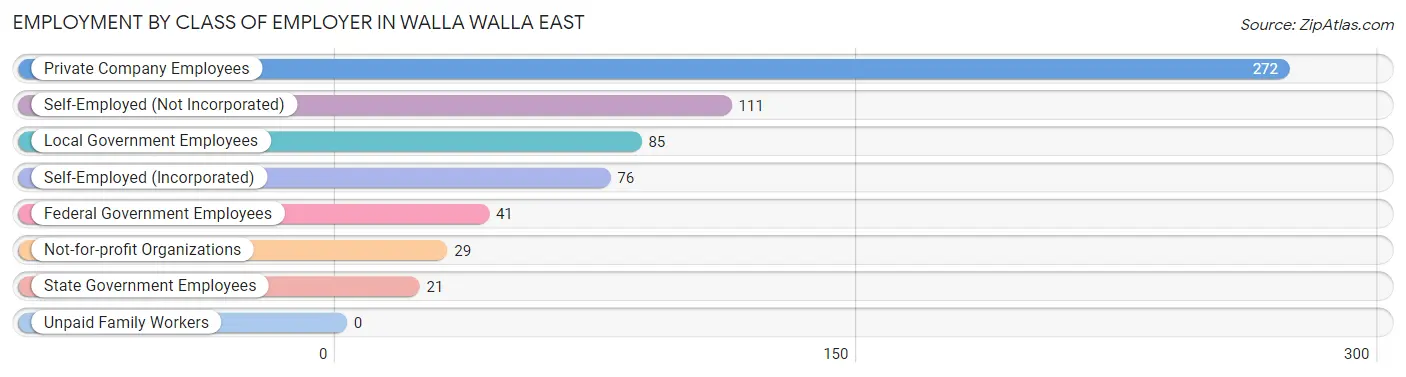
| Employer Class | # Employees | % Employees |
| Private Company Employees | 272 | 42.8% |
| Self-Employed (Incorporated) | 76 | 12.0% |
| Self-Employed (Not Incorporated) | 111 | 17.5% |
| Not-for-profit Organizations | 29 | 4.6% |
| Local Government Employees | 85 | 13.4% |
| State Government Employees | 21 | 3.3% |
| Federal Government Employees | 41 | 6.5% |
| Unpaid Family Workers | 0 | 0.0% |
| Total | 635 | 100.0% |
Employment Status by Age in Walla Walla East
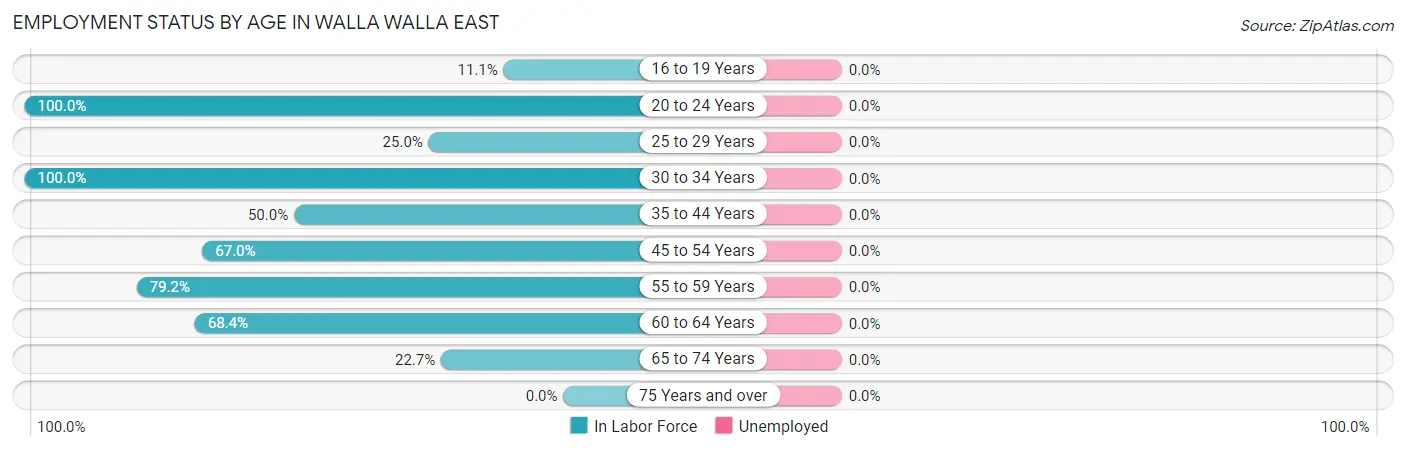
| Age Bracket | In Labor Force | Unemployed |
| 16 to 19 Years | 11 (11.1%) | 0 (0.0%) |
| 20 to 24 Years | 58 (100.0%) | 0 (0.0%) |
| 25 to 29 Years | 11 (25.0%) | 0 (0.0%) |
| 30 to 34 Years | 48 (100.0%) | 0 (0.0%) |
| 35 to 44 Years | 142 (50.0%) | 0 (0.0%) |
| 45 to 54 Years | 75 (67.0%) | 0 (0.0%) |
| 55 to 59 Years | 114 (79.2%) | 0 (0.0%) |
| 60 to 64 Years | 121 (68.4%) | 0 (0.0%) |
| 65 to 74 Years | 55 (22.7%) | 0 (0.0%) |
| 75 Years and over | 0 (0.0%) | 0 (0.0%) |
| Total | 635 (43.8%) | 0 (0.0%) |
Employment Status by Educational Attainment in Walla Walla East
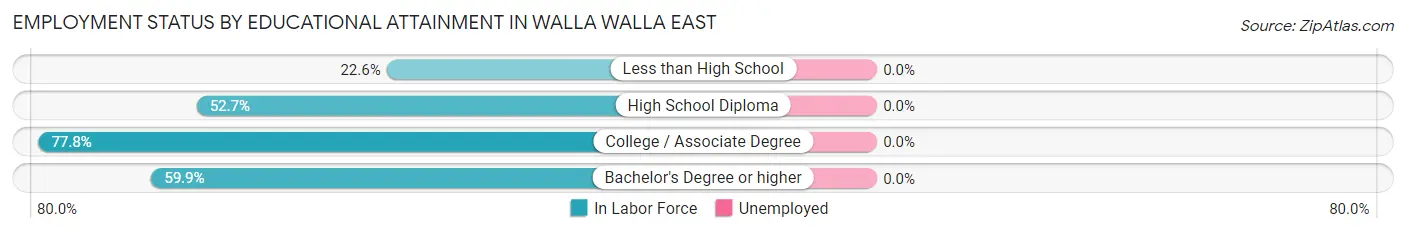
| Educational Attainment | In Labor Force | Unemployed |
| Less than High School | 14 (22.6%) | 0 (0.0%) |
| High School Diploma | 99 (52.7%) | 0 (0.0%) |
| College / Associate Degree | 274 (77.8%) | 0 (0.0%) |
| Bachelor's Degree or higher | 124 (59.9%) | 0 (0.0%) |
| Total | 511 (63.2%) | 0 (0.0%) |
Employment Occupations by Sex in Walla Walla East
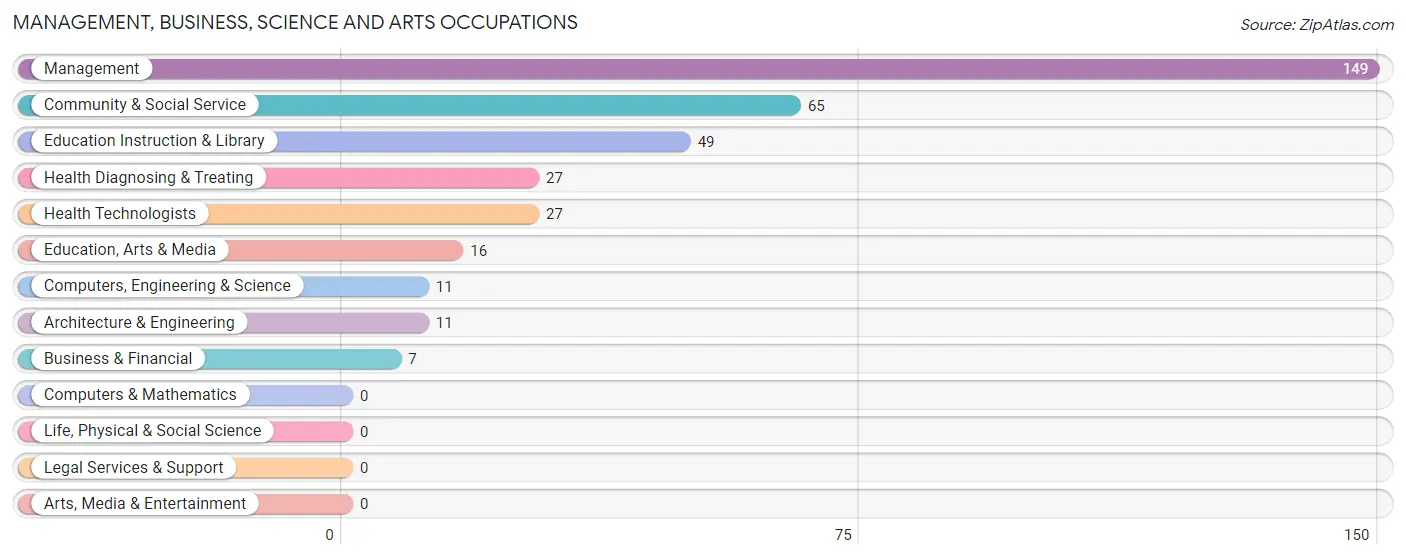
Management, Business, Science and Arts Occupations
The most common Management, Business, Science and Arts occupations in Walla Walla East are Management (149 | 24.1%), Community & Social Service (65 | 10.5%), Education Instruction & Library (49 | 7.9%), Health Diagnosing & Treating (27 | 4.4%), and Health Technologists (27 | 4.4%).
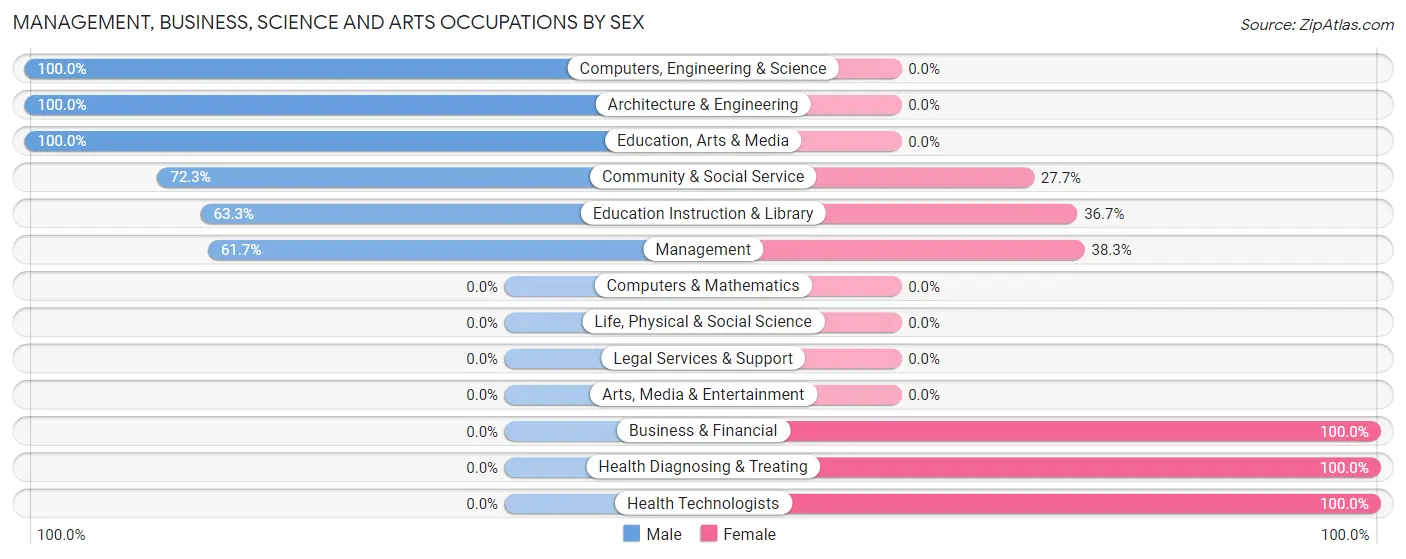
Management, Business, Science and Arts Occupations by Sex
Within the Management, Business, Science and Arts occupations in Walla Walla East, the most male-oriented occupations are Computers, Engineering & Science (100.0%), Architecture & Engineering (100.0%), and Education, Arts & Media (100.0%), while the most female-oriented occupations are Business & Financial (100.0%), Health Diagnosing & Treating (100.0%), and Health Technologists (100.0%).
| Occupation | Male | Female |
| Management | 92 (61.7%) | 57 (38.3%) |
| Business & Financial | 0 (0.0%) | 7 (100.0%) |
| Computers, Engineering & Science | 11 (100.0%) | 0 (0.0%) |
| Computers & Mathematics | 0 (0.0%) | 0 (0.0%) |
| Architecture & Engineering | 11 (100.0%) | 0 (0.0%) |
| Life, Physical & Social Science | 0 (0.0%) | 0 (0.0%) |
| Community & Social Service | 47 (72.3%) | 18 (27.7%) |
| Education, Arts & Media | 16 (100.0%) | 0 (0.0%) |
| Legal Services & Support | 0 (0.0%) | 0 (0.0%) |
| Education Instruction & Library | 31 (63.3%) | 18 (36.7%) |
| Arts, Media & Entertainment | 0 (0.0%) | 0 (0.0%) |
| Health Diagnosing & Treating | 0 (0.0%) | 27 (100.0%) |
| Health Technologists | 0 (0.0%) | 27 (100.0%) |
| Total (Category) | 150 (57.9%) | 109 (42.1%) |
| Total (Overall) | 328 (53.0%) | 291 (47.0%) |
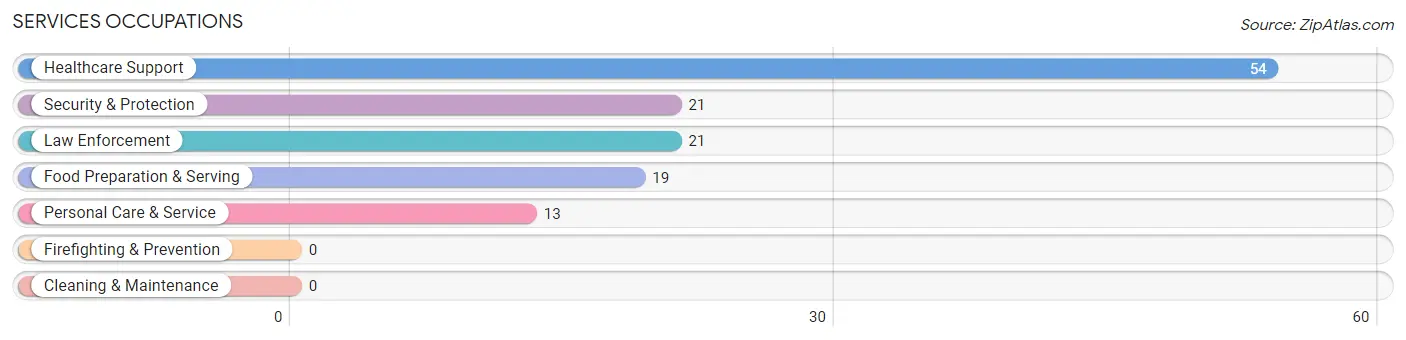
Services Occupations
The most common Services occupations in Walla Walla East are Healthcare Support (54 | 8.7%), Security & Protection (21 | 3.4%), Law Enforcement (21 | 3.4%), Food Preparation & Serving (19 | 3.1%), and Personal Care & Service (13 | 2.1%).
Services Occupations by Sex
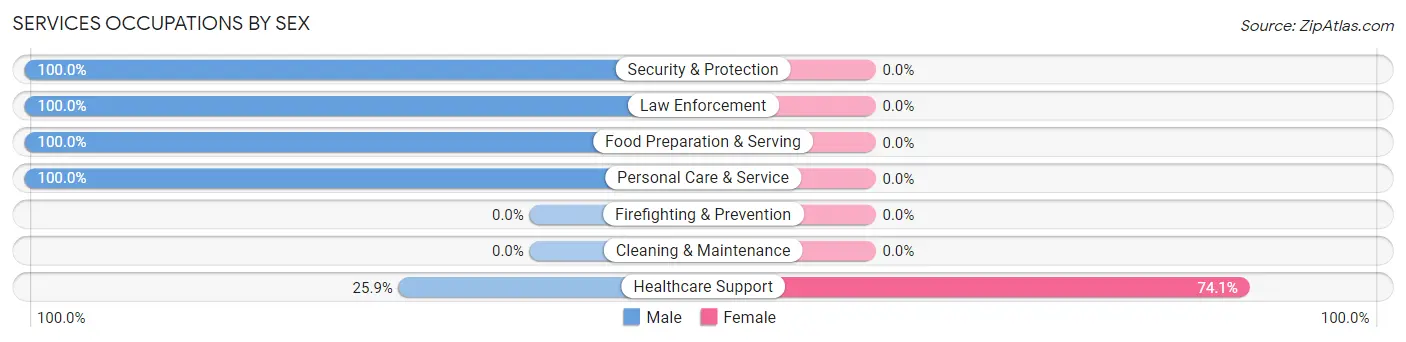
| Occupation | Male | Female |
| Healthcare Support | 14 (25.9%) | 40 (74.1%) |
| Security & Protection | 21 (100.0%) | 0 (0.0%) |
| Firefighting & Prevention | 0 (0.0%) | 0 (0.0%) |
| Law Enforcement | 21 (100.0%) | 0 (0.0%) |
| Food Preparation & Serving | 19 (100.0%) | 0 (0.0%) |
| Cleaning & Maintenance | 0 (0.0%) | 0 (0.0%) |
| Personal Care & Service | 13 (100.0%) | 0 (0.0%) |
| Total (Category) | 67 (62.6%) | 40 (37.4%) |
| Total (Overall) | 328 (53.0%) | 291 (47.0%) |
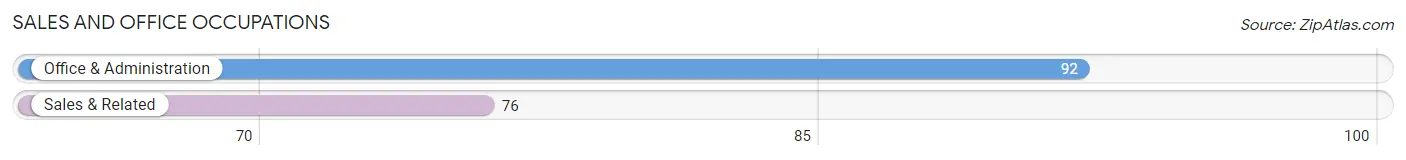
Sales and Office Occupations
The most common Sales and Office occupations in Walla Walla East are Office & Administration (92 | 14.9%), and Sales & Related (76 | 12.3%).
Sales and Office Occupations by Sex
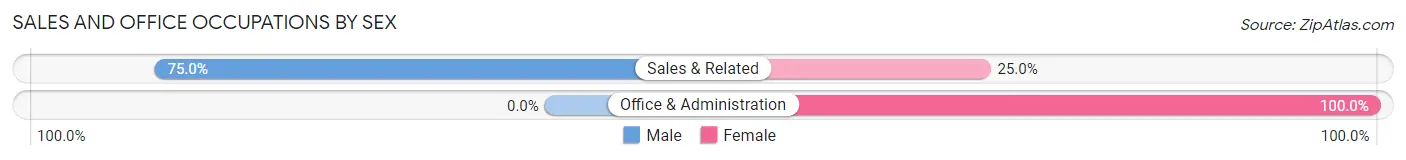
| Occupation | Male | Female |
| Sales & Related | 57 (75.0%) | 19 (25.0%) |
| Office & Administration | 0 (0.0%) | 92 (100.0%) |
| Total (Category) | 57 (33.9%) | 111 (66.1%) |
| Total (Overall) | 328 (53.0%) | 291 (47.0%) |
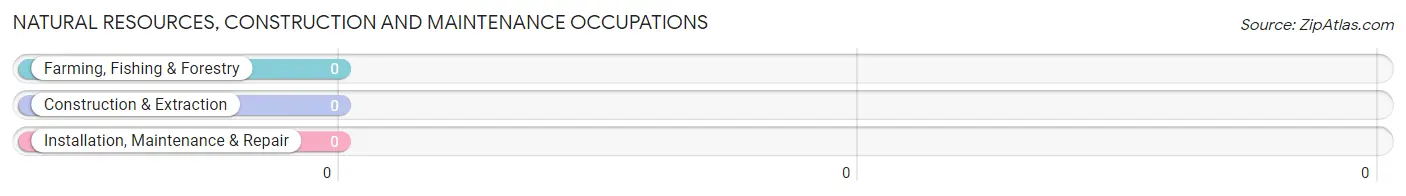
Natural Resources, Construction and Maintenance Occupations
Natural Resources, Construction and Maintenance Occupations by Sex
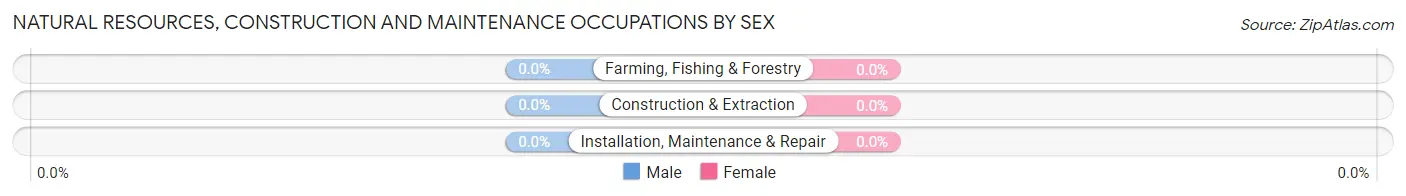
| Occupation | Male | Female |
| Farming, Fishing & Forestry | 0 (0.0%) | 0 (0.0%) |
| Construction & Extraction | 0 (0.0%) | 0 (0.0%) |
| Installation, Maintenance & Repair | 0 (0.0%) | 0 (0.0%) |
| Total (Category) | 0 (0.0%) | 0 (0.0%) |
| Total (Overall) | 328 (53.0%) | 291 (47.0%) |
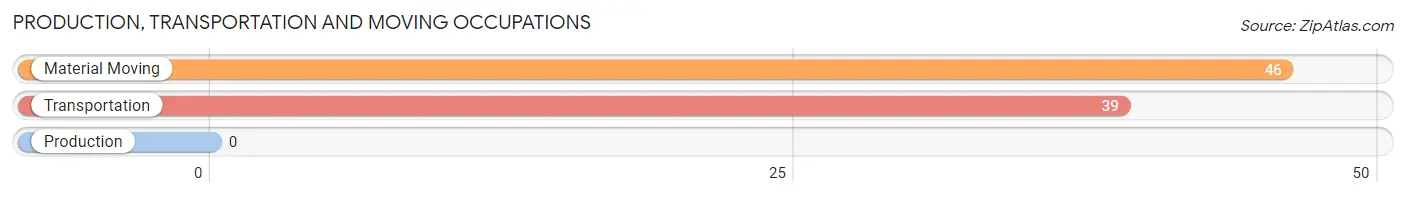
Production, Transportation and Moving Occupations
The most common Production, Transportation and Moving occupations in Walla Walla East are Material Moving (46 | 7.4%), and Transportation (39 | 6.3%).
Production, Transportation and Moving Occupations by Sex
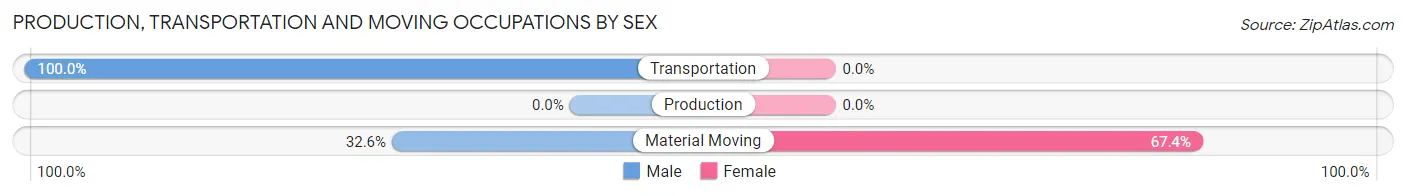
| Occupation | Male | Female |
| Production | 0 (0.0%) | 0 (0.0%) |
| Transportation | 39 (100.0%) | 0 (0.0%) |
| Material Moving | 15 (32.6%) | 31 (67.4%) |
| Total (Category) | 54 (63.5%) | 31 (36.5%) |
| Total (Overall) | 328 (53.0%) | 291 (47.0%) |
Employment Industries by Sex in Walla Walla East
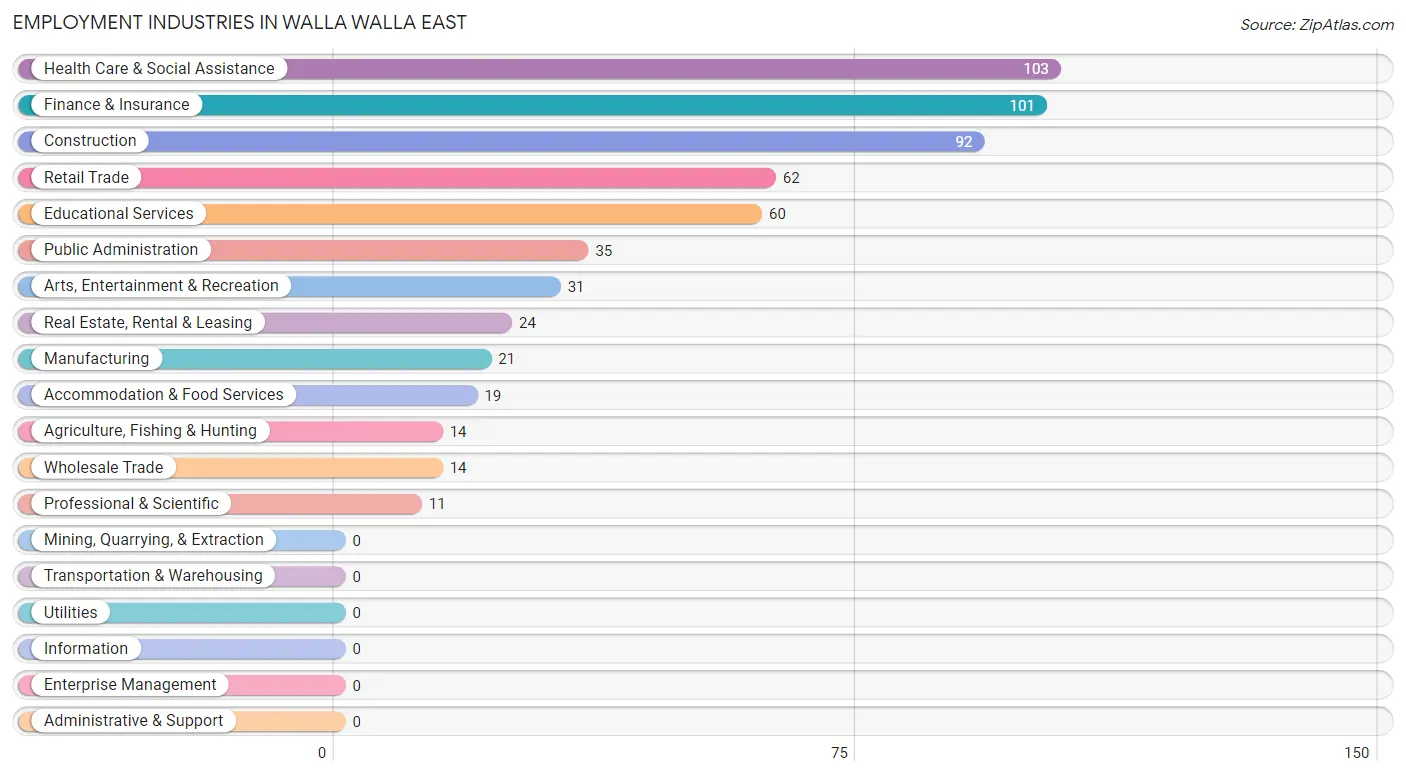
Employment Industries in Walla Walla East
The major employment industries in Walla Walla East include Health Care & Social Assistance (103 | 16.6%), Finance & Insurance (101 | 16.3%), Construction (92 | 14.9%), Retail Trade (62 | 10.0%), and Educational Services (60 | 9.7%).
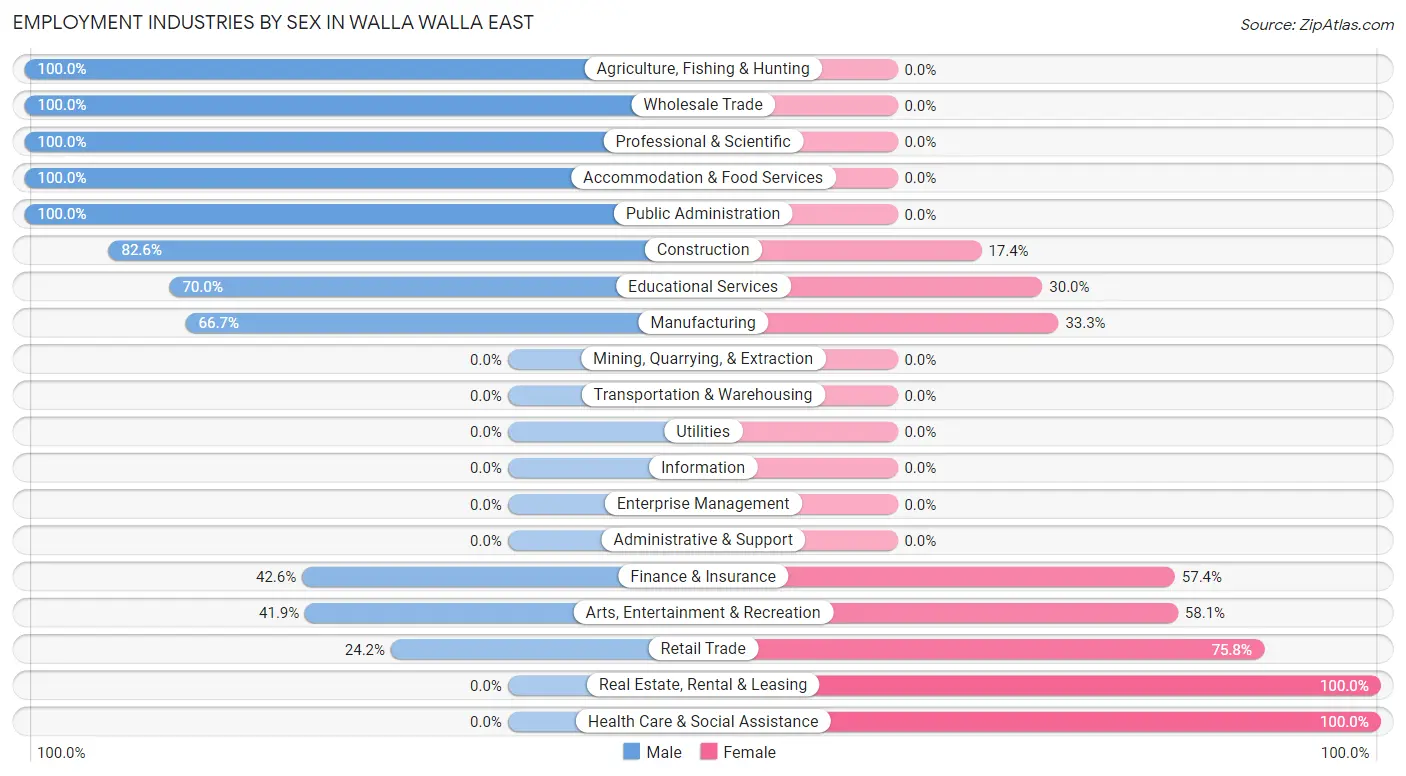
Employment Industries by Sex in Walla Walla East
The Walla Walla East industries that see more men than women are Agriculture, Fishing & Hunting (100.0%), Wholesale Trade (100.0%), and Professional & Scientific (100.0%), whereas the industries that tend to have a higher number of women are Real Estate, Rental & Leasing (100.0%), Health Care & Social Assistance (100.0%), and Retail Trade (75.8%).
| Industry | Male | Female |
| Agriculture, Fishing & Hunting | 14 (100.0%) | 0 (0.0%) |
| Mining, Quarrying, & Extraction | 0 (0.0%) | 0 (0.0%) |
| Construction | 76 (82.6%) | 16 (17.4%) |
| Manufacturing | 14 (66.7%) | 7 (33.3%) |
| Wholesale Trade | 14 (100.0%) | 0 (0.0%) |
| Retail Trade | 15 (24.2%) | 47 (75.8%) |
| Transportation & Warehousing | 0 (0.0%) | 0 (0.0%) |
| Utilities | 0 (0.0%) | 0 (0.0%) |
| Information | 0 (0.0%) | 0 (0.0%) |
| Finance & Insurance | 43 (42.6%) | 58 (57.4%) |
| Real Estate, Rental & Leasing | 0 (0.0%) | 24 (100.0%) |
| Professional & Scientific | 11 (100.0%) | 0 (0.0%) |
| Enterprise Management | 0 (0.0%) | 0 (0.0%) |
| Administrative & Support | 0 (0.0%) | 0 (0.0%) |
| Educational Services | 42 (70.0%) | 18 (30.0%) |
| Health Care & Social Assistance | 0 (0.0%) | 103 (100.0%) |
| Arts, Entertainment & Recreation | 13 (41.9%) | 18 (58.1%) |
| Accommodation & Food Services | 19 (100.0%) | 0 (0.0%) |
| Public Administration | 35 (100.0%) | 0 (0.0%) |
| Total | 328 (53.0%) | 291 (47.0%) |
Education in Walla Walla East
School Enrollment in Walla Walla East
The most common levels of schooling among the 216 students in Walla Walla East are high school (99 | 45.8%), middle school (58 | 26.9%), and college / undergraduate (30 | 13.9%).
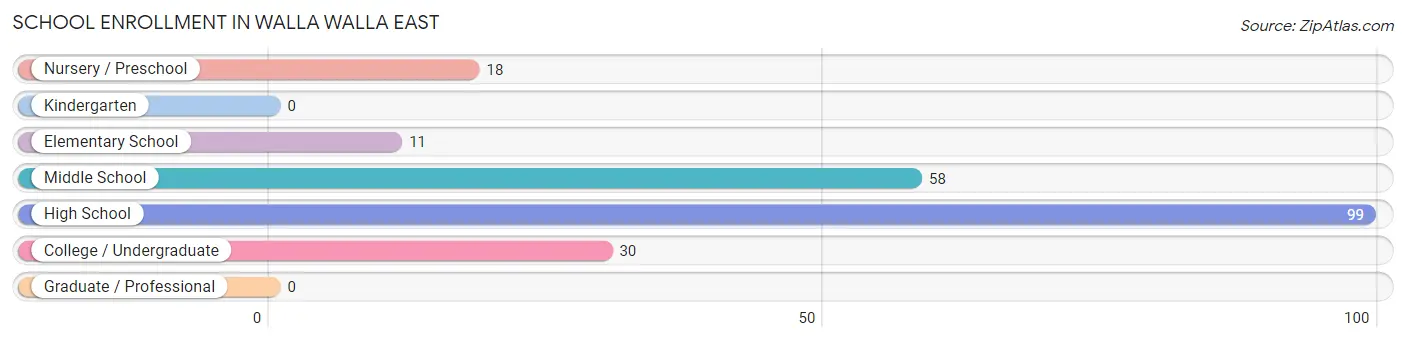
| School Level | # Students | % Students |
| Nursery / Preschool | 18 | 8.3% |
| Kindergarten | 0 | 0.0% |
| Elementary School | 11 | 5.1% |
| Middle School | 58 | 26.9% |
| High School | 99 | 45.8% |
| College / Undergraduate | 30 | 13.9% |
| Graduate / Professional | 0 | 0.0% |
| Total | 216 | 100.0% |
School Enrollment by Age by Funding Source in Walla Walla East
Out of a total of 216 students who are enrolled in schools in Walla Walla East, 41 (19.0%) attend a private institution, while the remaining 175 (81.0%) are enrolled in public schools. The age group of 3 to 4 year olds has the highest likelihood of being enrolled in private schools, with 18 (100.0% in the age bracket) enrolled. Conversely, the age group of 15 to 17 year olds has the lowest likelihood of being enrolled in a private school, with 88 (100.0% in the age bracket) attending a public institution.
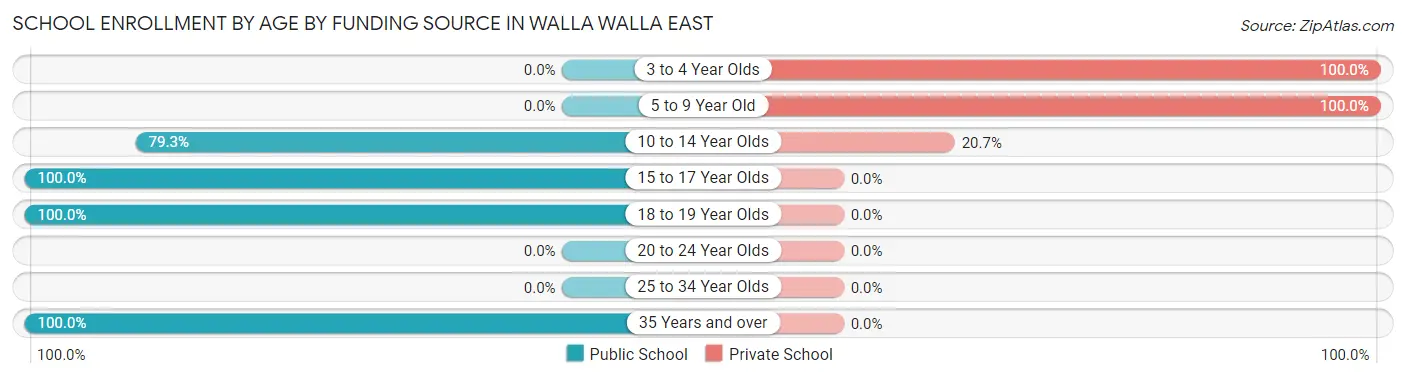
| Age Bracket | Public School | Private School |
| 3 to 4 Year Olds | 0 (0.0%) | 18 (100.0%) |
| 5 to 9 Year Old | 0 (0.0%) | 11 (100.0%) |
| 10 to 14 Year Olds | 46 (79.3%) | 12 (20.7%) |
| 15 to 17 Year Olds | 88 (100.0%) | 0 (0.0%) |
| 18 to 19 Year Olds | 11 (100.0%) | 0 (0.0%) |
| 20 to 24 Year Olds | 0 (0.0%) | 0 (0.0%) |
| 25 to 34 Year Olds | 0 (0.0%) | 0 (0.0%) |
| 35 Years and over | 30 (100.0%) | 0 (0.0%) |
| Total | 175 (81.0%) | 41 (19.0%) |
Educational Attainment by Field of Study in Walla Walla East
Education (157 | 45.8%), science & technology (65 | 19.0%), business (34 | 9.9%), bio, nature & agricultural (26 | 7.6%), and engineering (18 | 5.2%) are the most common fields of study among 343 individuals in Walla Walla East who have obtained a bachelor's degree or higher.
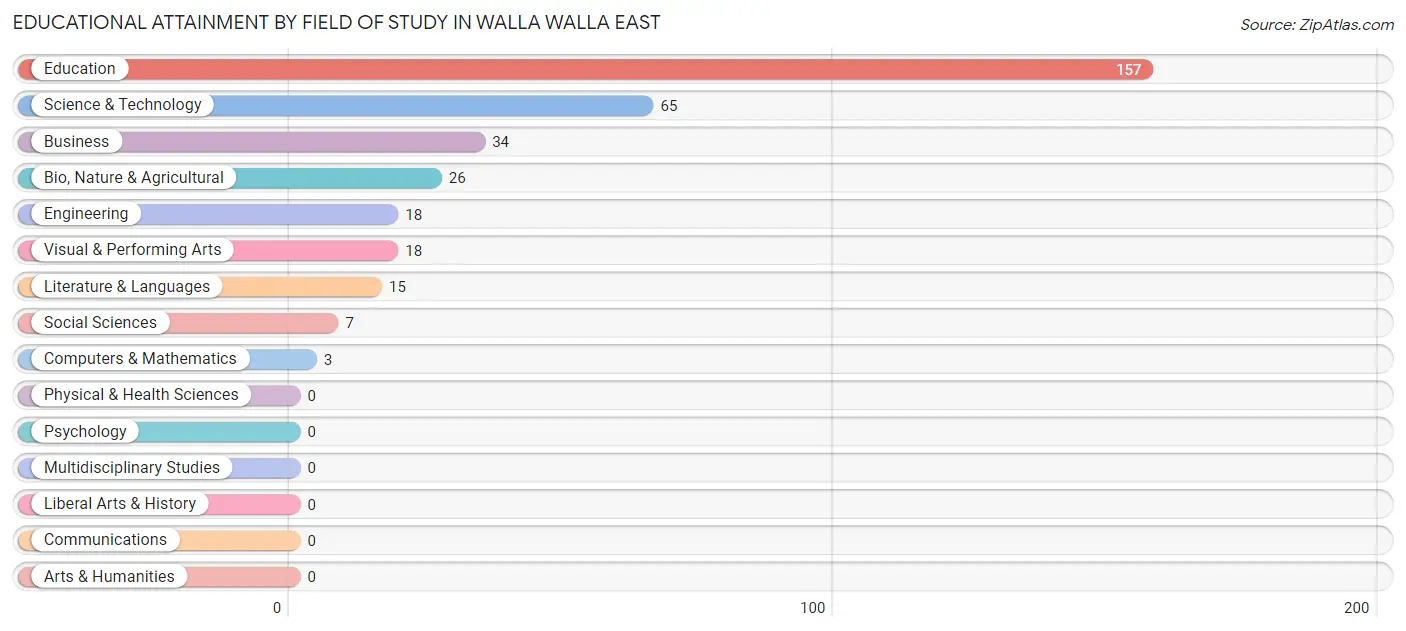
| Field of Study | # Graduates | % Graduates |
| Computers & Mathematics | 3 | 0.9% |
| Bio, Nature & Agricultural | 26 | 7.6% |
| Physical & Health Sciences | 0 | 0.0% |
| Psychology | 0 | 0.0% |
| Social Sciences | 7 | 2.0% |
| Engineering | 18 | 5.2% |
| Multidisciplinary Studies | 0 | 0.0% |
| Science & Technology | 65 | 19.0% |
| Business | 34 | 9.9% |
| Education | 157 | 45.8% |
| Literature & Languages | 15 | 4.4% |
| Liberal Arts & History | 0 | 0.0% |
| Visual & Performing Arts | 18 | 5.2% |
| Communications | 0 | 0.0% |
| Arts & Humanities | 0 | 0.0% |
| Total | 343 | 100.0% |
Transportation & Commute in Walla Walla East
Vehicle Availability by Sex in Walla Walla East
The most prevalent vehicle ownership categories in Walla Walla East are males with 2 vehicles (242, accounting for 70.4%) and females with 2 vehicles (145, making up 83.2%).
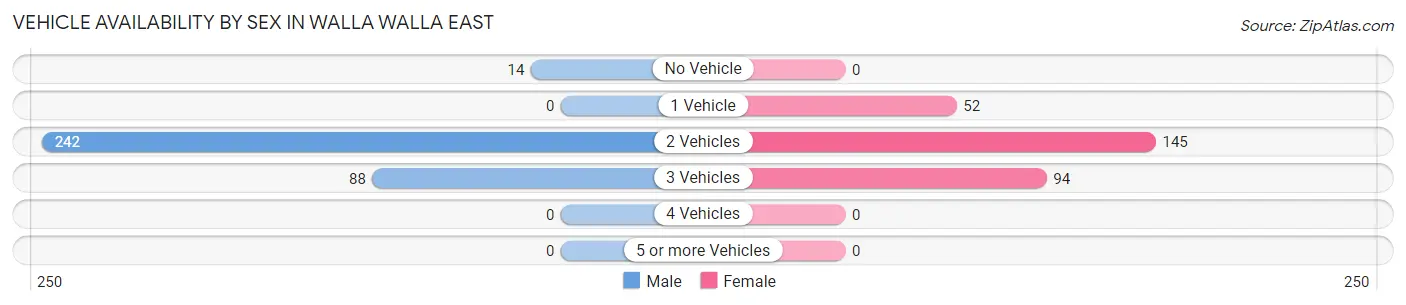
| Vehicles Available | Male | Female |
| No Vehicle | 14 (4.1%) | 0 (0.0%) |
| 1 Vehicle | 0 (0.0%) | 52 (17.9%) |
| 2 Vehicles | 242 (70.4%) | 145 (49.8%) |
| 3 Vehicles | 88 (25.6%) | 94 (32.3%) |
| 4 Vehicles | 0 (0.0%) | 0 (0.0%) |
| 5 or more Vehicles | 0 (0.0%) | 0 (0.0%) |
| Total | 344 (100.0%) | 291 (100.0%) |
Commute Time in Walla Walla East
The most frequently occuring commute durations in Walla Walla East are 15 to 19 minutes (158 commuters, 25.8%), 10 to 14 minutes (136 commuters, 22.2%), and 5 to 9 minutes (122 commuters, 19.9%).
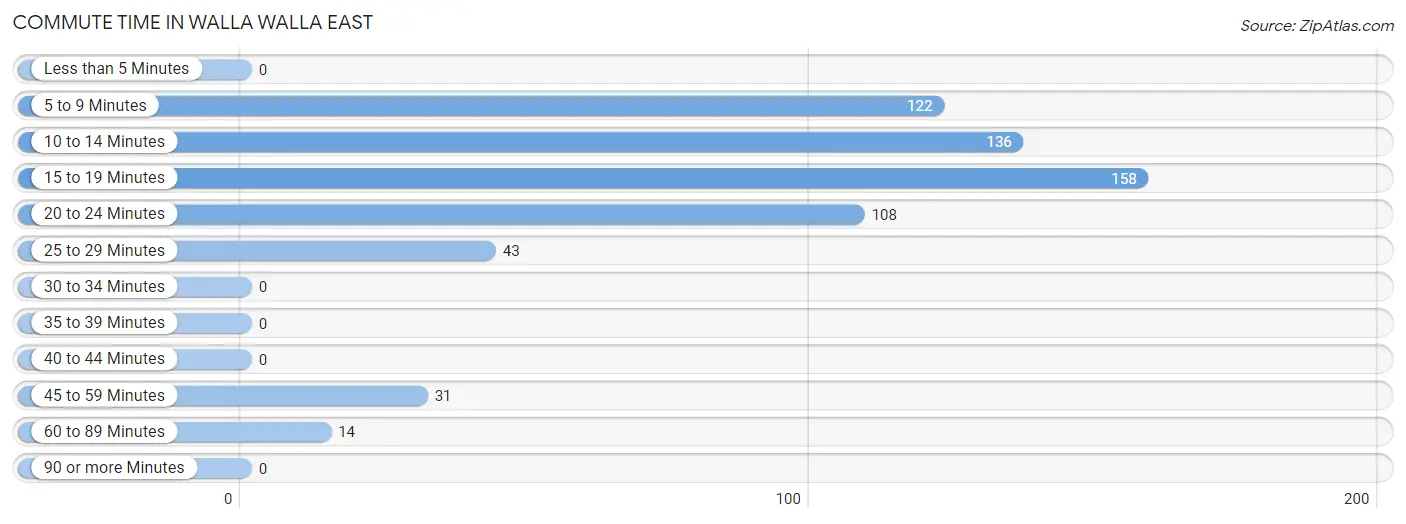
| Commute Time | # Commuters | % Commuters |
| Less than 5 Minutes | 0 | 0.0% |
| 5 to 9 Minutes | 122 | 19.9% |
| 10 to 14 Minutes | 136 | 22.2% |
| 15 to 19 Minutes | 158 | 25.8% |
| 20 to 24 Minutes | 108 | 17.6% |
| 25 to 29 Minutes | 43 | 7.0% |
| 30 to 34 Minutes | 0 | 0.0% |
| 35 to 39 Minutes | 0 | 0.0% |
| 40 to 44 Minutes | 0 | 0.0% |
| 45 to 59 Minutes | 31 | 5.1% |
| 60 to 89 Minutes | 14 | 2.3% |
| 90 or more Minutes | 0 | 0.0% |
Commute Time by Sex in Walla Walla East
The most common commute times in Walla Walla East are 20 to 24 minutes (90 commuters, 27.4%) for males and 15 to 19 minutes (110 commuters, 38.7%) for females.
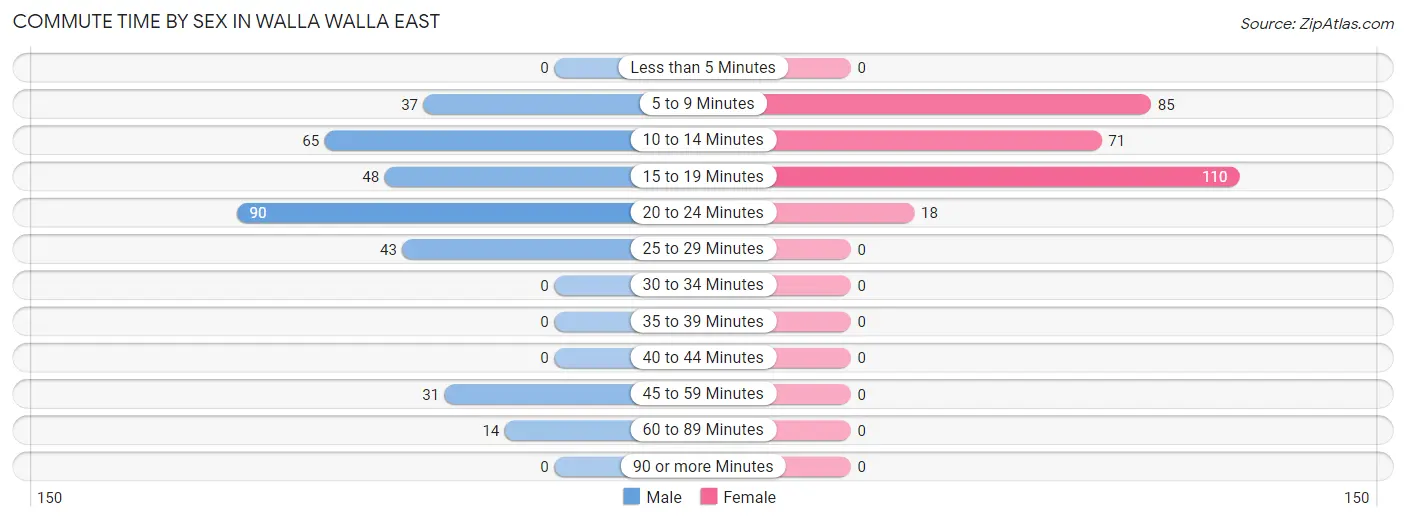
| Commute Time | Male | Female |
| Less than 5 Minutes | 0 (0.0%) | 0 (0.0%) |
| 5 to 9 Minutes | 37 (11.3%) | 85 (29.9%) |
| 10 to 14 Minutes | 65 (19.8%) | 71 (25.0%) |
| 15 to 19 Minutes | 48 (14.6%) | 110 (38.7%) |
| 20 to 24 Minutes | 90 (27.4%) | 18 (6.3%) |
| 25 to 29 Minutes | 43 (13.1%) | 0 (0.0%) |
| 30 to 34 Minutes | 0 (0.0%) | 0 (0.0%) |
| 35 to 39 Minutes | 0 (0.0%) | 0 (0.0%) |
| 40 to 44 Minutes | 0 (0.0%) | 0 (0.0%) |
| 45 to 59 Minutes | 31 (9.5%) | 0 (0.0%) |
| 60 to 89 Minutes | 14 (4.3%) | 0 (0.0%) |
| 90 or more Minutes | 0 (0.0%) | 0 (0.0%) |
Time of Departure to Work by Sex in Walla Walla East
The most frequent times of departure to work in Walla Walla East are 6:30 AM to 6:59 AM (144, 43.9%) for males and 7:00 AM to 7:29 AM (122, 43.0%) for females.
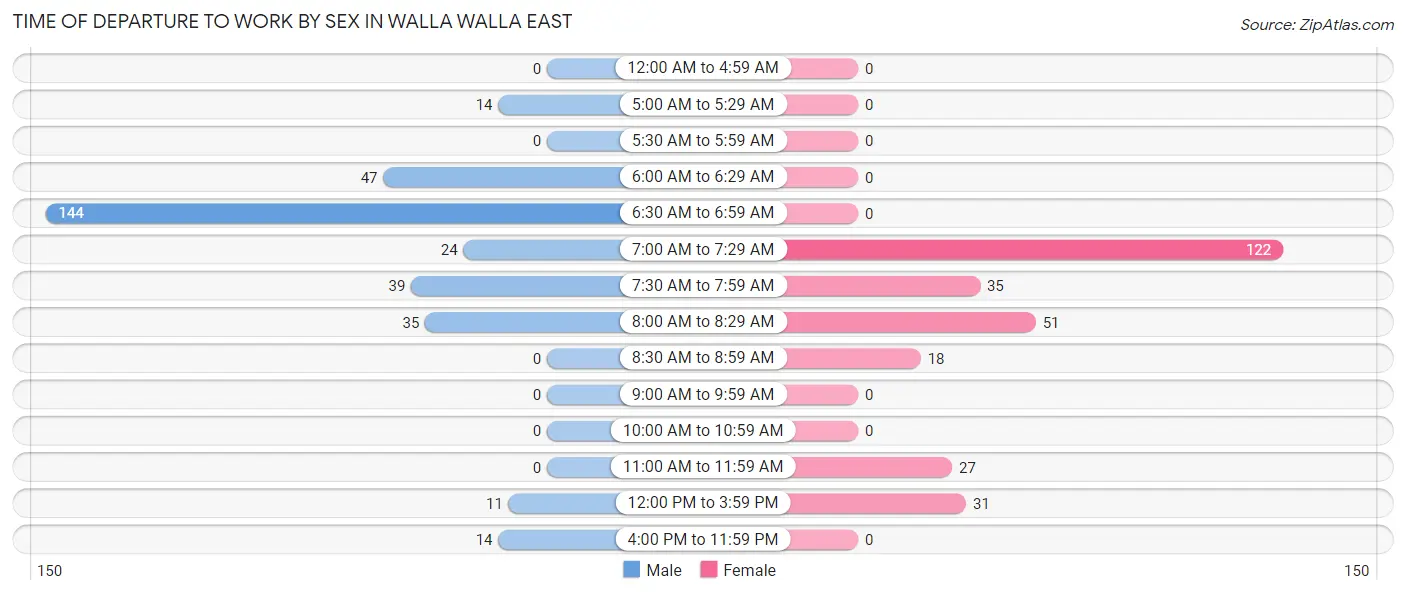
| Time of Departure | Male | Female |
| 12:00 AM to 4:59 AM | 0 (0.0%) | 0 (0.0%) |
| 5:00 AM to 5:29 AM | 14 (4.3%) | 0 (0.0%) |
| 5:30 AM to 5:59 AM | 0 (0.0%) | 0 (0.0%) |
| 6:00 AM to 6:29 AM | 47 (14.3%) | 0 (0.0%) |
| 6:30 AM to 6:59 AM | 144 (43.9%) | 0 (0.0%) |
| 7:00 AM to 7:29 AM | 24 (7.3%) | 122 (43.0%) |
| 7:30 AM to 7:59 AM | 39 (11.9%) | 35 (12.3%) |
| 8:00 AM to 8:29 AM | 35 (10.7%) | 51 (18.0%) |
| 8:30 AM to 8:59 AM | 0 (0.0%) | 18 (6.3%) |
| 9:00 AM to 9:59 AM | 0 (0.0%) | 0 (0.0%) |
| 10:00 AM to 10:59 AM | 0 (0.0%) | 0 (0.0%) |
| 11:00 AM to 11:59 AM | 0 (0.0%) | 27 (9.5%) |
| 12:00 PM to 3:59 PM | 11 (3.4%) | 31 (10.9%) |
| 4:00 PM to 11:59 PM | 14 (4.3%) | 0 (0.0%) |
| Total | 328 (100.0%) | 284 (100.0%) |
Housing Occupancy in Walla Walla East
Occupancy by Ownership in Walla Walla East
Of the total 747 dwellings in Walla Walla East, owner-occupied units account for 647 (86.6%), while renter-occupied units make up 100 (13.4%).
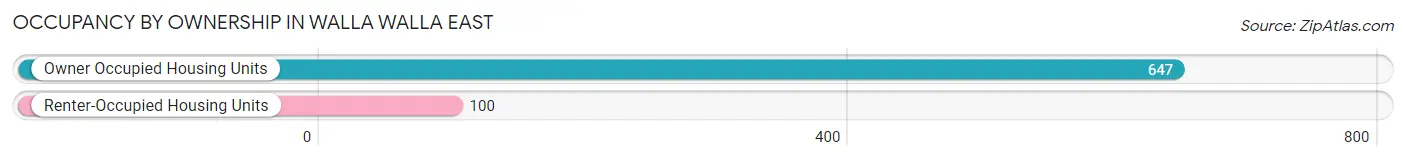
| Occupancy | # Housing Units | % Housing Units |
| Owner Occupied Housing Units | 647 | 86.6% |
| Renter-Occupied Housing Units | 100 | 13.4% |
| Total Occupied Housing Units | 747 | 100.0% |
Occupancy by Household Size in Walla Walla East
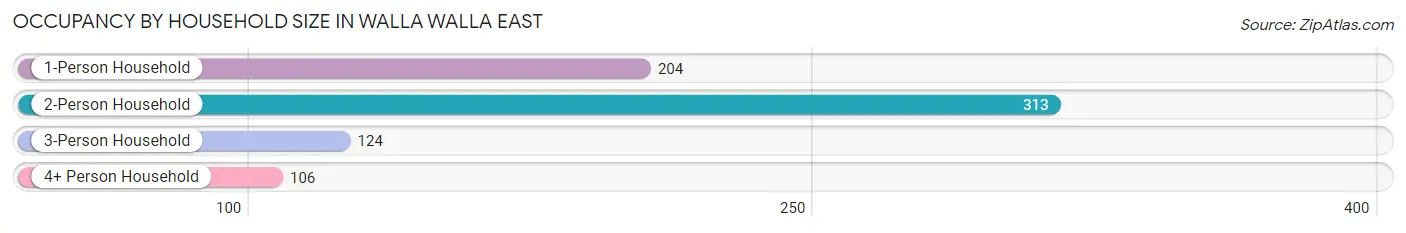
| Household Size | # Housing Units | % Housing Units |
| 1-Person Household | 204 | 27.3% |
| 2-Person Household | 313 | 41.9% |
| 3-Person Household | 124 | 16.6% |
| 4+ Person Household | 106 | 14.2% |
| Total Housing Units | 747 | 100.0% |
Occupancy by Ownership by Household Size in Walla Walla East
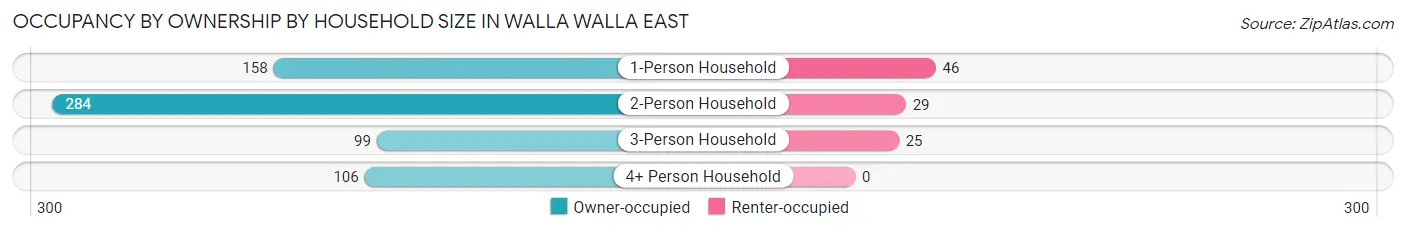
| Household Size | Owner-occupied | Renter-occupied |
| 1-Person Household | 158 (77.4%) | 46 (22.6%) |
| 2-Person Household | 284 (90.7%) | 29 (9.3%) |
| 3-Person Household | 99 (79.8%) | 25 (20.2%) |
| 4+ Person Household | 106 (100.0%) | 0 (0.0%) |
| Total Housing Units | 647 (86.6%) | 100 (13.4%) |
Occupancy by Educational Attainment in Walla Walla East
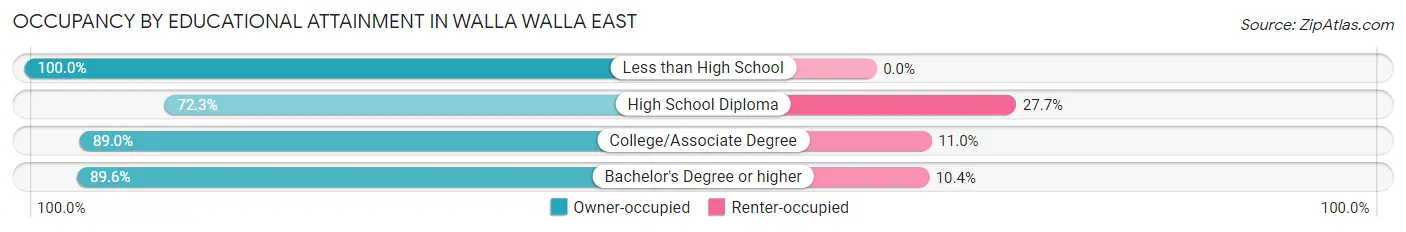
| Household Size | Owner-occupied | Renter-occupied |
| Less than High School | 48 (100.0%) | 0 (0.0%) |
| High School Diploma | 107 (72.3%) | 41 (27.7%) |
| College/Associate Degree | 260 (89.0%) | 32 (11.0%) |
| Bachelor's Degree or higher | 232 (89.6%) | 27 (10.4%) |
Occupancy by Age of Householder in Walla Walla East
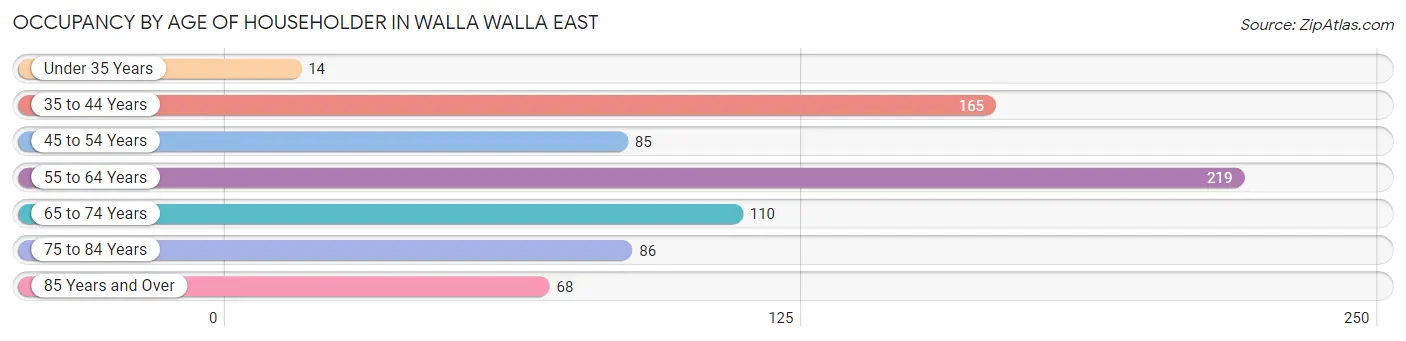
| Age Bracket | # Households | % Households |
| Under 35 Years | 14 | 1.9% |
| 35 to 44 Years | 165 | 22.1% |
| 45 to 54 Years | 85 | 11.4% |
| 55 to 64 Years | 219 | 29.3% |
| 65 to 74 Years | 110 | 14.7% |
| 75 to 84 Years | 86 | 11.5% |
| 85 Years and Over | 68 | 9.1% |
| Total | 747 | 100.0% |
Housing Finances in Walla Walla East
Median Income by Occupancy in Walla Walla East
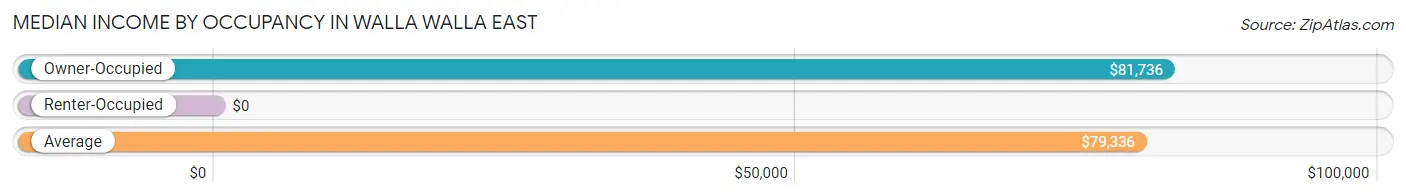
| Occupancy Type | # Households | Median Income |
| Owner-Occupied | 647 (86.6%) | $81,736 |
| Renter-Occupied | 100 (13.4%) | $0 |
| Average | 747 (100.0%) | $79,336 |
Occupancy by Householder Income Bracket in Walla Walla East
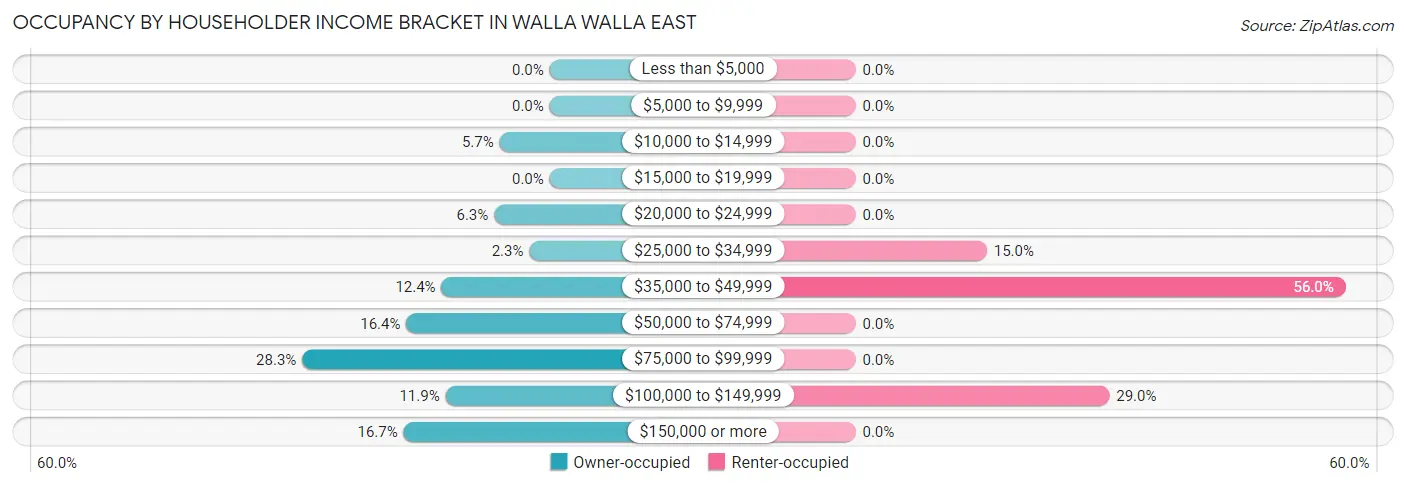
| Income Bracket | Owner-occupied | Renter-occupied |
| Less than $5,000 | 0 (0.0%) | 0 (0.0%) |
| $5,000 to $9,999 | 0 (0.0%) | 0 (0.0%) |
| $10,000 to $14,999 | 37 (5.7%) | 0 (0.0%) |
| $15,000 to $19,999 | 0 (0.0%) | 0 (0.0%) |
| $20,000 to $24,999 | 41 (6.3%) | 0 (0.0%) |
| $25,000 to $34,999 | 15 (2.3%) | 15 (15.0%) |
| $35,000 to $49,999 | 80 (12.4%) | 56 (56.0%) |
| $50,000 to $74,999 | 106 (16.4%) | 0 (0.0%) |
| $75,000 to $99,999 | 183 (28.3%) | 0 (0.0%) |
| $100,000 to $149,999 | 77 (11.9%) | 29 (29.0%) |
| $150,000 or more | 108 (16.7%) | 0 (0.0%) |
| Total | 647 (100.0%) | 100 (100.0%) |
Monthly Housing Cost Tiers in Walla Walla East
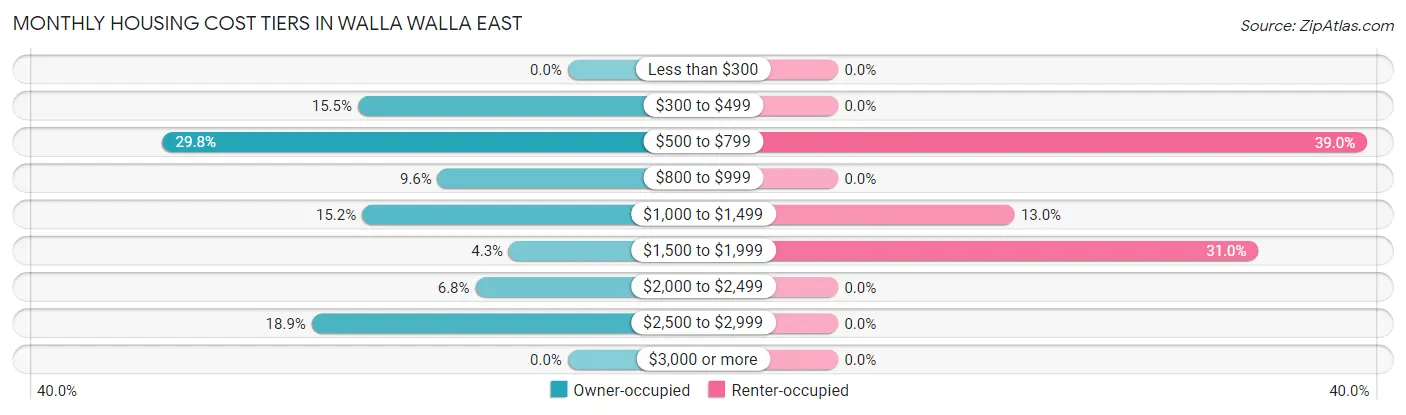
| Monthly Cost | Owner-occupied | Renter-occupied |
| Less than $300 | 0 (0.0%) | 0 (0.0%) |
| $300 to $499 | 100 (15.5%) | 0 (0.0%) |
| $500 to $799 | 193 (29.8%) | 39 (39.0%) |
| $800 to $999 | 62 (9.6%) | 0 (0.0%) |
| $1,000 to $1,499 | 98 (15.1%) | 13 (13.0%) |
| $1,500 to $1,999 | 28 (4.3%) | 31 (31.0%) |
| $2,000 to $2,499 | 44 (6.8%) | 0 (0.0%) |
| $2,500 to $2,999 | 122 (18.9%) | 0 (0.0%) |
| $3,000 or more | 0 (0.0%) | 0 (0.0%) |
| Total | 647 (100.0%) | 100 (100.0%) |
Physical Housing Characteristics in Walla Walla East
Housing Structures in Walla Walla East
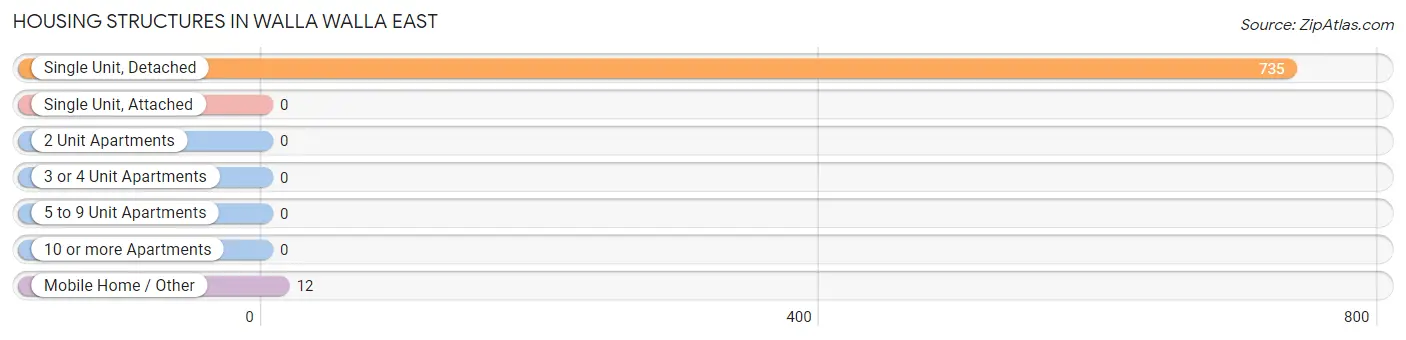
| Structure Type | # Housing Units | % Housing Units |
| Single Unit, Detached | 735 | 98.4% |
| Single Unit, Attached | 0 | 0.0% |
| 2 Unit Apartments | 0 | 0.0% |
| 3 or 4 Unit Apartments | 0 | 0.0% |
| 5 to 9 Unit Apartments | 0 | 0.0% |
| 10 or more Apartments | 0 | 0.0% |
| Mobile Home / Other | 12 | 1.6% |
| Total | 747 | 100.0% |
Housing Structures by Occupancy in Walla Walla East
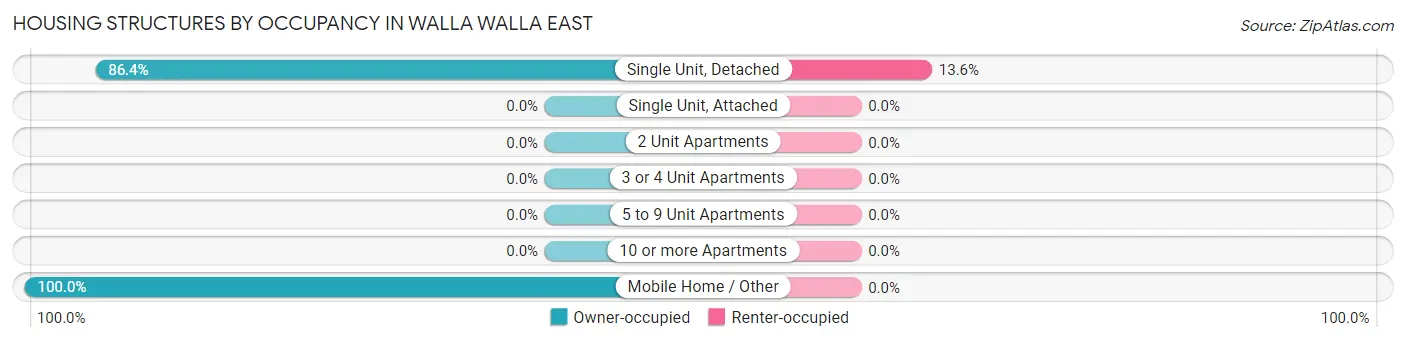
| Structure Type | Owner-occupied | Renter-occupied |
| Single Unit, Detached | 635 (86.4%) | 100 (13.6%) |
| Single Unit, Attached | 0 (0.0%) | 0 (0.0%) |
| 2 Unit Apartments | 0 (0.0%) | 0 (0.0%) |
| 3 or 4 Unit Apartments | 0 (0.0%) | 0 (0.0%) |
| 5 to 9 Unit Apartments | 0 (0.0%) | 0 (0.0%) |
| 10 or more Apartments | 0 (0.0%) | 0 (0.0%) |
| Mobile Home / Other | 12 (100.0%) | 0 (0.0%) |
| Total | 647 (86.6%) | 100 (13.4%) |
Housing Structures by Number of Rooms in Walla Walla East
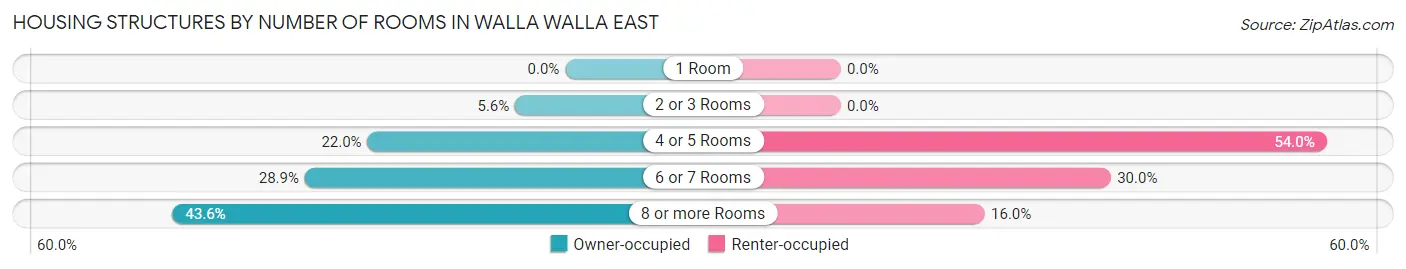
| Number of Rooms | Owner-occupied | Renter-occupied |
| 1 Room | 0 (0.0%) | 0 (0.0%) |
| 2 or 3 Rooms | 36 (5.6%) | 0 (0.0%) |
| 4 or 5 Rooms | 142 (22.0%) | 54 (54.0%) |
| 6 or 7 Rooms | 187 (28.9%) | 30 (30.0%) |
| 8 or more Rooms | 282 (43.6%) | 16 (16.0%) |
| Total | 647 (100.0%) | 100 (100.0%) |
Housing Structure by Heating Type in Walla Walla East
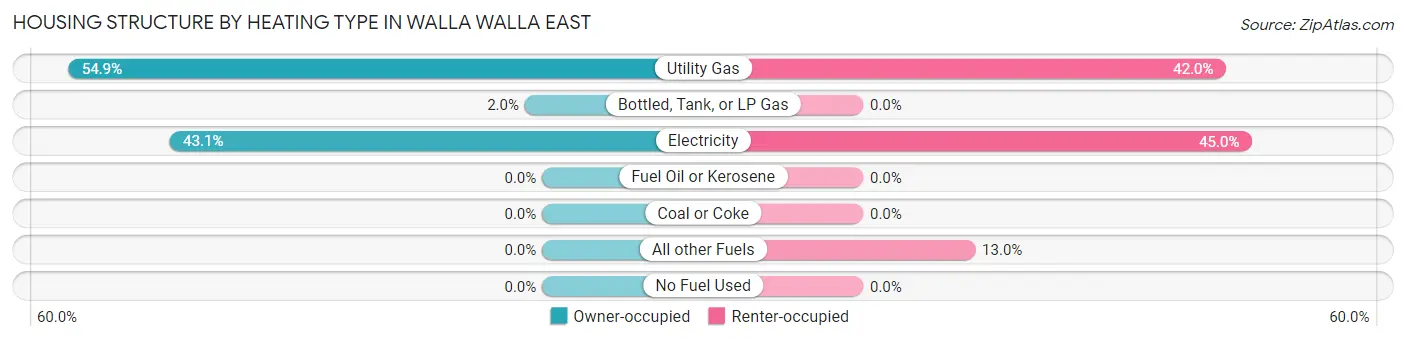
| Heating Type | Owner-occupied | Renter-occupied |
| Utility Gas | 355 (54.9%) | 42 (42.0%) |
| Bottled, Tank, or LP Gas | 13 (2.0%) | 0 (0.0%) |
| Electricity | 279 (43.1%) | 45 (45.0%) |
| Fuel Oil or Kerosene | 0 (0.0%) | 0 (0.0%) |
| Coal or Coke | 0 (0.0%) | 0 (0.0%) |
| All other Fuels | 0 (0.0%) | 13 (13.0%) |
| No Fuel Used | 0 (0.0%) | 0 (0.0%) |
| Total | 647 (100.0%) | 100 (100.0%) |
Household Vehicle Usage in Walla Walla East
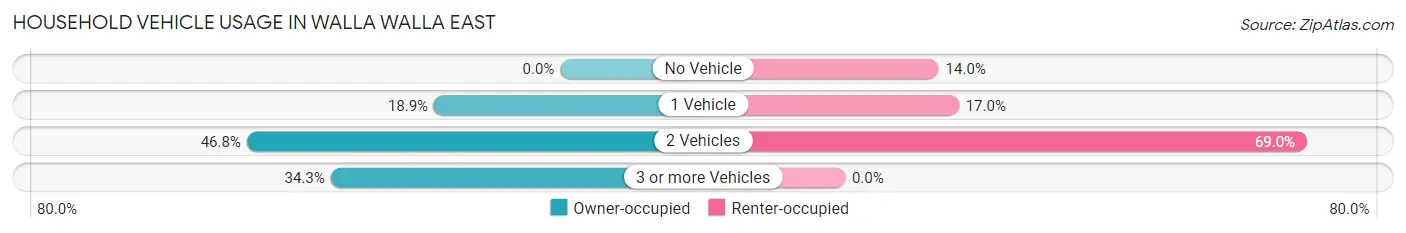
| Vehicles per Household | Owner-occupied | Renter-occupied |
| No Vehicle | 0 (0.0%) | 14 (14.0%) |
| 1 Vehicle | 122 (18.9%) | 17 (17.0%) |
| 2 Vehicles | 303 (46.8%) | 69 (69.0%) |
| 3 or more Vehicles | 222 (34.3%) | 0 (0.0%) |
| Total | 647 (100.0%) | 100 (100.0%) |
Real Estate & Mortgages in Walla Walla East
Real Estate and Mortgage Overview in Walla Walla East
| Characteristic | Without Mortgage | With Mortgage |
| Housing Units | 308 | 339 |
| Median Property Value | $480,800 | $464,800 |
| Median Household Income | $67,841 | $45 |
| Monthly Housing Costs | $545 | $0 |
| Real Estate Taxes | $2,729 | $0 |
Property Value by Mortgage Status in Walla Walla East
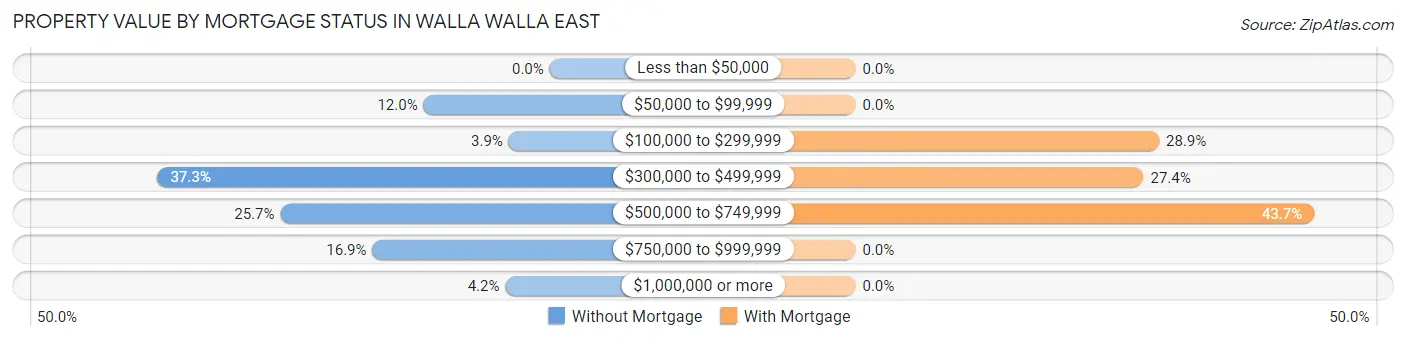
| Property Value | Without Mortgage | With Mortgage |
| Less than $50,000 | 0 (0.0%) | 0 (0.0%) |
| $50,000 to $99,999 | 37 (12.0%) | 0 (0.0%) |
| $100,000 to $299,999 | 12 (3.9%) | 98 (28.9%) |
| $300,000 to $499,999 | 115 (37.3%) | 93 (27.4%) |
| $500,000 to $749,999 | 79 (25.7%) | 148 (43.7%) |
| $750,000 to $999,999 | 52 (16.9%) | 0 (0.0%) |
| $1,000,000 or more | 13 (4.2%) | 0 (0.0%) |
| Total | 308 (100.0%) | 339 (100.0%) |
Household Income by Mortgage Status in Walla Walla East
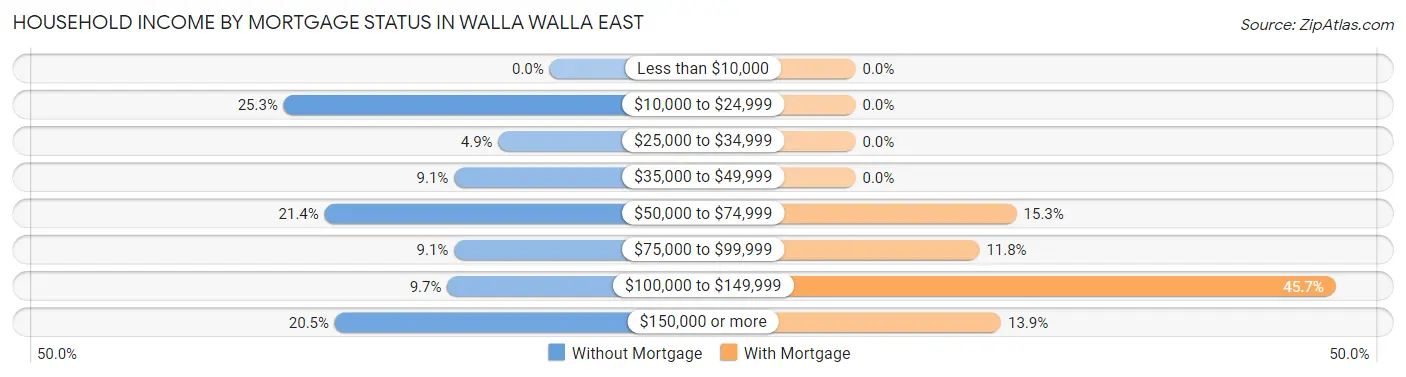
| Household Income | Without Mortgage | With Mortgage |
| Less than $10,000 | 0 (0.0%) | 0 (0.0%) |
| $10,000 to $24,999 | 78 (25.3%) | 0 (0.0%) |
| $25,000 to $34,999 | 15 (4.9%) | 0 (0.0%) |
| $35,000 to $49,999 | 28 (9.1%) | 0 (0.0%) |
| $50,000 to $74,999 | 66 (21.4%) | 52 (15.3%) |
| $75,000 to $99,999 | 28 (9.1%) | 40 (11.8%) |
| $100,000 to $149,999 | 30 (9.7%) | 155 (45.7%) |
| $150,000 or more | 63 (20.4%) | 47 (13.9%) |
| Total | 308 (100.0%) | 339 (100.0%) |
Property Value to Household Income Ratio in Walla Walla East
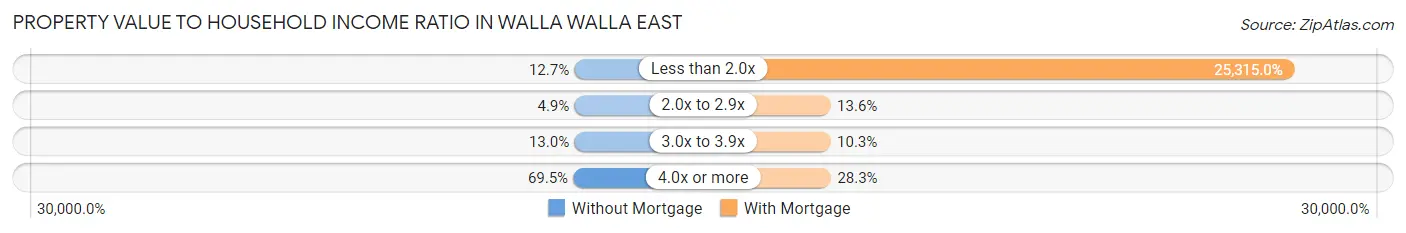
| Value-to-Income Ratio | Without Mortgage | With Mortgage |
| Less than 2.0x | 39 (12.7%) | 85,818 (25,315.0%) |
| 2.0x to 2.9x | 15 (4.9%) | 46 (13.6%) |
| 3.0x to 3.9x | 40 (13.0%) | 35 (10.3%) |
| 4.0x or more | 214 (69.5%) | 96 (28.3%) |
| Total | 308 (100.0%) | 339 (100.0%) |
Real Estate Taxes by Mortgage Status in Walla Walla East
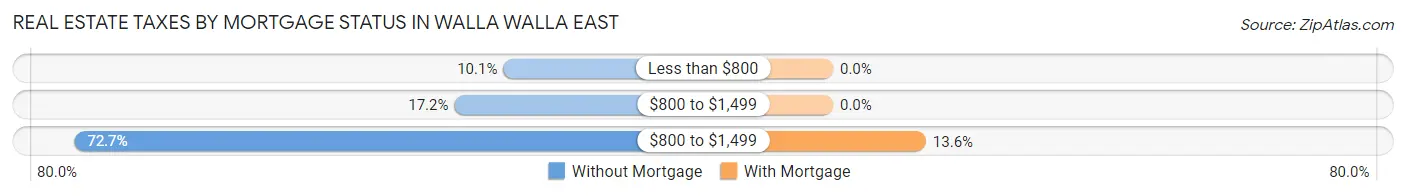
| Property Taxes | Without Mortgage | With Mortgage |
| Less than $800 | 31 (10.1%) | 0 (0.0%) |
| $800 to $1,499 | 53 (17.2%) | 0 (0.0%) |
| $800 to $1,499 | 224 (72.7%) | 46 (13.6%) |
| Total | 308 (100.0%) | 339 (100.0%) |
Health & Disability in Walla Walla East
Health Insurance Coverage by Age in Walla Walla East
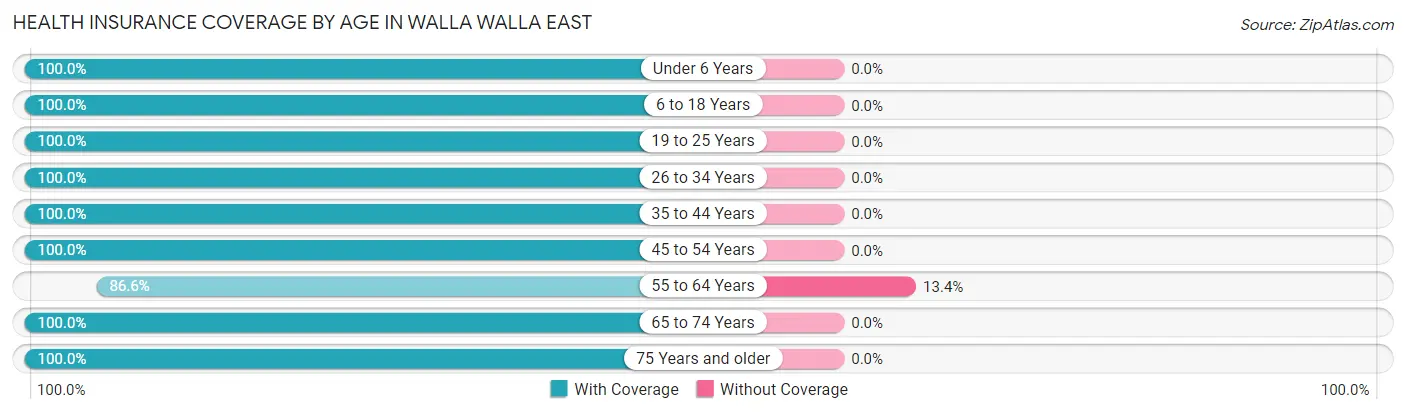
| Age Bracket | With Coverage | Without Coverage |
| Under 6 Years | 192 (100.0%) | 0 (0.0%) |
| 6 to 18 Years | 283 (100.0%) | 0 (0.0%) |
| 19 to 25 Years | 91 (100.0%) | 0 (0.0%) |
| 26 to 34 Years | 43 (100.0%) | 0 (0.0%) |
| 35 to 44 Years | 284 (100.0%) | 0 (0.0%) |
| 45 to 54 Years | 112 (100.0%) | 0 (0.0%) |
| 55 to 64 Years | 278 (86.6%) | 43 (13.4%) |
| 65 to 74 Years | 242 (100.0%) | 0 (0.0%) |
| 75 Years and older | 242 (100.0%) | 0 (0.0%) |
| Total | 1,767 (97.6%) | 43 (2.4%) |
Health Insurance Coverage by Citizenship Status in Walla Walla East
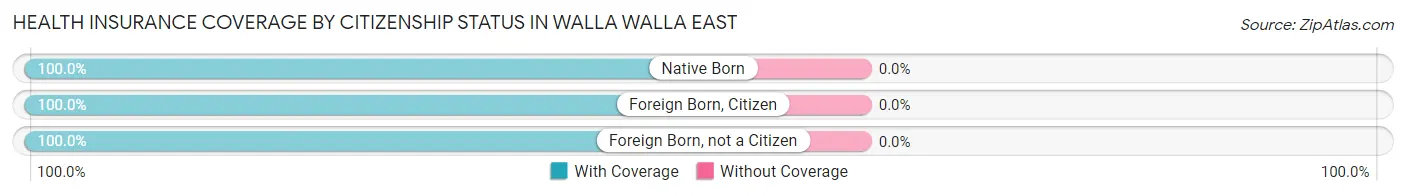
| Citizenship Status | With Coverage | Without Coverage |
| Native Born | 192 (100.0%) | 0 (0.0%) |
| Foreign Born, Citizen | 283 (100.0%) | 0 (0.0%) |
| Foreign Born, not a Citizen | 91 (100.0%) | 0 (0.0%) |
Health Insurance Coverage by Household Income in Walla Walla East
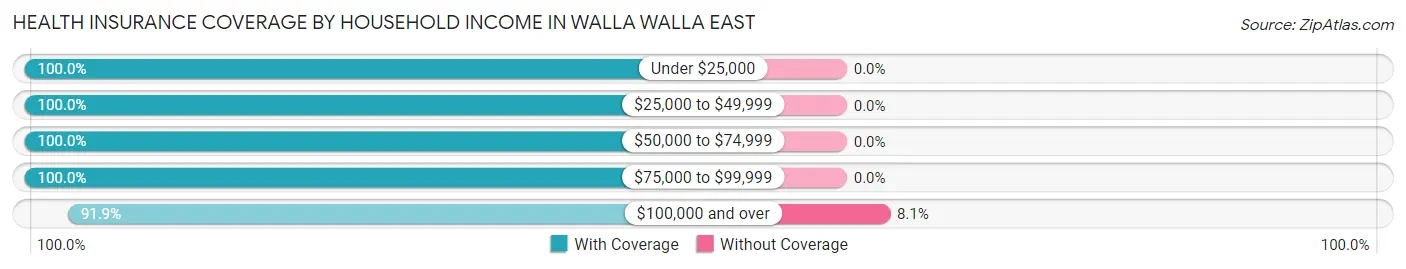
| Household Income | With Coverage | Without Coverage |
| Under $25,000 | 78 (100.0%) | 0 (0.0%) |
| $25,000 to $49,999 | 246 (100.0%) | 0 (0.0%) |
| $50,000 to $74,999 | 208 (100.0%) | 0 (0.0%) |
| $75,000 to $99,999 | 748 (100.0%) | 0 (0.0%) |
| $100,000 and over | 487 (91.9%) | 43 (8.1%) |
Public vs Private Health Insurance Coverage by Age in Walla Walla East
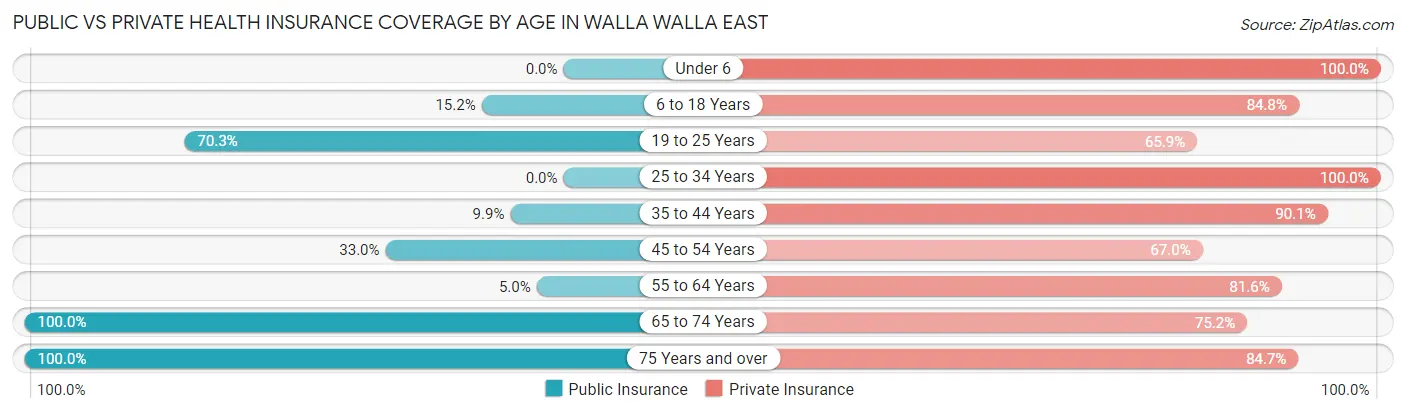
| Age Bracket | Public Insurance | Private Insurance |
| Under 6 | 0 (0.0%) | 192 (100.0%) |
| 6 to 18 Years | 43 (15.2%) | 240 (84.8%) |
| 19 to 25 Years | 64 (70.3%) | 60 (65.9%) |
| 25 to 34 Years | 0 (0.0%) | 43 (100.0%) |
| 35 to 44 Years | 28 (9.9%) | 256 (90.1%) |
| 45 to 54 Years | 37 (33.0%) | 75 (67.0%) |
| 55 to 64 Years | 16 (5.0%) | 262 (81.6%) |
| 65 to 74 Years | 242 (100.0%) | 182 (75.2%) |
| 75 Years and over | 242 (100.0%) | 205 (84.7%) |
| Total | 672 (37.1%) | 1,515 (83.7%) |
Disability Status by Sex by Age in Walla Walla East
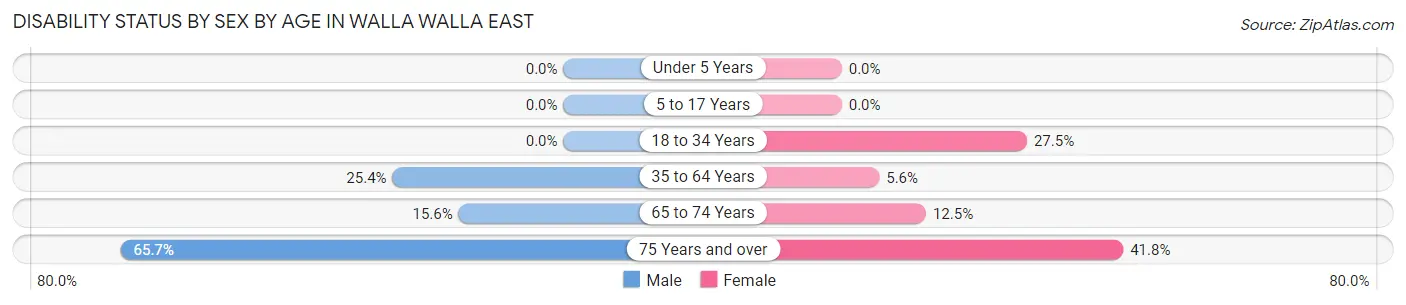
| Age Bracket | Male | Female |
| Under 5 Years | 0 (0.0%) | 0 (0.0%) |
| 5 to 17 Years | 0 (0.0%) | 0 (0.0%) |
| 18 to 34 Years | 0 (0.0%) | 33 (27.5%) |
| 35 to 64 Years | 100 (25.4%) | 18 (5.6%) |
| 65 to 74 Years | 14 (15.6%) | 19 (12.5%) |
| 75 Years and over | 71 (65.7%) | 56 (41.8%) |
Disability Class by Sex by Age in Walla Walla East
Disability Class: Hearing Difficulty
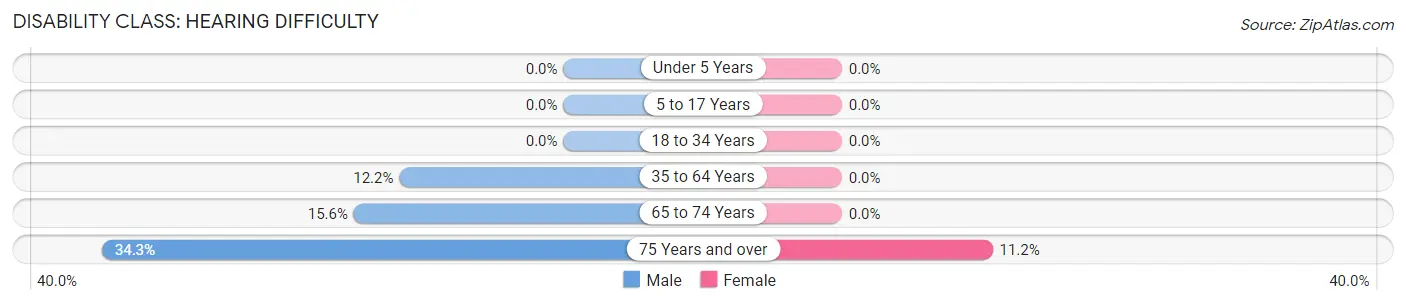
| Age Bracket | Male | Female |
| Under 5 Years | 0 (0.0%) | 0 (0.0%) |
| 5 to 17 Years | 0 (0.0%) | 0 (0.0%) |
| 18 to 34 Years | 0 (0.0%) | 0 (0.0%) |
| 35 to 64 Years | 48 (12.2%) | 0 (0.0%) |
| 65 to 74 Years | 14 (15.6%) | 0 (0.0%) |
| 75 Years and over | 37 (34.3%) | 15 (11.2%) |
Disability Class: Vision Difficulty
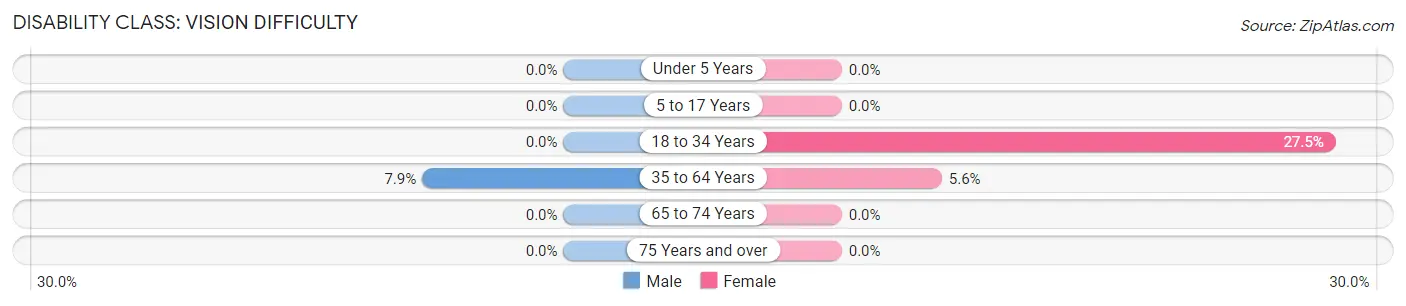
| Age Bracket | Male | Female |
| Under 5 Years | 0 (0.0%) | 0 (0.0%) |
| 5 to 17 Years | 0 (0.0%) | 0 (0.0%) |
| 18 to 34 Years | 0 (0.0%) | 33 (27.5%) |
| 35 to 64 Years | 31 (7.9%) | 18 (5.6%) |
| 65 to 74 Years | 0 (0.0%) | 0 (0.0%) |
| 75 Years and over | 0 (0.0%) | 0 (0.0%) |
Disability Class: Cognitive Difficulty
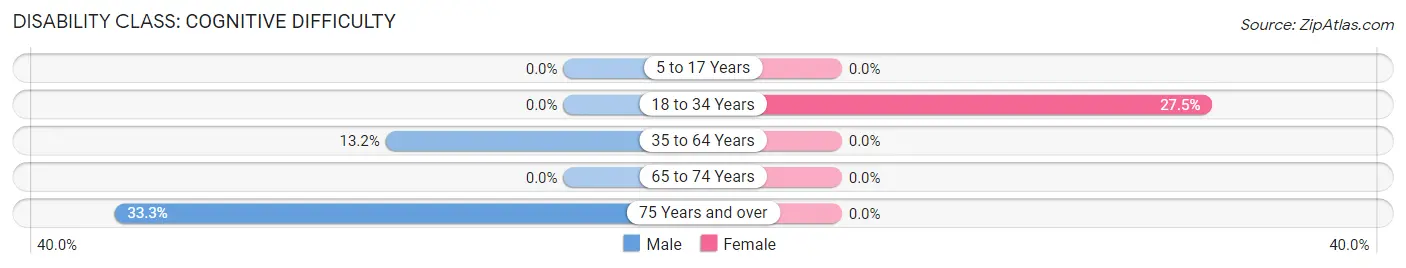
| Age Bracket | Male | Female |
| 5 to 17 Years | 0 (0.0%) | 0 (0.0%) |
| 18 to 34 Years | 0 (0.0%) | 33 (27.5%) |
| 35 to 64 Years | 52 (13.2%) | 0 (0.0%) |
| 65 to 74 Years | 0 (0.0%) | 0 (0.0%) |
| 75 Years and over | 36 (33.3%) | 0 (0.0%) |
Disability Class: Ambulatory Difficulty
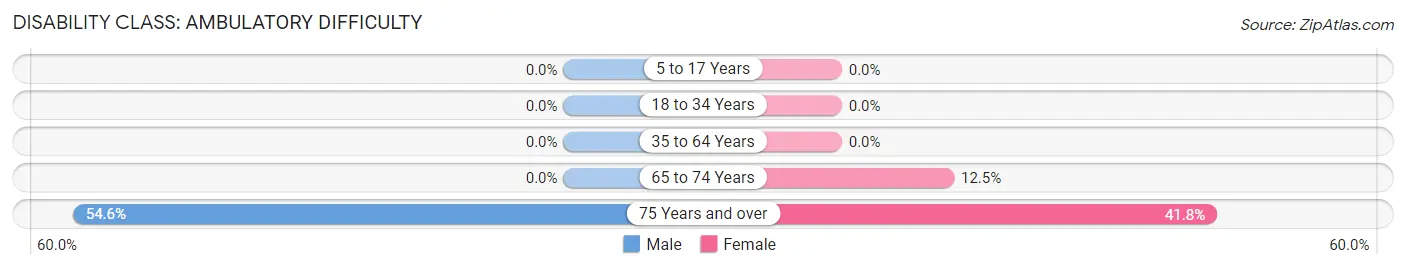
| Age Bracket | Male | Female |
| 5 to 17 Years | 0 (0.0%) | 0 (0.0%) |
| 18 to 34 Years | 0 (0.0%) | 0 (0.0%) |
| 35 to 64 Years | 0 (0.0%) | 0 (0.0%) |
| 65 to 74 Years | 0 (0.0%) | 19 (12.5%) |
| 75 Years and over | 59 (54.6%) | 56 (41.8%) |
Disability Class: Self-Care Difficulty
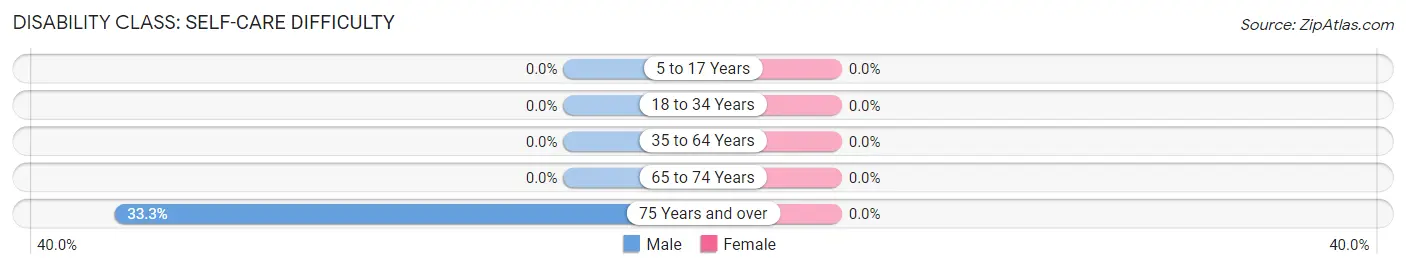
| Age Bracket | Male | Female |
| 5 to 17 Years | 0 (0.0%) | 0 (0.0%) |
| 18 to 34 Years | 0 (0.0%) | 0 (0.0%) |
| 35 to 64 Years | 0 (0.0%) | 0 (0.0%) |
| 65 to 74 Years | 0 (0.0%) | 0 (0.0%) |
| 75 Years and over | 36 (33.3%) | 0 (0.0%) |
Technology Access in Walla Walla East
Computing Device Access in Walla Walla East
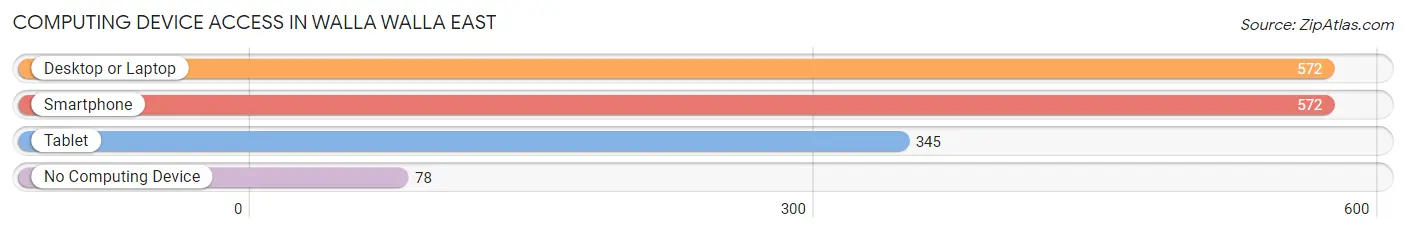
| Device Type | # Households | % Households |
| Desktop or Laptop | 572 | 76.6% |
| Smartphone | 572 | 76.6% |
| Tablet | 345 | 46.2% |
| No Computing Device | 78 | 10.4% |
| Total | 747 | 100.0% |
Internet Access in Walla Walla East

| Internet Type | # Households | % Households |
| Dial-Up Internet | 0 | 0.0% |
| Broadband Home | 590 | 79.0% |
| Cellular Data Only | 57 | 7.6% |
| Satellite Internet | 16 | 2.1% |
| No Internet | 100 | 13.4% |
| Total | 747 | 100.0% |
Walla Walla East Summary
Walla Walla East is a small unincorporated community located in Walla Walla County, Washington, United States. It is located approximately 8 miles east of the city of Walla Walla. The population of Walla Walla East was estimated to be around 1,000 in 2020.
History
Walla Walla East was first settled in the late 1800s by settlers from the east coast of the United States. The area was originally known as "East Walla Walla" and was part of the larger Walla Walla Valley. The area was primarily used for farming and ranching, and the first post office was established in 1891.
In the early 1900s, the area began to develop as a small community. The first school was built in 1910, and the first church was built in 1912. The community also had a general store, a blacksmith shop, and a few other businesses.
In the 1920s, the area began to experience a population boom as more people moved to the area. The population of Walla Walla East peaked in the 1940s, when it had a population of around 1,500.
Geography
Walla Walla East is located in the southeastern corner of Walla Walla County, Washington. It is situated in the foothills of the Blue Mountains, and is surrounded by rolling hills and farmland. The area is known for its mild climate and fertile soil, which makes it ideal for farming and ranching.
The area is also home to several small lakes, including Lake Walla Walla, which is a popular spot for fishing and boating. The nearby Walla Walla River is also a popular spot for fishing and rafting.
Economy
The economy of Walla Walla East is primarily based on agriculture and ranching. The area is known for its production of wheat, barley, and other grains. The area is also home to several wineries, which produce some of the finest wines in the region.
In addition to agriculture, Walla Walla East is home to several small businesses, including restaurants, shops, and other services. The area is also home to several small manufacturing companies, which produce a variety of products, including furniture, clothing, and electronics.
Demographics
The population of Walla Walla East was estimated to be around 1,000 in 2020. The population is primarily white (90%), with a small percentage of Hispanic (4%) and Asian (2%) residents. The median household income in the area is around $50,000, and the median home value is around $200,000.
Conclusion
Walla Walla East is a small unincorporated community located in Walla Walla County, Washington. It is known for its mild climate and fertile soil, which makes it ideal for farming and ranching. The population of Walla Walla East was estimated to be around 1,000 in 2020, and the area is primarily white. The economy of Walla Walla East is primarily based on agriculture and ranching, and the area is also home to several small businesses.
Common Questions
What is Per Capita Income in Walla Walla East?
Per Capita income in Walla Walla East is $41,499.
What is the Median Family Income in Walla Walla East?
Median Family Income in Walla Walla East is $86,525.
What is the Median Household income in Walla Walla East?
Median Household Income in Walla Walla East is $79,336.
What is Income or Wage Gap in Walla Walla East?
Income or Wage Gap in Walla Walla East is 67.0%.
Women in Walla Walla East earn 33.0 cents for every dollar earned by a man.
What is Inequality or Gini Index in Walla Walla East?
Inequality or Gini Index in Walla Walla East is 0.42.
What is the Total Population of Walla Walla East?
Total Population of Walla Walla East is 1,826.
What is the Total Male Population of Walla Walla East?
Total Male Population of Walla Walla East is 724.
What is the Total Female Population of Walla Walla East?
Total Female Population of Walla Walla East is 1,102.
What is the Ratio of Males per 100 Females in Walla Walla East?
There are 65.70 Males per 100 Females in Walla Walla East.
What is the Ratio of Females per 100 Males in Walla Walla East?
There are 152.21 Females per 100 Males in Walla Walla East.
What is the Median Population Age in Walla Walla East?
Median Population Age in Walla Walla East is 46.1 Years.
What is the Average Family Size in Walla Walla East
Average Family Size in Walla Walla East is 3.0 People.
What is the Average Household Size in Walla Walla East
Average Household Size in Walla Walla East is 2.4 People.
How Large is the Labor Force in Walla Walla East?
There are 635 People in the Labor Forcein in Walla Walla East.
What is the Percentage of People in the Labor Force in Walla Walla East?
43.8% of People are in the Labor Force in Walla Walla East.