Cities with the Highest Percentage of Indian (Asian) Population in Michigan
RELATED REPORTS & OPTIONS
Indian (Asian)
Michigan
Compare Cities
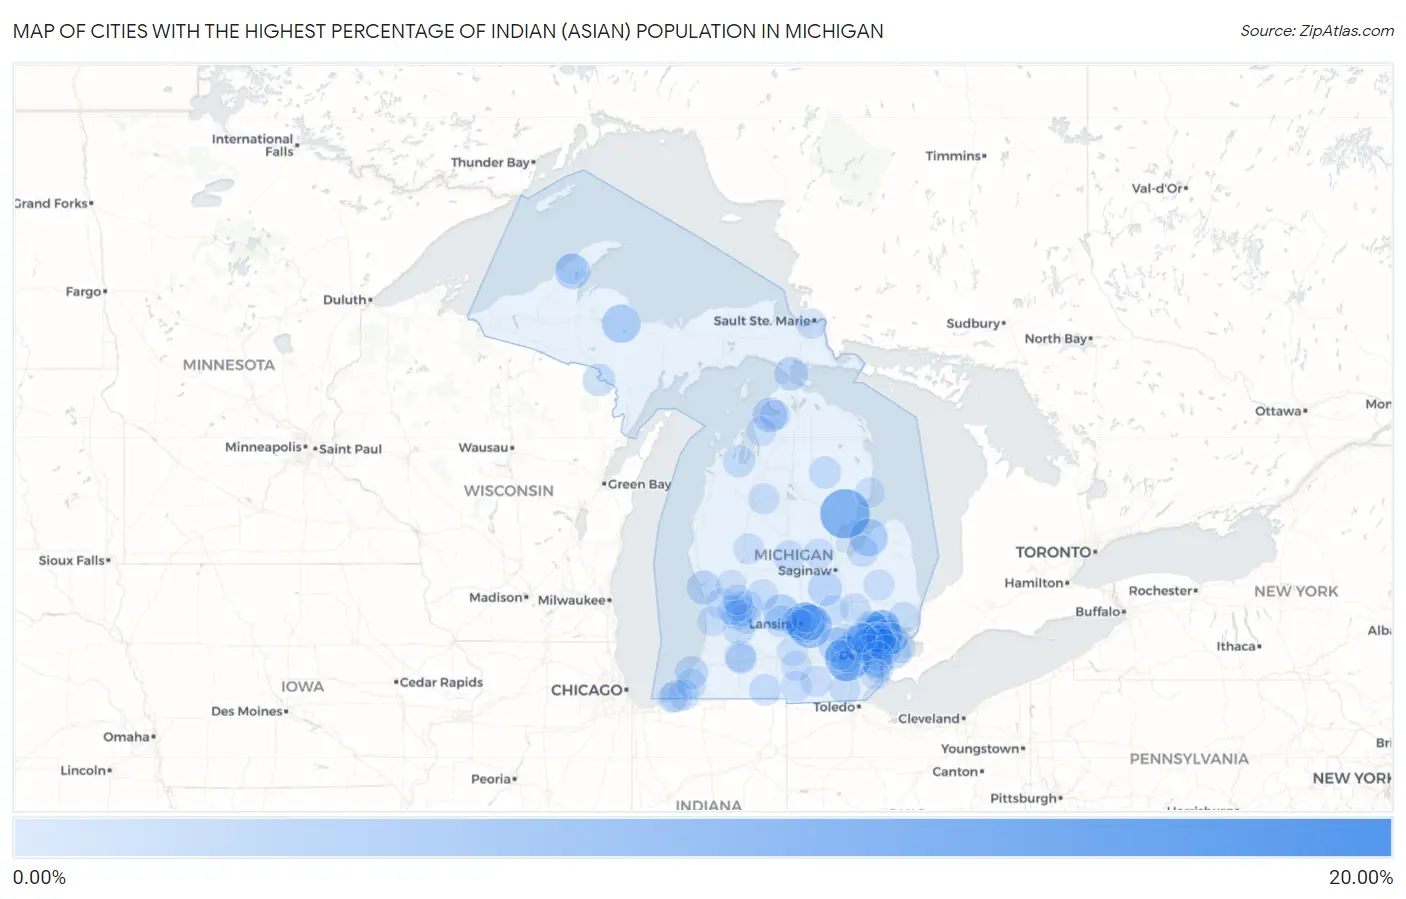
Map of Cities with the Highest Percentage of Indian (Asian) Population in Michigan
0.00%
20.00%
Cities with the Highest Percentage of Indian (Asian) Population in Michigan
| City | Indian (Asian) | vs State | vs National | |
| 1. | Cannonsburg | 16.84% | 0.68%(+16.2)#1 | 1.61%(+15.2)#112 |
| 2. | Turner | 9.46% | 0.68%(+8.78)#2 | 1.61%(+7.85)#324 |
| 3. | Ann Arbor | 7.26% | 0.68%(+6.58)#3 | 1.61%(+5.65)#459 |
| 4. | Okemos | 6.61% | 0.68%(+5.93)#4 | 1.61%(+5.00)#514 |
| 5. | East Lansing | 5.18% | 0.68%(+4.50)#5 | 1.61%(+3.57)#715 |
| 6. | Troy | 4.99% | 0.68%(+4.31)#6 | 1.61%(+3.38)#754 |
| 7. | Novi | 4.64% | 0.68%(+3.96)#7 | 1.61%(+3.04)#821 |
| 8. | West Ishpeming | 4.20% | 0.68%(+3.52)#8 | 1.61%(+2.59)#918 |
| 9. | Bay Port | 4.06% | 0.68%(+3.38)#9 | 1.61%(+2.45)#943 |
| 10. | Bloomfield Hills | 3.70% | 0.68%(+3.02)#10 | 1.61%(+2.09)#1,045 |
| 11. | Rochester Hills | 3.45% | 0.68%(+2.77)#11 | 1.61%(+1.84)#1,127 |
| 12. | Portland | 3.43% | 0.68%(+2.75)#12 | 1.61%(+1.82)#1,133 |
| 13. | Madison Heights | 3.14% | 0.68%(+2.46)#13 | 1.61%(+1.53)#1,233 |
| 14. | Haslett | 3.02% | 0.68%(+2.34)#14 | 1.61%(+1.41)#1,285 |
| 15. | Rochester | 3.02% | 0.68%(+2.34)#15 | 1.61%(+1.41)#1,287 |
| 16. | Houghton | 3.01% | 0.68%(+2.33)#16 | 1.61%(+1.40)#1,294 |
| 17. | Pinckney | 2.87% | 0.68%(+2.19)#17 | 1.61%(+1.26)#1,350 |
| 18. | Grosse Pointe Park | 2.81% | 0.68%(+2.13)#18 | 1.61%(+1.21)#1,375 |
| 19. | Bay Shore | 2.63% | 0.68%(+1.95)#19 | 1.61%(+1.02)#1,488 |
| 20. | Chesaning | 2.45% | 0.68%(+1.77)#20 | 1.61%(+0.840)#1,608 |
| 21. | Franklin | 2.37% | 0.68%(+1.69)#21 | 1.61%(+0.766)#1,666 |
| 22. | Roosevelt Park | 2.32% | 0.68%(+1.64)#22 | 1.61%(+0.711)#1,708 |
| 23. | Beverly Hills | 2.27% | 0.68%(+1.59)#23 | 1.61%(+0.657)#1,747 |
| 24. | St Ignace | 2.19% | 0.68%(+1.51)#24 | 1.61%(+0.586)#1,791 |
| 25. | Northville | 1.99% | 0.68%(+1.31)#25 | 1.61%(+0.379)#1,959 |
| 26. | St Joseph | 1.96% | 0.68%(+1.28)#26 | 1.61%(+0.353)#1,986 |
| 27. | Auburn Hills | 1.83% | 0.68%(+1.15)#27 | 1.61%(+0.221)#2,119 |
| 28. | Allen Park | 1.81% | 0.68%(+1.13)#28 | 1.61%(+0.201)#2,139 |
| 29. | Kingsford | 1.64% | 0.68%(+0.958)#29 | 1.61%(+0.030)#2,361 |
| 30. | Barton Hills | 1.58% | 0.68%(+0.897)#30 | 1.61%(-0.032)#2,426 |
| 31. | Mulliken | 1.52% | 0.68%(+0.844)#31 | 1.61%(-0.085)#2,495 |
| 32. | Mio | 1.47% | 0.68%(+0.793)#32 | 1.61%(-0.136)#2,579 |
| 33. | Greilickville | 1.43% | 0.68%(+0.751)#33 | 1.61%(-0.177)#2,648 |
| 34. | New Buffalo | 1.40% | 0.68%(+0.715)#34 | 1.61%(-0.214)#2,713 |
| 35. | Lake Angelus | 1.39% | 0.68%(+0.714)#35 | 1.61%(-0.215)#2,715 |
| 36. | Ypsilanti | 1.30% | 0.68%(+0.622)#36 | 1.61%(-0.307)#2,843 |
| 37. | Wayland | 1.29% | 0.68%(+0.612)#37 | 1.61%(-0.317)#2,858 |
| 38. | Berkley | 1.27% | 0.68%(+0.594)#38 | 1.61%(-0.335)#2,887 |
| 39. | Mount Pleasant | 1.27% | 0.68%(+0.594)#39 | 1.61%(-0.335)#2,888 |
| 40. | Bronson | 1.26% | 0.68%(+0.575)#40 | 1.61%(-0.354)#2,934 |
| 41. | Westwood | 1.20% | 0.68%(+0.517)#41 | 1.61%(-0.412)#3,054 |
| 42. | Village Of Grosse Pointe Shores | 1.19% | 0.68%(+0.508)#42 | 1.61%(-0.421)#3,072 |
| 43. | Unionville | 1.18% | 0.68%(+0.496)#43 | 1.61%(-0.432)#3,088 |
| 44. | Bingham Farms | 1.17% | 0.68%(+0.491)#44 | 1.61%(-0.438)#3,101 |
| 45. | Farmington | 1.15% | 0.68%(+0.469)#45 | 1.61%(-0.460)#3,144 |
| 46. | Sterling Heights | 1.13% | 0.68%(+0.446)#46 | 1.61%(-0.483)#3,192 |
| 47. | Hazel Park | 1.12% | 0.68%(+0.435)#47 | 1.61%(-0.494)#3,220 |
| 48. | Richmond | 1.11% | 0.68%(+0.431)#48 | 1.61%(-0.498)#3,232 |
| 49. | Belding | 1.09% | 0.68%(+0.414)#49 | 1.61%(-0.515)#3,272 |
| 50. | Deerfield | 1.09% | 0.68%(+0.410)#50 | 1.61%(-0.518)#3,280 |
| 51. | Royal Oak | 1.09% | 0.68%(+0.409)#51 | 1.61%(-0.520)#3,284 |
| 52. | Fraser | 1.06% | 0.68%(+0.377)#52 | 1.61%(-0.552)#3,354 |
| 53. | Forest Hills | 1.05% | 0.68%(+0.372)#53 | 1.61%(-0.557)#3,366 |
| 54. | Lake City | 1.00% | 0.68%(+0.317)#54 | 1.61%(-0.612)#3,514 |
| 55. | Three Oaks | 0.99% | 0.68%(+0.314)#55 | 1.61%(-0.615)#3,525 |
| 56. | Crystal | 0.99% | 0.68%(+0.310)#56 | 1.61%(-0.619)#3,539 |
| 57. | Allendale | 0.98% | 0.68%(+0.304)#57 | 1.61%(-0.625)#3,555 |
| 58. | Manitou Beach Devils Lake | 0.94% | 0.68%(+0.261)#58 | 1.61%(-0.668)#3,672 |
| 59. | Hillsdale | 0.91% | 0.68%(+0.232)#59 | 1.61%(-0.697)#3,762 |
| 60. | Kentwood | 0.90% | 0.68%(+0.223)#60 | 1.61%(-0.706)#3,796 |
| 61. | North Branch | 0.90% | 0.68%(+0.221)#61 | 1.61%(-0.708)#3,804 |
| 62. | Farmington Hills | 0.89% | 0.68%(+0.214)#62 | 1.61%(-0.715)#3,818 |
| 63. | Waverly | 0.89% | 0.68%(+0.209)#63 | 1.61%(-0.719)#3,831 |
| 64. | Pleasant Ridge | 0.88% | 0.68%(+0.202)#64 | 1.61%(-0.727)#3,861 |
| 65. | Big Rapids | 0.87% | 0.68%(+0.192)#65 | 1.61%(-0.737)#3,892 |
| 66. | Kalamazoo | 0.86% | 0.68%(+0.178)#66 | 1.61%(-0.751)#3,938 |
| 67. | Walled Lake | 0.84% | 0.68%(+0.160)#67 | 1.61%(-0.769)#3,991 |
| 68. | Lansing | 0.82% | 0.68%(+0.141)#68 | 1.61%(-0.787)#4,066 |
| 69. | Cutlerville | 0.81% | 0.68%(+0.134)#69 | 1.61%(-0.794)#4,085 |
| 70. | Sault Ste Marie | 0.79% | 0.68%(+0.110)#70 | 1.61%(-0.818)#4,155 |
| 71. | Grand Blanc | 0.78% | 0.68%(+0.104)#71 | 1.61%(-0.825)#4,176 |
| 72. | Caledonia | 0.77% | 0.68%(+0.094)#72 | 1.61%(-0.834)#4,214 |
| 73. | Riverview | 0.74% | 0.68%(+0.062)#73 | 1.61%(-0.866)#4,309 |
| 74. | Midland | 0.72% | 0.68%(+0.042)#74 | 1.61%(-0.887)#4,385 |
| 75. | Brighton | 0.72% | 0.68%(+0.041)#75 | 1.61%(-0.887)#4,386 |
| 76. | Birmingham | 0.72% | 0.68%(+0.038)#76 | 1.61%(-0.891)#4,398 |
| 77. | Clawson | 0.71% | 0.68%(+0.031)#77 | 1.61%(-0.897)#4,418 |
| 78. | Michiana | 0.70% | 0.68%(+0.022)#78 | 1.61%(-0.907)#4,456 |
| 79. | Southgate | 0.69% | 0.68%(+0.011)#79 | 1.61%(-0.918)#4,491 |
| 80. | Saline | 0.69% | 0.68%(+0.011)#80 | 1.61%(-0.918)#4,492 |
| 81. | Petoskey | 0.68% | 0.68%(+0.003)#81 | 1.61%(-0.926)#4,518 |
| 82. | Livonia | 0.68% | 0.68%(-0.005)#82 | 1.61%(-0.934)#4,546 |
| 83. | Baroda | 0.67% | 0.68%(-0.010)#83 | 1.61%(-0.939)#4,572 |
| 84. | Holland | 0.66% | 0.68%(-0.016)#84 | 1.61%(-0.945)#4,595 |
| 85. | Hancock | 0.66% | 0.68%(-0.017)#85 | 1.61%(-0.946)#4,600 |
| 86. | Grand Rapids | 0.62% | 0.68%(-0.060)#86 | 1.61%(-0.989)#4,784 |
| 87. | Hamtramck | 0.61% | 0.68%(-0.073)#87 | 1.61%(-1.00)#4,829 |
| 88. | Ellsworth | 0.60% | 0.68%(-0.078)#88 | 1.61%(-1.01)#4,854 |
| 89. | Concord | 0.59% | 0.68%(-0.085)#89 | 1.61%(-1.01)#4,893 |
| 90. | Dexter | 0.58% | 0.68%(-0.103)#90 | 1.61%(-1.03)#4,974 |
| 91. | Dearborn | 0.58% | 0.68%(-0.104)#91 | 1.61%(-1.03)#4,976 |
| 92. | Grandville | 0.57% | 0.68%(-0.106)#92 | 1.61%(-1.03)#4,989 |
| 93. | Comstock Park | 0.57% | 0.68%(-0.112)#93 | 1.61%(-1.04)#5,020 |
| 94. | Casnovia | 0.55% | 0.68%(-0.126)#94 | 1.61%(-1.05)#5,103 |
| 95. | Durand | 0.54% | 0.68%(-0.136)#95 | 1.61%(-1.07)#5,155 |
| 96. | Springport | 0.54% | 0.68%(-0.137)#96 | 1.61%(-1.07)#5,160 |
| 97. | Bath | 0.54% | 0.68%(-0.137)#97 | 1.61%(-1.07)#5,163 |
| 98. | South Rockwood | 0.54% | 0.68%(-0.139)#98 | 1.61%(-1.07)#5,170 |
| 99. | Au Sable | 0.54% | 0.68%(-0.140)#99 | 1.61%(-1.07)#5,182 |
| 100. | Wolverine Lake | 0.53% | 0.68%(-0.146)#100 | 1.61%(-1.07)#5,208 |
Common Questions
What are the Top 10 Cities with the Highest Percentage of Indian (Asian) Population in Michigan?
Top 10 Cities with the Highest Percentage of Indian (Asian) Population in Michigan are:
#1
9.46%
#2
7.26%
#3
6.61%
#4
5.18%
#5
4.99%
#6
4.64%
#7
4.20%
#8
4.06%
#9
3.70%
#10
3.45%
What city has the Highest Percentage of Indian (Asian) Population in Michigan?
Turner has the Highest Percentage of Indian (Asian) Population in Michigan with 9.46%.
What is the Percentage of Indian (Asian) Population in the State of Michigan?
Percentage of Indian (Asian) Population in Michigan is 0.68%.
What is the Percentage of Indian (Asian) Population in the United States?
Percentage of Indian (Asian) Population in the United States is 1.61%.