Cities with the Highest Percentage of Indian (Asian) Population in Connecticut
RELATED REPORTS & OPTIONS
Indian (Asian)
Connecticut
Compare Cities
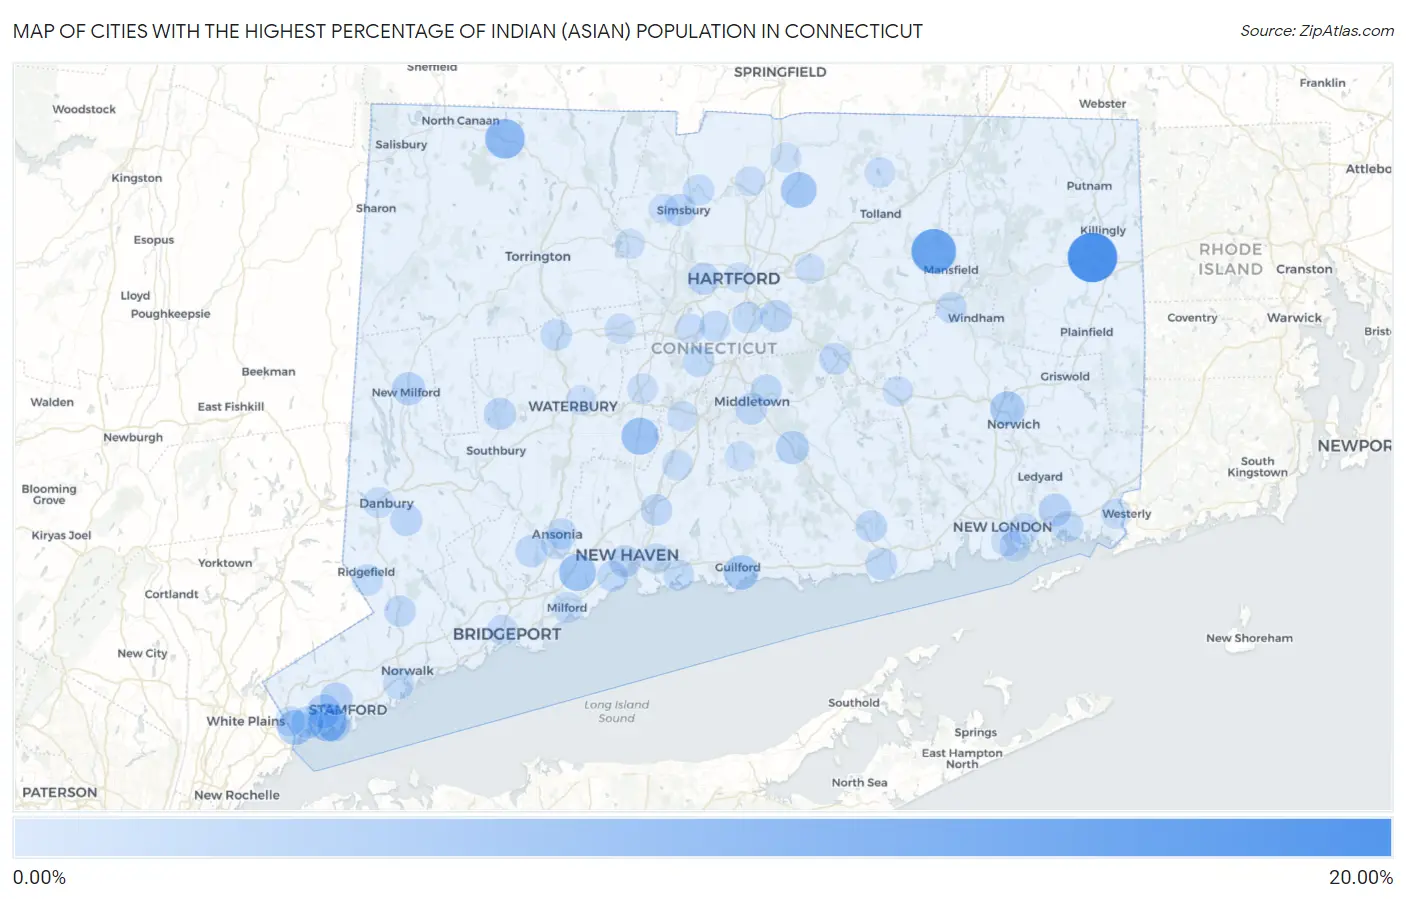
Map of Cities with the Highest Percentage of Indian (Asian) Population in Connecticut
0.00%
20.00%
Cities with the Highest Percentage of Indian (Asian) Population in Connecticut
| City | Indian (Asian) | vs State | vs National | |
| 1. | East Brooklyn | 15.11% | 1.34%(+13.8)#1 | 1.61%(+13.5)#151 |
| 2. | Storrs | 11.33% | 1.34%(+9.98)#2 | 1.61%(+9.72)#243 |
| 3. | Westport | 8.28% | 1.34%(+6.94)#3 | 1.61%(+6.67)#395 |
| 4. | Redding Center | 8.14% | 1.34%(+6.80)#4 | 1.61%(+6.53)#402 |
| 5. | Noroton | 7.71% | 1.34%(+6.36)#5 | 1.61%(+6.10)#428 |
| 6. | Brookfield Center | 7.65% | 1.34%(+6.30)#6 | 1.61%(+6.04)#434 |
| 7. | Norfolk | 7.36% | 1.34%(+6.02)#7 | 1.61%(+5.75)#451 |
| 8. | Riverside | 6.16% | 1.34%(+4.81)#8 | 1.61%(+4.55)#571 |
| 9. | Trumbull Center | 5.80% | 1.34%(+4.45)#9 | 1.61%(+4.19)#626 |
| 10. | Darien Downtown | 5.78% | 1.34%(+4.43)#10 | 1.61%(+4.17)#630 |
| 11. | Cheshire Village | 5.56% | 1.34%(+4.22)#11 | 1.61%(+3.95)#650 |
| 12. | Orange | 5.40% | 1.34%(+4.05)#12 | 1.61%(+3.79)#675 |
| 13. | Ridgebury | 5.08% | 1.34%(+3.73)#13 | 1.61%(+3.47)#741 |
| 14. | Broad Brook | 4.59% | 1.34%(+3.25)#14 | 1.61%(+2.98)#838 |
| 15. | Bigelow Corners | 4.49% | 1.34%(+3.14)#15 | 1.61%(+2.88)#872 |
| 16. | Pemberwick | 4.02% | 1.34%(+2.67)#16 | 1.61%(+2.41)#959 |
| 17. | Guilford Center | 3.86% | 1.34%(+2.51)#17 | 1.61%(+2.25)#1,005 |
| 18. | Norwich | 3.78% | 1.34%(+2.44)#18 | 1.61%(+2.17)#1,023 |
| 19. | South Wilton | 3.36% | 1.34%(+2.02)#19 | 1.61%(+1.75)#1,154 |
| 20. | Murray | 3.25% | 1.34%(+1.91)#20 | 1.61%(+1.64)#1,191 |
| 21. | Sandy Hook | 3.13% | 1.34%(+1.79)#21 | 1.61%(+1.53)#1,237 |
| 22. | Cos Cob | 3.08% | 1.34%(+1.74)#22 | 1.61%(+1.47)#1,262 |
| 23. | Staples | 3.06% | 1.34%(+1.71)#23 | 1.61%(+1.45)#1,271 |
| 24. | Old Greenwich | 2.68% | 1.34%(+1.33)#24 | 1.61%(+1.07)#1,460 |
| 25. | Tashua | 2.67% | 1.34%(+1.33)#25 | 1.61%(+1.06)#1,463 |
| 26. | New Milford | 2.66% | 1.34%(+1.32)#26 | 1.61%(+1.06)#1,471 |
| 27. | Higganum | 2.66% | 1.34%(+1.31)#27 | 1.61%(+1.05)#1,474 |
| 28. | Old Mystic | 2.30% | 1.34%(+0.961)#28 | 1.61%(+0.696)#1,719 |
| 29. | Stamford | 2.24% | 1.34%(+0.896)#29 | 1.61%(+0.631)#1,764 |
| 30. | Oronoque | 2.14% | 1.34%(+0.797)#30 | 1.61%(+0.531)#1,839 |
| 31. | Noroton Heights | 2.13% | 1.34%(+0.785)#31 | 1.61%(+0.520)#1,848 |
| 32. | Greenwich | 2.11% | 1.34%(+0.763)#32 | 1.61%(+0.498)#1,868 |
| 33. | Sacred Heart University | 2.05% | 1.34%(+0.705)#33 | 1.61%(+0.440)#1,898 |
| 34. | Glastonbury Center | 2.01% | 1.34%(+0.667)#34 | 1.61%(+0.402)#1,931 |
| 35. | New Haven | 1.95% | 1.34%(+0.610)#35 | 1.61%(+0.345)#1,998 |
| 36. | Simsbury Center | 1.95% | 1.34%(+0.604)#36 | 1.61%(+0.339)#2,004 |
| 37. | West Hartford | 1.91% | 1.34%(+0.563)#37 | 1.61%(+0.298)#2,039 |
| 38. | Woodbury Center | 1.87% | 1.34%(+0.525)#38 | 1.61%(+0.260)#2,079 |
| 39. | Bethel | 1.77% | 1.34%(+0.422)#39 | 1.61%(+0.157)#2,189 |
| 40. | Old Saybrook Center | 1.74% | 1.34%(+0.392)#40 | 1.61%(+0.126)#2,234 |
| 41. | Shelton | 1.73% | 1.34%(+0.384)#41 | 1.61%(+0.119)#2,237 |
| 42. | Middletown | 1.66% | 1.34%(+0.314)#42 | 1.61%(+0.048)#2,332 |
| 43. | Indian Field | 1.55% | 1.34%(+0.208)#43 | 1.61%(-0.057)#2,452 |
| 44. | Quinnipiac University | 1.54% | 1.34%(+0.199)#44 | 1.61%(-0.066)#2,466 |
| 45. | Terramuggus | 1.54% | 1.34%(+0.199)#45 | 1.61%(-0.066)#2,467 |
| 46. | Old Hill | 1.54% | 1.34%(+0.197)#46 | 1.61%(-0.068)#2,470 |
| 47. | Danielson Borough | 1.54% | 1.34%(+0.194)#47 | 1.61%(-0.071)#2,474 |
| 48. | North Haven | 1.52% | 1.34%(+0.178)#48 | 1.61%(-0.087)#2,498 |
| 49. | Essex Village | 1.50% | 1.34%(+0.161)#49 | 1.61%(-0.104)#2,524 |
| 50. | Cannondale | 1.50% | 1.34%(+0.160)#50 | 1.61%(-0.105)#2,528 |
| 51. | Kensington | 1.47% | 1.34%(+0.128)#51 | 1.61%(-0.137)#2,581 |
| 52. | Poplar Plains | 1.40% | 1.34%(+0.054)#52 | 1.61%(-0.211)#2,710 |
| 53. | Thomaston | 1.39% | 1.34%(+0.046)#53 | 1.61%(-0.219)#2,718 |
| 54. | Newtown Borough | 1.38% | 1.34%(+0.035)#54 | 1.61%(-0.231)#2,731 |
| 55. | Wethersfield | 1.35% | 1.34%(+0.010)#55 | 1.61%(-0.255)#2,766 |
| 56. | Saugatuck | 1.33% | 1.34%(-0.010)#56 | 1.61%(-0.275)#2,798 |
| 57. | Norwalk | 1.33% | 1.34%(-0.012)#57 | 1.61%(-0.278)#2,800 |
| 58. | Portland | 1.32% | 1.34%(-0.019)#58 | 1.61%(-0.284)#2,807 |
| 59. | Ridgefield | 1.29% | 1.34%(-0.050)#59 | 1.61%(-0.315)#2,857 |
| 60. | Mystic | 1.29% | 1.34%(-0.053)#60 | 1.61%(-0.318)#2,862 |
| 61. | Milford City Balance | 1.25% | 1.34%(-0.094)#61 | 1.61%(-0.359)#2,949 |
| 62. | Tokeneke | 1.24% | 1.34%(-0.101)#62 | 1.61%(-0.366)#2,962 |
| 63. | Long Hill | 1.24% | 1.34%(-0.105)#63 | 1.61%(-0.370)#2,969 |
| 64. | Branford Center | 1.19% | 1.34%(-0.150)#64 | 1.61%(-0.415)#3,061 |
| 65. | Newington | 1.19% | 1.34%(-0.155)#65 | 1.61%(-0.420)#3,069 |
| 66. | West Haven | 1.18% | 1.34%(-0.167)#66 | 1.61%(-0.432)#3,089 |
| 67. | Tariffville | 1.16% | 1.34%(-0.179)#67 | 1.61%(-0.444)#3,114 |
| 68. | Naugatuck Borough | 1.13% | 1.34%(-0.216)#68 | 1.61%(-0.481)#3,187 |
| 69. | Litchfield Borough | 1.11% | 1.34%(-0.237)#69 | 1.61%(-0.502)#3,242 |
| 70. | Willimantic | 1.08% | 1.34%(-0.263)#70 | 1.61%(-0.528)#3,297 |
| 71. | Ansonia | 1.04% | 1.34%(-0.299)#71 | 1.61%(-0.564)#3,389 |
| 72. | Stepney | 1.03% | 1.34%(-0.309)#72 | 1.61%(-0.574)#3,414 |
| 73. | East | 1.00% | 1.34%(-0.341)#73 | 1.61%(-0.606)#3,501 |
| 74. | New Canaan | 0.96% | 1.34%(-0.382)#74 | 1.61%(-0.647)#3,614 |
| 75. | Wallingford Center | 0.96% | 1.34%(-0.388)#75 | 1.61%(-0.653)#3,636 |
| 76. | Groton | 0.94% | 1.34%(-0.404)#76 | 1.61%(-0.669)#3,676 |
| 77. | Fairfield University | 0.92% | 1.34%(-0.428)#77 | 1.61%(-0.694)#3,748 |
| 78. | Lakes East | 0.89% | 1.34%(-0.451)#78 | 1.61%(-0.717)#3,824 |
| 79. | Danbury | 0.89% | 1.34%(-0.454)#79 | 1.61%(-0.719)#3,830 |
| 80. | Coleytown | 0.88% | 1.34%(-0.459)#80 | 1.61%(-0.724)#3,844 |
| 81. | Bridgeport | 0.86% | 1.34%(-0.481)#81 | 1.61%(-0.746)#3,924 |
| 82. | Derby | 0.86% | 1.34%(-0.487)#82 | 1.61%(-0.752)#3,941 |
| 83. | East Haven | 0.82% | 1.34%(-0.526)#83 | 1.61%(-0.791)#4,072 |
| 84. | Pawcatuck | 0.79% | 1.34%(-0.554)#84 | 1.61%(-0.819)#4,159 |
| 85. | Colchester | 0.76% | 1.34%(-0.584)#85 | 1.61%(-0.849)#4,258 |
| 86. | Plantsville | 0.67% | 1.34%(-0.672)#86 | 1.61%(-0.937)#4,564 |
| 87. | Meriden | 0.65% | 1.34%(-0.693)#87 | 1.61%(-0.958)#4,652 |
| 88. | Crystal Lake | 0.63% | 1.34%(-0.719)#88 | 1.61%(-0.984)#4,764 |
| 89. | Bristol | 0.60% | 1.34%(-0.742)#89 | 1.61%(-1.01)#4,859 |
| 90. | New Britain | 0.60% | 1.34%(-0.748)#90 | 1.61%(-1.01)#4,887 |
| 91. | Glenville | 0.58% | 1.34%(-0.765)#91 | 1.61%(-1.03)#4,963 |
| 92. | New London | 0.53% | 1.34%(-0.811)#92 | 1.61%(-1.08)#5,216 |
| 93. | Windsor Locks | 0.52% | 1.34%(-0.826)#93 | 1.61%(-1.09)#5,282 |
| 94. | Southwood Acres | 0.49% | 1.34%(-0.852)#94 | 1.61%(-1.12)#5,402 |
| 95. | Collinsville | 0.48% | 1.34%(-0.864)#95 | 1.61%(-1.13)#5,470 |
| 96. | Waterbury | 0.44% | 1.34%(-0.902)#96 | 1.61%(-1.17)#5,679 |
| 97. | Manchester | 0.44% | 1.34%(-0.906)#97 | 1.61%(-1.17)#5,702 |
| 98. | Hartford | 0.43% | 1.34%(-0.909)#98 | 1.61%(-1.17)#5,722 |
| 99. | Durham | 0.40% | 1.34%(-0.940)#99 | 1.61%(-1.21)#5,907 |
| 100. | West Simsbury | 0.39% | 1.34%(-0.950)#100 | 1.61%(-1.22)#5,969 |
1
2Common Questions
What are the Top 10 Cities with the Highest Percentage of Indian (Asian) Population in Connecticut?
Top 10 Cities with the Highest Percentage of Indian (Asian) Population in Connecticut are:
#1
15.11%
#2
11.33%
#3
7.36%
#4
6.16%
#5
5.56%
#6
5.40%
#7
4.59%
#8
4.02%
#9
3.86%
#10
3.78%
What city has the Highest Percentage of Indian (Asian) Population in Connecticut?
East Brooklyn has the Highest Percentage of Indian (Asian) Population in Connecticut with 15.11%.
What is the Percentage of Indian (Asian) Population in the State of Connecticut?
Percentage of Indian (Asian) Population in Connecticut is 1.34%.
What is the Percentage of Indian (Asian) Population in the United States?
Percentage of Indian (Asian) Population in the United States is 1.61%.