Cities with the Highest Percentage of Indian (Asian) Population in Ohio
RELATED REPORTS & OPTIONS
Indian (Asian)
Ohio
Compare Cities
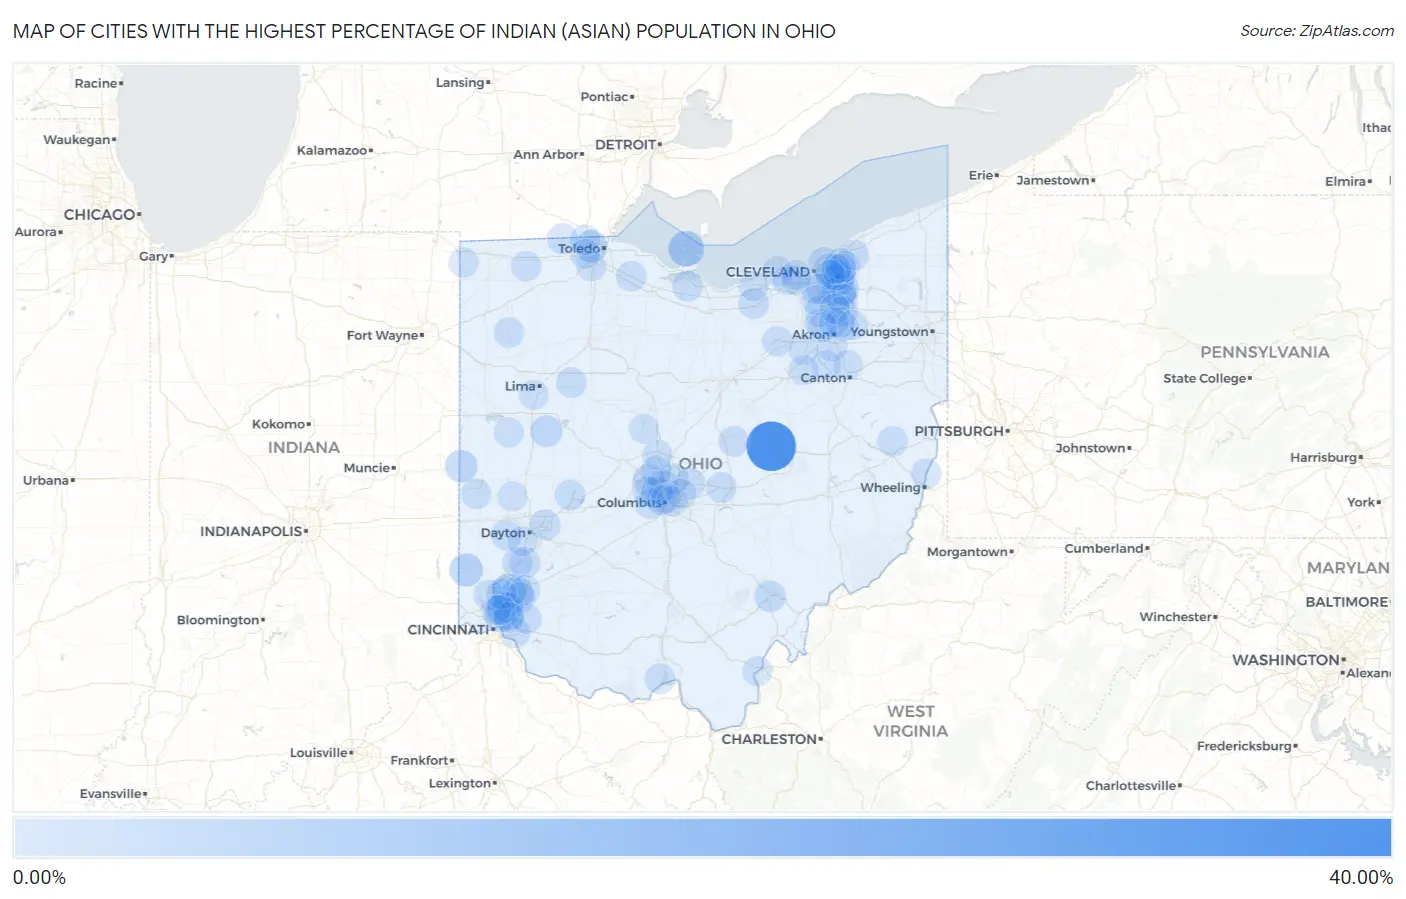
Map of Cities with the Highest Percentage of Indian (Asian) Population in Ohio
0.00%
40.00%
Cities with the Highest Percentage of Indian (Asian) Population in Ohio
| City | Indian (Asian) | vs State | vs National | |
| 1. | Nellie | 39.06% | 0.58%(+38.5)#1 | 1.61%(+37.4)#16 |
| 2. | Put In Bay | 11.24% | 0.58%(+10.7)#2 | 1.61%(+9.63)#246 |
| 3. | Wetherington | 9.30% | 0.58%(+8.71)#3 | 1.61%(+7.69)#334 |
| 4. | Glenwillow | 8.95% | 0.58%(+8.37)#4 | 1.61%(+7.34)#354 |
| 5. | Oxford | 6.69% | 0.58%(+6.10)#5 | 1.61%(+5.08)#507 |
| 6. | Solon | 6.05% | 0.58%(+5.46)#6 | 1.61%(+4.44)#584 |
| 7. | Union City | 5.24% | 0.58%(+4.65)#7 | 1.61%(+3.63)#707 |
| 8. | Ottawa Hills | 5.17% | 0.58%(+4.58)#8 | 1.61%(+3.56)#720 |
| 9. | Evendale | 5.03% | 0.58%(+4.45)#9 | 1.61%(+3.42)#746 |
| 10. | Orange | 4.28% | 0.58%(+3.70)#10 | 1.61%(+2.67)#907 |
| 11. | Dublin | 4.06% | 0.58%(+3.47)#11 | 1.61%(+2.45)#946 |
| 12. | Mason | 4.01% | 0.58%(+3.42)#12 | 1.61%(+2.40)#962 |
| 13. | Kenwood | 3.91% | 0.58%(+3.32)#13 | 1.61%(+2.30)#984 |
| 14. | Jackson Center | 3.85% | 0.58%(+3.26)#14 | 1.61%(+2.24)#1,010 |
| 15. | Golf Manor | 3.75% | 0.58%(+3.17)#15 | 1.61%(+2.14)#1,030 |
| 16. | Beachwood | 3.63% | 0.58%(+3.05)#16 | 1.61%(+2.02)#1,067 |
| 17. | Athens | 3.52% | 0.58%(+2.94)#17 | 1.61%(+1.91)#1,096 |
| 18. | Upper Arlington | 3.51% | 0.58%(+2.93)#18 | 1.61%(+1.90)#1,099 |
| 19. | Richfield | 3.07% | 0.58%(+2.48)#19 | 1.61%(+1.46)#1,267 |
| 20. | Bratenahl | 2.53% | 0.58%(+1.95)#20 | 1.61%(+0.923)#1,555 |
| 21. | New Lebanon | 2.42% | 0.58%(+1.84)#21 | 1.61%(+0.812)#1,627 |
| 22. | Wright Patterson Afb | 2.38% | 0.58%(+1.80)#22 | 1.61%(+0.772)#1,659 |
| 23. | Highland Heights | 2.33% | 0.58%(+1.75)#23 | 1.61%(+0.726)#1,696 |
| 24. | Pepper Pike | 2.29% | 0.58%(+1.70)#24 | 1.61%(+0.678)#1,734 |
| 25. | Granville | 2.28% | 0.58%(+1.70)#25 | 1.61%(+0.676)#1,735 |
| 26. | Metamora | 2.24% | 0.58%(+1.66)#26 | 1.61%(+0.631)#1,763 |
| 27. | Tremont City | 2.23% | 0.58%(+1.64)#27 | 1.61%(+0.621)#1,768 |
| 28. | Oberlin | 2.18% | 0.58%(+1.60)#28 | 1.61%(+0.576)#1,797 |
| 29. | Castalia | 2.17% | 0.58%(+1.58)#29 | 1.61%(+0.557)#1,818 |
| 30. | Riverlea | 2.14% | 0.58%(+1.55)#30 | 1.61%(+0.527)#1,844 |
| 31. | Seven Hills | 2.11% | 0.58%(+1.52)#31 | 1.61%(+0.497)#1,869 |
| 32. | Ada | 2.06% | 0.58%(+1.48)#32 | 1.61%(+0.455)#1,884 |
| 33. | Landen | 2.01% | 0.58%(+1.43)#33 | 1.61%(+0.404)#1,928 |
| 34. | Cleveland Heights | 1.97% | 0.58%(+1.39)#34 | 1.61%(+0.364)#1,975 |
| 35. | Hudson | 1.94% | 0.58%(+1.35)#35 | 1.61%(+0.330)#2,011 |
| 36. | Springboro | 1.90% | 0.58%(+1.32)#36 | 1.61%(+0.296)#2,043 |
| 37. | Lodi | 1.85% | 0.58%(+1.26)#37 | 1.61%(+0.236)#2,105 |
| 38. | Gambier | 1.75% | 0.58%(+1.17)#38 | 1.61%(+0.141)#2,206 |
| 39. | New Albany | 1.75% | 0.58%(+1.16)#39 | 1.61%(+0.141)#2,209 |
| 40. | Elmore | 1.75% | 0.58%(+1.16)#40 | 1.61%(+0.140)#2,212 |
| 41. | Blue Ash | 1.75% | 0.58%(+1.16)#41 | 1.61%(+0.140)#2,213 |
| 42. | Cherry Grove | 1.73% | 0.58%(+1.14)#42 | 1.61%(+0.118)#2,239 |
| 43. | Gates Mills | 1.71% | 0.58%(+1.13)#43 | 1.61%(+0.106)#2,257 |
| 44. | Fairfield | 1.70% | 0.58%(+1.11)#44 | 1.61%(+0.088)#2,284 |
| 45. | Beckett Ridge | 1.68% | 0.58%(+1.10)#45 | 1.61%(+0.071)#2,303 |
| 46. | Day Heights | 1.67% | 0.58%(+1.08)#46 | 1.61%(+0.056)#2,321 |
| 47. | Franklin | 1.66% | 0.58%(+1.08)#47 | 1.61%(+0.053)#2,326 |
| 48. | Madeira | 1.65% | 0.58%(+1.07)#48 | 1.61%(+0.046)#2,338 |
| 49. | Lincoln Village | 1.65% | 0.58%(+1.07)#49 | 1.61%(+0.045)#2,342 |
| 50. | Portage Lakes | 1.59% | 0.58%(+1.00)#50 | 1.61%(-0.022)#2,414 |
| 51. | West Portsmouth | 1.57% | 0.58%(+0.990)#51 | 1.61%(-0.034)#2,429 |
| 52. | Yorkville | 1.56% | 0.58%(+0.979)#52 | 1.61%(-0.045)#2,444 |
| 53. | Jewett | 1.54% | 0.58%(+0.960)#53 | 1.61%(-0.064)#2,460 |
| 54. | Oakwood | 1.54% | 0.58%(+0.953)#54 | 1.61%(-0.071)#2,475 |
| 55. | Kirtland | 1.53% | 0.58%(+0.948)#55 | 1.61%(-0.076)#2,482 |
| 56. | Westerville | 1.52% | 0.58%(+0.939)#56 | 1.61%(-0.085)#2,494 |
| 57. | Pettisville | 1.52% | 0.58%(+0.930)#57 | 1.61%(-0.094)#2,505 |
| 58. | Independence | 1.50% | 0.58%(+0.914)#58 | 1.61%(-0.110)#2,539 |
| 59. | Powell | 1.50% | 0.58%(+0.910)#59 | 1.61%(-0.114)#2,545 |
| 60. | Mayfield Heights | 1.48% | 0.58%(+0.891)#60 | 1.61%(-0.133)#2,576 |
| 61. | Avon Lake | 1.47% | 0.58%(+0.882)#61 | 1.61%(-0.142)#2,585 |
| 62. | Grandview Heights | 1.45% | 0.58%(+0.868)#62 | 1.61%(-0.156)#2,611 |
| 63. | Wayne Lakes | 1.45% | 0.58%(+0.866)#63 | 1.61%(-0.158)#2,616 |
| 64. | Hilliard | 1.37% | 0.58%(+0.784)#64 | 1.61%(-0.240)#2,750 |
| 65. | Montrose Ghent | 1.33% | 0.58%(+0.748)#65 | 1.61%(-0.276)#2,799 |
| 66. | Westlake | 1.28% | 0.58%(+0.691)#66 | 1.61%(-0.333)#2,884 |
| 67. | Bexley | 1.26% | 0.58%(+0.678)#67 | 1.61%(-0.346)#2,907 |
| 68. | Columbus | 1.26% | 0.58%(+0.675)#68 | 1.61%(-0.349)#2,919 |
| 69. | Munroe Falls | 1.25% | 0.58%(+0.667)#69 | 1.61%(-0.357)#2,941 |
| 70. | Shaker Heights | 1.23% | 0.58%(+0.650)#70 | 1.61%(-0.374)#2,976 |
| 71. | Twinsburg | 1.23% | 0.58%(+0.649)#71 | 1.61%(-0.375)#2,977 |
| 72. | Fairview Park | 1.23% | 0.58%(+0.641)#72 | 1.61%(-0.383)#2,991 |
| 73. | South Lebanon | 1.22% | 0.58%(+0.639)#73 | 1.61%(-0.385)#2,996 |
| 74. | Gahanna | 1.22% | 0.58%(+0.637)#74 | 1.61%(-0.387)#3,001 |
| 75. | Fairlawn | 1.22% | 0.58%(+0.637)#75 | 1.61%(-0.388)#3,002 |
| 76. | Rocky River | 1.20% | 0.58%(+0.612)#76 | 1.61%(-0.412)#3,053 |
| 77. | Lyndhurst | 1.14% | 0.58%(+0.555)#77 | 1.61%(-0.469)#3,163 |
| 78. | Delaware | 1.12% | 0.58%(+0.539)#78 | 1.61%(-0.485)#3,198 |
| 79. | Wyoming | 1.11% | 0.58%(+0.528)#79 | 1.61%(-0.496)#3,228 |
| 80. | Sylvania | 1.10% | 0.58%(+0.513)#80 | 1.61%(-0.511)#3,263 |
| 81. | Silver Lake | 1.07% | 0.58%(+0.484)#81 | 1.61%(-0.540)#3,326 |
| 82. | Broadview Heights | 1.06% | 0.58%(+0.480)#82 | 1.61%(-0.544)#3,334 |
| 83. | Moraine | 1.06% | 0.58%(+0.479)#83 | 1.61%(-0.545)#3,338 |
| 84. | New Bremen | 1.05% | 0.58%(+0.469)#84 | 1.61%(-0.555)#3,360 |
| 85. | Gallipolis | 1.05% | 0.58%(+0.464)#85 | 1.61%(-0.560)#3,376 |
| 86. | Boston Heights | 1.05% | 0.58%(+0.462)#86 | 1.61%(-0.562)#3,381 |
| 87. | Canal Fulton | 1.03% | 0.58%(+0.450)#87 | 1.61%(-0.574)#3,412 |
| 88. | Kent | 1.02% | 0.58%(+0.432)#88 | 1.61%(-0.592)#3,466 |
| 89. | Rittman | 1.01% | 0.58%(+0.422)#89 | 1.61%(-0.602)#3,489 |
| 90. | Fort Shawnee | 1.00% | 0.58%(+0.419)#90 | 1.61%(-0.605)#3,499 |
| 91. | Lockland | 1.00% | 0.58%(+0.416)#91 | 1.61%(-0.608)#3,502 |
| 92. | Edon | 1.00% | 0.58%(+0.413)#92 | 1.61%(-0.611)#3,511 |
| 93. | Cuyahoga Falls | 1.00% | 0.58%(+0.411)#93 | 1.61%(-0.613)#3,520 |
| 94. | Ludlow Falls | 1.00% | 0.58%(+0.410)#94 | 1.61%(-0.614)#3,523 |
| 95. | Perrysburg | 0.99% | 0.58%(+0.409)#95 | 1.61%(-0.615)#3,527 |
| 96. | North Canton | 0.99% | 0.58%(+0.406)#96 | 1.61%(-0.619)#3,538 |
| 97. | Orrville | 0.99% | 0.58%(+0.403)#97 | 1.61%(-0.621)#3,547 |
| 98. | Amherst | 0.98% | 0.58%(+0.396)#98 | 1.61%(-0.628)#3,563 |
| 99. | Holland | 0.96% | 0.58%(+0.376)#99 | 1.61%(-0.648)#3,616 |
| 100. | Prospect | 0.95% | 0.58%(+0.362)#100 | 1.61%(-0.662)#3,655 |
Common Questions
What are the Top 10 Cities with the Highest Percentage of Indian (Asian) Population in Ohio?
Top 10 Cities with the Highest Percentage of Indian (Asian) Population in Ohio are:
#1
39.06%
#2
11.24%
#3
9.30%
#4
8.95%
#5
6.69%
#6
6.05%
#7
5.24%
#8
5.17%
#9
5.03%
#10
4.28%
What city has the Highest Percentage of Indian (Asian) Population in Ohio?
Nellie has the Highest Percentage of Indian (Asian) Population in Ohio with 39.06%.
What is the Percentage of Indian (Asian) Population in the State of Ohio?
Percentage of Indian (Asian) Population in Ohio is 0.58%.
What is the Percentage of Indian (Asian) Population in the United States?
Percentage of Indian (Asian) Population in the United States is 1.61%.