Cities with the Highest Percentage of Panamanian Population in Virginia
RELATED REPORTS & OPTIONS
Panamanian
Virginia
Compare Cities
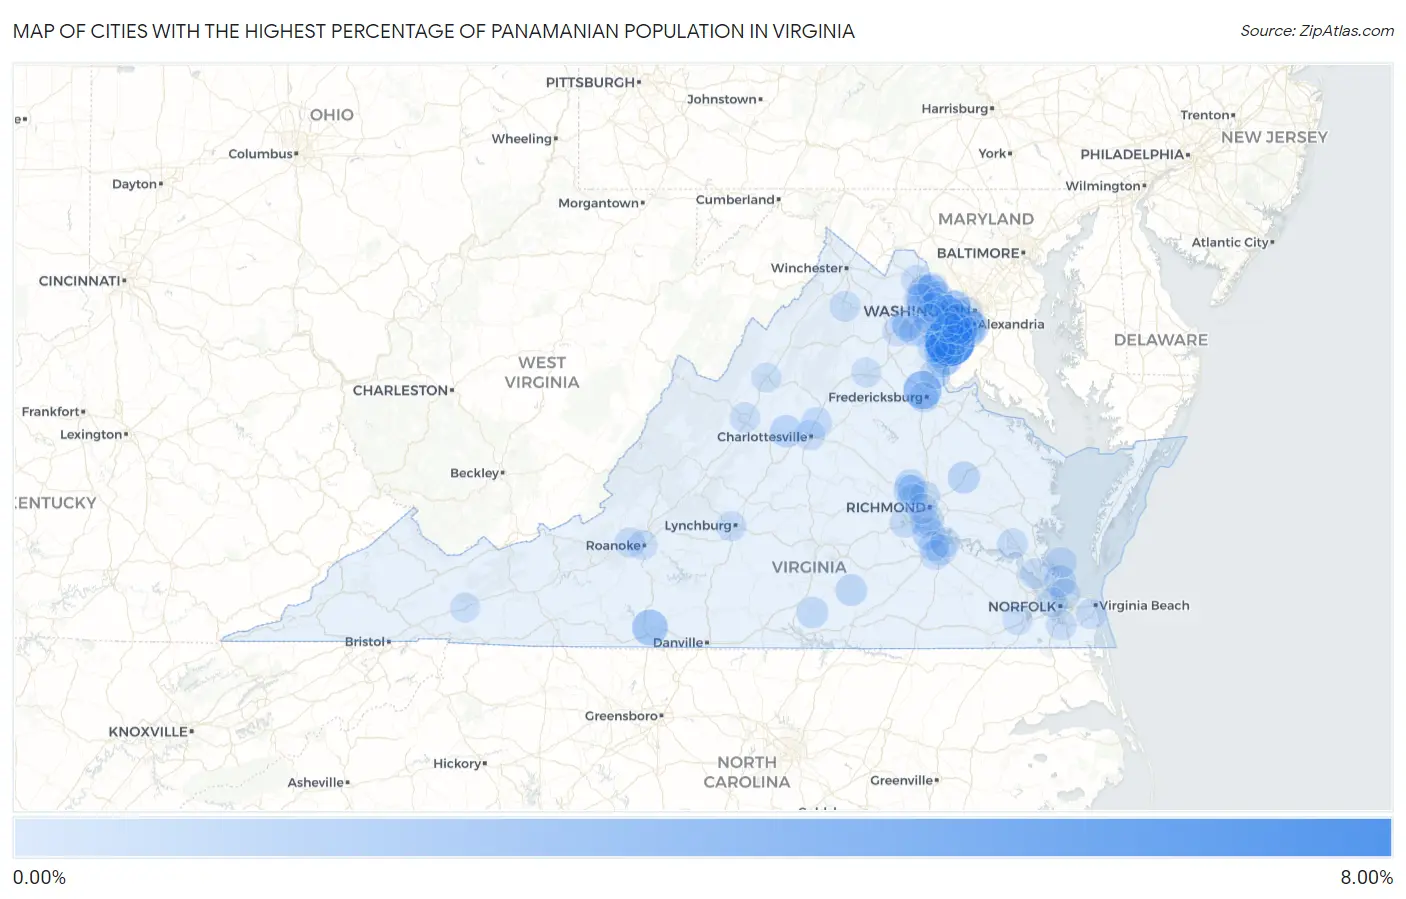
Map of Cities with the Highest Percentage of Panamanian Population in Virginia
0.00%
8.00%
Cities with the Highest Percentage of Panamanian Population in Virginia
| City | Panamanian | vs State | vs National | |
| 1. | Occoquan | 7.28% | 0.12%(+7.16)#1 | 0.068%(+7.21)#16 |
| 2. | Southern Gateway | 2.90% | 0.12%(+2.78)#2 | 0.068%(+2.83)#45 |
| 3. | One Loudoun | 2.70% | 0.12%(+2.58)#3 | 0.068%(+2.63)#50 |
| 4. | Villa Heights | 2.04% | 0.12%(+1.92)#4 | 0.068%(+1.97)#72 |
| 5. | Tysons | 1.13% | 0.12%(+1.01)#5 | 0.068%(+1.06)#158 |
| 6. | Leesylvania | 1.10% | 0.12%(+0.981)#6 | 0.068%(+1.03)#166 |
| 7. | Dulles Town Center | 1.00% | 0.12%(+0.885)#7 | 0.068%(+0.935)#187 |
| 8. | Crozet | 0.87% | 0.12%(+0.748)#8 | 0.068%(+0.798)#226 |
| 9. | Chester | 0.83% | 0.12%(+0.714)#9 | 0.068%(+0.765)#243 |
| 10. | Belle Haven | 0.80% | 0.12%(+0.684)#10 | 0.068%(+0.734)#258 |
| 11. | Ashburn | 0.79% | 0.12%(+0.671)#11 | 0.068%(+0.722)#266 |
| 12. | Central Garage | 0.72% | 0.12%(+0.600)#12 | 0.068%(+0.650)#290 |
| 13. | Triangle | 0.72% | 0.12%(+0.598)#13 | 0.068%(+0.649)#291 |
| 14. | Cherry Hill | 0.68% | 0.12%(+0.566)#14 | 0.068%(+0.617)#308 |
| 15. | West Falls Church | 0.67% | 0.12%(+0.550)#15 | 0.068%(+0.601)#316 |
| 16. | Hampton | 0.64% | 0.12%(+0.525)#16 | 0.068%(+0.575)#326 |
| 17. | West Springfield | 0.62% | 0.12%(+0.498)#17 | 0.068%(+0.548)#346 |
| 18. | Kenbridge | 0.58% | 0.12%(+0.458)#18 | 0.068%(+0.508)#371 |
| 19. | Chase City | 0.51% | 0.12%(+0.395)#19 | 0.068%(+0.445)#418 |
| 20. | Midlothian | 0.48% | 0.12%(+0.363)#20 | 0.068%(+0.413)#448 |
| 21. | Franconia | 0.47% | 0.12%(+0.351)#21 | 0.068%(+0.401)#459 |
| 22. | Montclair | 0.44% | 0.12%(+0.321)#22 | 0.068%(+0.371)#496 |
| 23. | Wyndham | 0.44% | 0.12%(+0.320)#23 | 0.068%(+0.370)#499 |
| 24. | Hollymead | 0.35% | 0.12%(+0.237)#24 | 0.068%(+0.287)#608 |
| 25. | Alexandria | 0.35% | 0.12%(+0.227)#25 | 0.068%(+0.277)#626 |
| 26. | Short Pump | 0.35% | 0.12%(+0.227)#26 | 0.068%(+0.277)#627 |
| 27. | Fair Oaks | 0.33% | 0.12%(+0.209)#27 | 0.068%(+0.260)#648 |
| 28. | Huntington | 0.32% | 0.12%(+0.198)#28 | 0.068%(+0.248)#666 |
| 29. | Lake Ridge | 0.32% | 0.12%(+0.197)#29 | 0.068%(+0.248)#669 |
| 30. | Braddock | 0.31% | 0.12%(+0.196)#30 | 0.068%(+0.247)#670 |
| 31. | Newington | 0.30% | 0.12%(+0.184)#31 | 0.068%(+0.235)#692 |
| 32. | Dale City | 0.28% | 0.12%(+0.159)#32 | 0.068%(+0.210)#751 |
| 33. | Arlington | 0.27% | 0.12%(+0.156)#33 | 0.068%(+0.207)#755 |
| 34. | Poquoson | 0.27% | 0.12%(+0.154)#34 | 0.068%(+0.205)#759 |
| 35. | Moorefield | 0.25% | 0.12%(+0.137)#35 | 0.068%(+0.187)#793 |
| 36. | Haymarket | 0.25% | 0.12%(+0.136)#36 | 0.068%(+0.187)#794 |
| 37. | Fort Lee | 0.25% | 0.12%(+0.133)#37 | 0.068%(+0.183)#801 |
| 38. | Front Royal | 0.25% | 0.12%(+0.128)#38 | 0.068%(+0.178)#812 |
| 39. | Brandermill | 0.25% | 0.12%(+0.127)#39 | 0.068%(+0.177)#814 |
| 40. | Aquia Harbour | 0.24% | 0.12%(+0.127)#40 | 0.068%(+0.177)#816 |
| 41. | Rose Hill Cdp Fairfax County | 0.24% | 0.12%(+0.122)#41 | 0.068%(+0.173)#826 |
| 42. | South Riding | 0.24% | 0.12%(+0.122)#42 | 0.068%(+0.172)#828 |
| 43. | Williamsburg | 0.22% | 0.12%(+0.101)#43 | 0.068%(+0.152)#887 |
| 44. | Brambleton | 0.21% | 0.12%(+0.088)#44 | 0.068%(+0.138)#934 |
| 45. | Bensley | 0.20% | 0.12%(+0.081)#45 | 0.068%(+0.131)#962 |
| 46. | Dranesville | 0.20% | 0.12%(+0.079)#46 | 0.068%(+0.130)#968 |
| 47. | Lakeside | 0.19% | 0.12%(+0.072)#47 | 0.068%(+0.122)#994 |
| 48. | Kingstowne | 0.18% | 0.12%(+0.063)#48 | 0.068%(+0.113)#1,035 |
| 49. | Reston | 0.18% | 0.12%(+0.060)#49 | 0.068%(+0.110)#1,052 |
| 50. | Charlottesville | 0.17% | 0.12%(+0.053)#50 | 0.068%(+0.103)#1,087 |
| 51. | Norfolk | 0.17% | 0.12%(+0.049)#51 | 0.068%(+0.099)#1,104 |
| 52. | Difficult Run | 0.16% | 0.12%(+0.045)#52 | 0.068%(+0.095)#1,121 |
| 53. | Staunton | 0.15% | 0.12%(+0.030)#53 | 0.068%(+0.081)#1,168 |
| 54. | Virginia Beach | 0.15% | 0.12%(+0.030)#54 | 0.068%(+0.080)#1,175 |
| 55. | Chesapeake | 0.14% | 0.12%(+0.020)#55 | 0.068%(+0.071)#1,211 |
| 56. | Newport News | 0.13% | 0.12%(+0.014)#56 | 0.068%(+0.065)#1,248 |
| 57. | New Baltimore | 0.13% | 0.12%(+0.010)#57 | 0.068%(+0.060)#1,280 |
| 58. | Fredericksburg | 0.13% | 0.12%(+0.009)#58 | 0.068%(+0.060)#1,284 |
| 59. | Innsbrook | 0.13% | 0.12%(+0.008)#59 | 0.068%(+0.059)#1,290 |
| 60. | Meadowbrook | 0.12% | 0.12%(+0.002)#60 | 0.068%(+0.052)#1,319 |
| 61. | Merrifield | 0.11% | 0.12%(-0.008)#61 | 0.068%(+0.043)#1,378 |
| 62. | Salem | 0.11% | 0.12%(-0.008)#62 | 0.068%(+0.043)#1,380 |
| 63. | Petersburg | 0.10% | 0.12%(-0.016)#63 | 0.068%(+0.034)#1,419 |
| 64. | Manassas | 0.10% | 0.12%(-0.017)#64 | 0.068%(+0.033)#1,429 |
| 65. | Woodbridge | 0.096% | 0.12%(-0.022)#65 | 0.068%(+0.028)#1,460 |
| 66. | Loudoun Valley Estates | 0.095% | 0.12%(-0.023)#66 | 0.068%(+0.027)#1,470 |
| 67. | Leesburg | 0.091% | 0.12%(-0.027)#67 | 0.068%(+0.023)#1,492 |
| 68. | Countryside | 0.083% | 0.12%(-0.035)#68 | 0.068%(+0.015)#1,550 |
| 69. | Hybla Valley | 0.083% | 0.12%(-0.035)#69 | 0.068%(+0.015)#1,553 |
| 70. | Colonial Heights | 0.083% | 0.12%(-0.035)#70 | 0.068%(+0.015)#1,556 |
| 71. | Lynchburg | 0.081% | 0.12%(-0.037)#71 | 0.068%(+0.013)#1,565 |
| 72. | Gainesville | 0.077% | 0.12%(-0.041)#72 | 0.068%(+0.009)#1,596 |
| 73. | Lorton | 0.068% | 0.12%(-0.050)#73 | 0.068%(+0.000)#1,672 |
| 74. | Oakton | 0.063% | 0.12%(-0.055)#74 | 0.068%(-0.005)#1,714 |
| 75. | Tuckahoe | 0.062% | 0.12%(-0.056)#75 | 0.068%(-0.005)#1,720 |
| 76. | Independent Hill | 0.061% | 0.12%(-0.057)#76 | 0.068%(-0.007)#1,739 |
| 77. | Richmond | 0.061% | 0.12%(-0.057)#77 | 0.068%(-0.007)#1,740 |
| 78. | Springfield | 0.058% | 0.12%(-0.060)#78 | 0.068%(-0.010)#1,762 |
| 79. | Kings Park West | 0.053% | 0.12%(-0.065)#79 | 0.068%(-0.015)#1,799 |
| 80. | Mclean | 0.048% | 0.12%(-0.070)#80 | 0.068%(-0.019)#1,844 |
| 81. | Fair Lakes | 0.045% | 0.12%(-0.073)#81 | 0.068%(-0.023)#1,882 |
| 82. | Franklin Farm | 0.042% | 0.12%(-0.076)#82 | 0.068%(-0.025)#1,908 |
| 83. | Linton Hall | 0.040% | 0.12%(-0.078)#83 | 0.068%(-0.028)#1,943 |
| 84. | Roanoke | 0.037% | 0.12%(-0.081)#84 | 0.068%(-0.030)#1,967 |
| 85. | Vienna | 0.037% | 0.12%(-0.081)#85 | 0.068%(-0.031)#1,980 |
| 86. | Marion | 0.035% | 0.12%(-0.083)#86 | 0.068%(-0.033)#1,994 |
| 87. | Annandale | 0.033% | 0.12%(-0.085)#87 | 0.068%(-0.035)#2,011 |
| 88. | Portsmouth | 0.032% | 0.12%(-0.086)#88 | 0.068%(-0.036)#2,031 |
| 89. | Culpeper | 0.030% | 0.12%(-0.088)#89 | 0.068%(-0.038)#2,062 |
| 90. | Burke | 0.029% | 0.12%(-0.089)#90 | 0.068%(-0.038)#2,067 |
| 91. | Suffolk | 0.028% | 0.12%(-0.090)#91 | 0.068%(-0.039)#2,078 |
| 92. | Centreville | 0.025% | 0.12%(-0.093)#92 | 0.068%(-0.043)#2,123 |
| 93. | Harrisonburg | 0.012% | 0.12%(-0.106)#93 | 0.068%(-0.056)#2,276 |
| 94. | Hopewell | 0.0043% | 0.12%(-0.114)#94 | 0.068%(-0.063)#2,338 |
Common Questions
What are the Top 10 Cities with the Highest Percentage of Panamanian Population in Virginia?
Top 10 Cities with the Highest Percentage of Panamanian Population in Virginia are:
#1
7.28%
#2
2.90%
#3
2.04%
#4
1.13%
#5
1.00%
#6
0.87%
#7
0.83%
#8
0.80%
#9
0.79%
#10
0.72%
What city has the Highest Percentage of Panamanian Population in Virginia?
Occoquan has the Highest Percentage of Panamanian Population in Virginia with 7.28%.
What is the Percentage of Panamanian Population in the State of Virginia?
Percentage of Panamanian Population in Virginia is 0.12%.
What is the Percentage of Panamanian Population in the United States?
Percentage of Panamanian Population in the United States is 0.068%.