Cities with the Highest Percentage of Panamanian Population in New York
RELATED REPORTS & OPTIONS
Panamanian
New York
Compare Cities
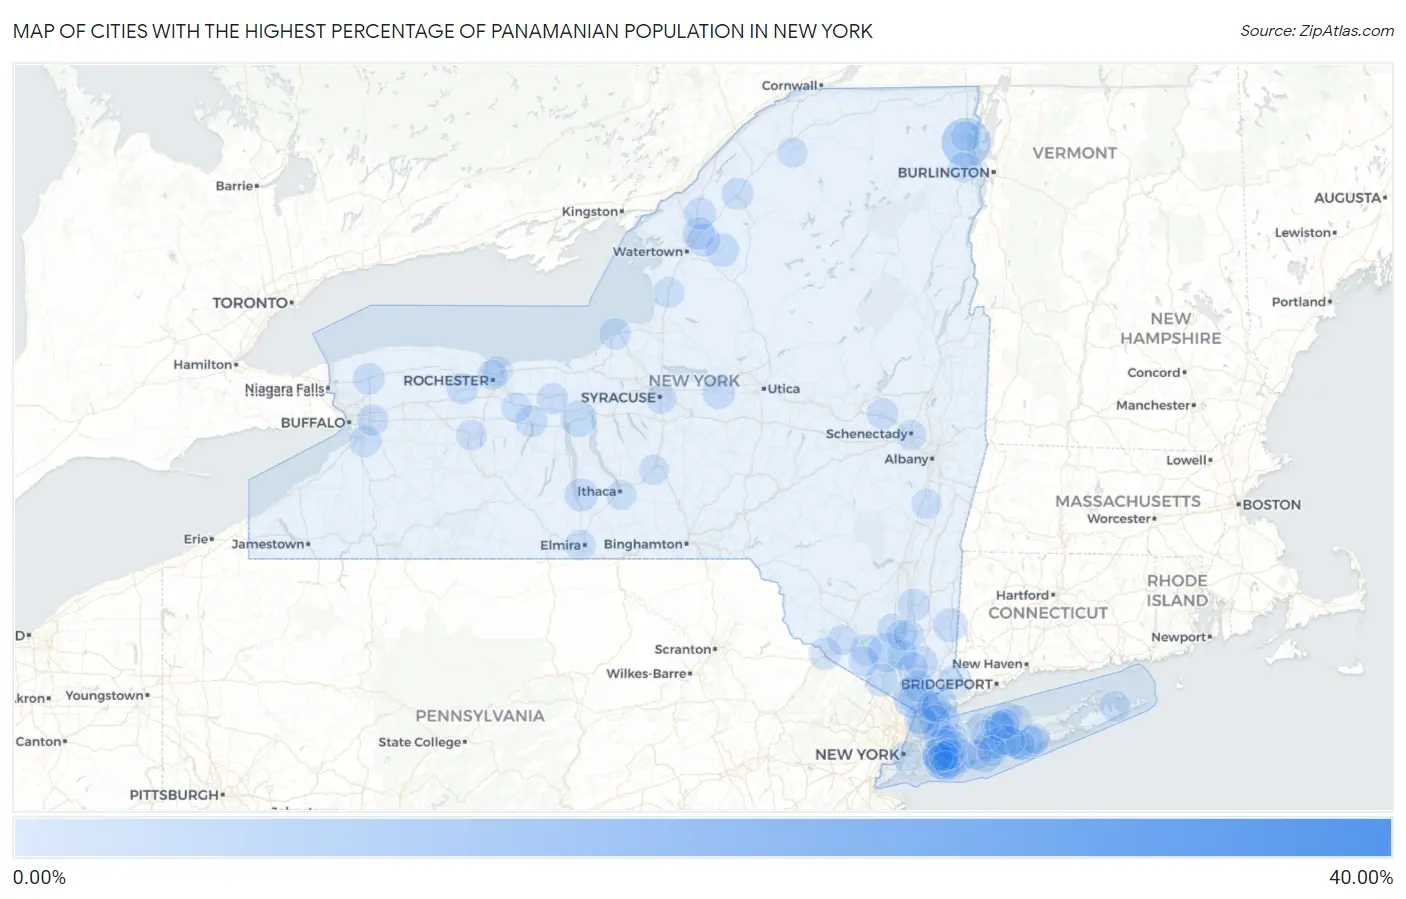
Map of Cities with the Highest Percentage of Panamanian Population in New York
0.00%
40.00%
Cities with the Highest Percentage of Panamanian Population in New York
| City | Panamanian | vs State | vs National | |
| 1. | Hankins | 30.08% | 0.16%(+29.9)#1 | 0.068%(+30.0)#1 |
| 2. | Parc | 5.26% | 0.16%(+5.10)#2 | 0.068%(+5.20)#25 |
| 3. | Nyack | 3.33% | 0.16%(+3.17)#3 | 0.068%(+3.26)#36 |
| 4. | Mountain Lodge Park | 2.59% | 0.16%(+2.43)#4 | 0.068%(+2.52)#53 |
| 5. | Waterloo | 1.79% | 0.16%(+1.63)#5 | 0.068%(+1.72)#89 |
| 6. | North Bellport | 1.77% | 0.16%(+1.60)#6 | 0.068%(+1.70)#90 |
| 7. | West Islip | 1.43% | 0.16%(+1.27)#7 | 0.068%(+1.36)#118 |
| 8. | Rye Brook | 1.40% | 0.16%(+1.24)#8 | 0.068%(+1.33)#122 |
| 9. | Scotts Corners | 1.29% | 0.16%(+1.13)#9 | 0.068%(+1.22)#133 |
| 10. | Rye | 1.28% | 0.16%(+1.12)#10 | 0.068%(+1.22)#134 |
| 11. | Pawling | 1.24% | 0.16%(+1.08)#11 | 0.068%(+1.17)#142 |
| 12. | Lynbrook | 1.00% | 0.16%(+0.843)#12 | 0.068%(+0.937)#186 |
| 13. | Carthage | 1.00% | 0.16%(+0.839)#13 | 0.068%(+0.933)#189 |
| 14. | Burdett | 0.97% | 0.16%(+0.807)#14 | 0.068%(+0.901)#197 |
| 15. | Lake Mohegan | 0.93% | 0.16%(+0.765)#15 | 0.068%(+0.858)#208 |
| 16. | Milton Cdp Saratoga County | 0.91% | 0.16%(+0.751)#16 | 0.068%(+0.844)#209 |
| 17. | North Wantagh | 0.91% | 0.16%(+0.747)#17 | 0.068%(+0.841)#210 |
| 18. | Fort Drum | 0.86% | 0.16%(+0.697)#18 | 0.068%(+0.791)#229 |
| 19. | Oneida Castle | 0.86% | 0.16%(+0.697)#19 | 0.068%(+0.791)#230 |
| 20. | Tuxedo Park | 0.86% | 0.16%(+0.695)#20 | 0.068%(+0.789)#231 |
| 21. | Port Washington | 0.84% | 0.16%(+0.679)#21 | 0.068%(+0.773)#239 |
| 22. | South Floral Park | 0.83% | 0.16%(+0.668)#22 | 0.068%(+0.762)#245 |
| 23. | Poughkeepsie | 0.82% | 0.16%(+0.661)#23 | 0.068%(+0.755)#251 |
| 24. | Evans Mills | 0.80% | 0.16%(+0.634)#24 | 0.068%(+0.727)#263 |
| 25. | Port Jervis | 0.78% | 0.16%(+0.618)#25 | 0.068%(+0.712)#269 |
| 26. | Theresa | 0.76% | 0.16%(+0.600)#26 | 0.068%(+0.694)#272 |
| 27. | Freeport | 0.72% | 0.16%(+0.562)#27 | 0.068%(+0.656)#286 |
| 28. | Gouverneur | 0.63% | 0.16%(+0.469)#28 | 0.068%(+0.563)#334 |
| 29. | Mamaroneck | 0.62% | 0.16%(+0.455)#29 | 0.068%(+0.549)#345 |
| 30. | Orchard Park | 0.58% | 0.16%(+0.422)#30 | 0.068%(+0.516)#364 |
| 31. | Canandaigua | 0.58% | 0.16%(+0.416)#31 | 0.068%(+0.510)#369 |
| 32. | Lockport | 0.57% | 0.16%(+0.405)#32 | 0.068%(+0.499)#378 |
| 33. | Searingtown | 0.51% | 0.16%(+0.349)#33 | 0.068%(+0.443)#425 |
| 34. | Goshen | 0.51% | 0.16%(+0.344)#34 | 0.068%(+0.438)#430 |
| 35. | East Hills | 0.50% | 0.16%(+0.335)#35 | 0.068%(+0.429)#435 |
| 36. | Elmont | 0.49% | 0.16%(+0.332)#36 | 0.068%(+0.426)#438 |
| 37. | Niagara University | 0.49% | 0.16%(+0.331)#37 | 0.068%(+0.425)#439 |
| 38. | Mount Vernon | 0.46% | 0.16%(+0.297)#38 | 0.068%(+0.391)#469 |
| 39. | Amsterdam | 0.45% | 0.16%(+0.288)#39 | 0.068%(+0.382)#476 |
| 40. | Suny Oswego | 0.45% | 0.16%(+0.288)#40 | 0.068%(+0.382)#477 |
| 41. | Malverne | 0.45% | 0.16%(+0.284)#41 | 0.068%(+0.378)#484 |
| 42. | Lancaster | 0.44% | 0.16%(+0.281)#42 | 0.068%(+0.375)#487 |
| 43. | Yonkers | 0.44% | 0.16%(+0.279)#43 | 0.068%(+0.373)#492 |
| 44. | Ossining | 0.44% | 0.16%(+0.278)#44 | 0.068%(+0.372)#495 |
| 45. | St James | 0.44% | 0.16%(+0.275)#45 | 0.068%(+0.369)#500 |
| 46. | Churchville | 0.42% | 0.16%(+0.262)#46 | 0.068%(+0.356)#523 |
| 47. | Newark | 0.41% | 0.16%(+0.246)#47 | 0.068%(+0.340)#538 |
| 48. | Baldwin | 0.39% | 0.16%(+0.229)#48 | 0.068%(+0.323)#561 |
| 49. | New Cassel | 0.39% | 0.16%(+0.228)#49 | 0.068%(+0.322)#564 |
| 50. | East Northport | 0.38% | 0.16%(+0.223)#50 | 0.068%(+0.317)#570 |
| 51. | West Point | 0.33% | 0.16%(+0.167)#51 | 0.068%(+0.261)#644 |
| 52. | Nissequogue | 0.33% | 0.16%(+0.167)#52 | 0.068%(+0.261)#645 |
| 53. | North Patchogue | 0.32% | 0.16%(+0.159)#53 | 0.068%(+0.253)#653 |
| 54. | Mannsville | 0.30% | 0.16%(+0.143)#54 | 0.068%(+0.237)#687 |
| 55. | Hempstead | 0.30% | 0.16%(+0.142)#55 | 0.068%(+0.236)#688 |
| 56. | Springs | 0.29% | 0.16%(+0.133)#56 | 0.068%(+0.227)#707 |
| 57. | North Bay Shore | 0.29% | 0.16%(+0.132)#57 | 0.068%(+0.226)#709 |
| 58. | Peekskill | 0.29% | 0.16%(+0.130)#58 | 0.068%(+0.224)#716 |
| 59. | Orange Lake | 0.29% | 0.16%(+0.127)#59 | 0.068%(+0.221)#724 |
| 60. | Newburgh | 0.27% | 0.16%(+0.110)#60 | 0.068%(+0.204)#763 |
| 61. | West Elmira | 0.27% | 0.16%(+0.109)#61 | 0.068%(+0.203)#764 |
| 62. | Poquott | 0.27% | 0.16%(+0.109)#62 | 0.068%(+0.203)#765 |
| 63. | Brookville | 0.27% | 0.16%(+0.106)#63 | 0.068%(+0.200)#773 |
| 64. | New York | 0.26% | 0.16%(+0.100)#64 | 0.068%(+0.194)#777 |
| 65. | Geneseo | 0.26% | 0.16%(+0.098)#65 | 0.068%(+0.192)#782 |
| 66. | Hannawa Falls | 0.22% | 0.16%(+0.063)#66 | 0.068%(+0.156)#871 |
| 67. | Beacon | 0.22% | 0.16%(+0.062)#67 | 0.068%(+0.156)#872 |
| 68. | Central Islip | 0.22% | 0.16%(+0.057)#68 | 0.068%(+0.151)#889 |
| 69. | South Nyack | 0.22% | 0.16%(+0.057)#69 | 0.068%(+0.151)#891 |
| 70. | Uniondale | 0.22% | 0.16%(+0.055)#70 | 0.068%(+0.149)#898 |
| 71. | Otisville | 0.21% | 0.16%(+0.048)#71 | 0.068%(+0.142)#921 |
| 72. | Fallsburg | 0.20% | 0.16%(+0.039)#72 | 0.068%(+0.133)#953 |
| 73. | Keeseville | 0.20% | 0.16%(+0.035)#73 | 0.068%(+0.129)#972 |
| 74. | Ronkonkoma | 0.20% | 0.16%(+0.035)#74 | 0.068%(+0.129)#973 |
| 75. | Munsons Corners | 0.19% | 0.16%(+0.025)#75 | 0.068%(+0.119)#1,007 |
| 76. | Shirley | 0.18% | 0.16%(+0.023)#76 | 0.068%(+0.117)#1,014 |
| 77. | Victor | 0.18% | 0.16%(+0.022)#77 | 0.068%(+0.116)#1,021 |
| 78. | White Plains | 0.18% | 0.16%(+0.022)#78 | 0.068%(+0.116)#1,024 |
| 79. | Syracuse | 0.18% | 0.16%(+0.016)#79 | 0.068%(+0.110)#1,053 |
| 80. | Mastic | 0.17% | 0.16%(+0.012)#80 | 0.068%(+0.106)#1,072 |
| 81. | West Babylon | 0.17% | 0.16%(+0.007)#81 | 0.068%(+0.101)#1,095 |
| 82. | East Patchogue | 0.17% | 0.16%(+0.006)#82 | 0.068%(+0.100)#1,098 |
| 83. | Plattsburgh | 0.17% | 0.16%(+0.004)#83 | 0.068%(+0.098)#1,105 |
| 84. | Commack | 0.16% | 0.16%(+0.003)#84 | 0.068%(+0.097)#1,110 |
| 85. | Mount Sinai | 0.16% | 0.16%(+0.002)#85 | 0.068%(+0.095)#1,118 |
| 86. | Irondequoit | 0.15% | 0.16%(-0.010)#86 | 0.068%(+0.084)#1,161 |
| 87. | Holbrook | 0.15% | 0.16%(-0.011)#87 | 0.068%(+0.083)#1,164 |
| 88. | Roessleville | 0.15% | 0.16%(-0.015)#88 | 0.068%(+0.079)#1,180 |
| 89. | Coxsackie | 0.14% | 0.16%(-0.017)#89 | 0.068%(+0.077)#1,183 |
| 90. | Florida | 0.14% | 0.16%(-0.025)#90 | 0.068%(+0.068)#1,222 |
| 91. | Head Of The Harbor | 0.13% | 0.16%(-0.028)#91 | 0.068%(+0.065)#1,241 |
| 92. | Islip | 0.13% | 0.16%(-0.034)#92 | 0.068%(+0.060)#1,285 |
| 93. | South Hill | 0.12% | 0.16%(-0.041)#93 | 0.068%(+0.053)#1,312 |
| 94. | North Valley Stream | 0.12% | 0.16%(-0.041)#94 | 0.068%(+0.053)#1,313 |
| 95. | Oceanside | 0.12% | 0.16%(-0.044)#95 | 0.068%(+0.050)#1,335 |
| 96. | Harrison | 0.11% | 0.16%(-0.047)#96 | 0.068%(+0.047)#1,355 |
| 97. | Rochester | 0.11% | 0.16%(-0.047)#97 | 0.068%(+0.046)#1,358 |
| 98. | Stony Brook University | 0.11% | 0.16%(-0.047)#98 | 0.068%(+0.046)#1,359 |
| 99. | West Hempstead | 0.11% | 0.16%(-0.054)#99 | 0.068%(+0.040)#1,390 |
| 100. | Schenectady | 0.11% | 0.16%(-0.057)#100 | 0.068%(+0.037)#1,403 |
Common Questions
What are the Top 10 Cities with the Highest Percentage of Panamanian Population in New York?
Top 10 Cities with the Highest Percentage of Panamanian Population in New York are:
#1
5.26%
#2
3.33%
#3
2.59%
#4
1.79%
#5
1.77%
#6
1.43%
#7
1.40%
#8
1.29%
#9
1.28%
#10
1.24%
What city has the Highest Percentage of Panamanian Population in New York?
Parc has the Highest Percentage of Panamanian Population in New York with 5.26%.
What is the Percentage of Panamanian Population in the State of New York?
Percentage of Panamanian Population in New York is 0.16%.
What is the Percentage of Panamanian Population in the United States?
Percentage of Panamanian Population in the United States is 0.068%.