Cities with the Highest Percentage of Northern European Population in Maryland
RELATED REPORTS & OPTIONS
Northern European
Maryland
Compare Cities
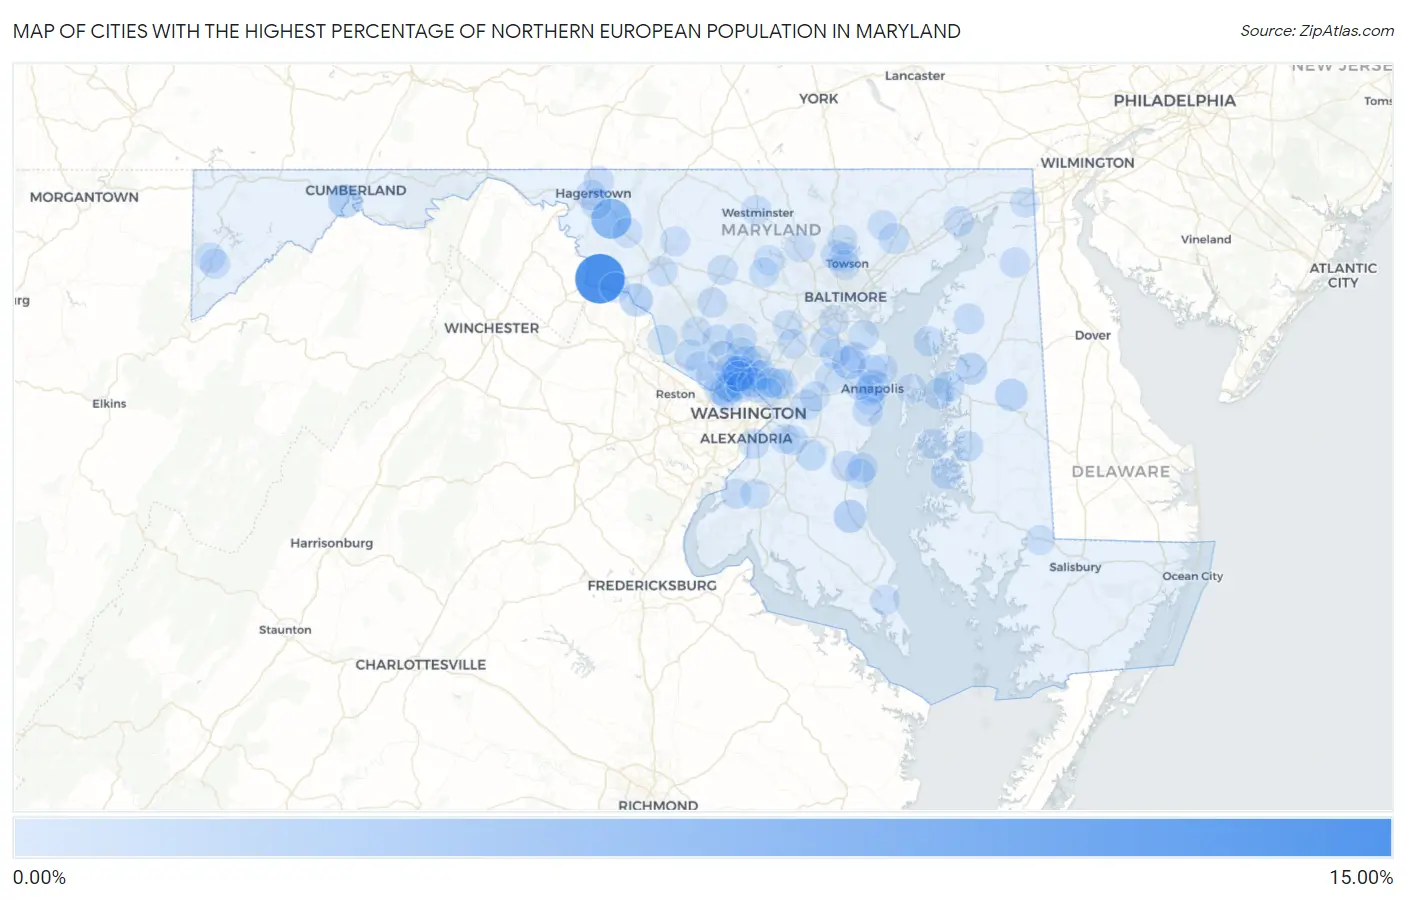
Map of Cities with the Highest Percentage of Northern European Population in Maryland
0.00%
15.00%
Cities with the Highest Percentage of Northern European Population in Maryland
| City | Northern European | vs State | vs National | |
| 1. | Garretts Mill | 14.01% | 0.13%(+13.9)#1 | 0.15%(+13.9)#32 |
| 2. | San Mar | 7.08% | 0.13%(+6.95)#2 | 0.15%(+6.93)#71 |
| 3. | Kensington | 3.88% | 0.13%(+3.75)#3 | 0.15%(+3.73)#151 |
| 4. | Potomac Park | 2.46% | 0.13%(+2.33)#4 | 0.15%(+2.31)#293 |
| 5. | Burnt Mills | 2.31% | 0.13%(+2.17)#5 | 0.15%(+2.16)#329 |
| 6. | Arden On The Severn | 2.27% | 0.13%(+2.14)#6 | 0.15%(+2.13)#333 |
| 7. | Point Of Rocks | 2.12% | 0.13%(+1.99)#7 | 0.15%(+1.97)#366 |
| 8. | Prince Frederick | 2.01% | 0.13%(+1.88)#8 | 0.15%(+1.86)#387 |
| 9. | Ridgely | 1.74% | 0.13%(+1.61)#9 | 0.15%(+1.59)#462 |
| 10. | Naval Academy | 1.69% | 0.13%(+1.56)#10 | 0.15%(+1.54)#481 |
| 11. | Centreville | 1.57% | 0.13%(+1.44)#11 | 0.15%(+1.43)#538 |
| 12. | Cabin John | 1.28% | 0.13%(+1.14)#12 | 0.15%(+1.13)#688 |
| 13. | Glen Echo | 1.06% | 0.13%(+0.933)#13 | 0.15%(+0.917)#840 |
| 14. | Grasonville | 0.87% | 0.13%(+0.739)#14 | 0.15%(+0.723)#1,062 |
| 15. | Chevy Chase | 0.86% | 0.13%(+0.727)#15 | 0.15%(+0.711)#1,078 |
| 16. | Washington Grove | 0.83% | 0.13%(+0.697)#16 | 0.15%(+0.680)#1,126 |
| 17. | Easton | 0.79% | 0.13%(+0.663)#17 | 0.15%(+0.647)#1,186 |
| 18. | Croom | 0.74% | 0.13%(+0.608)#18 | 0.15%(+0.592)#1,279 |
| 19. | Queenstown | 0.74% | 0.13%(+0.605)#19 | 0.15%(+0.589)#1,286 |
| 20. | Darnestown | 0.73% | 0.13%(+0.603)#20 | 0.15%(+0.587)#1,289 |
| 21. | Oxford | 0.73% | 0.13%(+0.603)#21 | 0.15%(+0.587)#1,290 |
| 22. | Four Corners | 0.72% | 0.13%(+0.590)#22 | 0.15%(+0.574)#1,328 |
| 23. | Berwyn Heights | 0.69% | 0.13%(+0.563)#23 | 0.15%(+0.547)#1,396 |
| 24. | Pleasant Hills | 0.69% | 0.13%(+0.557)#24 | 0.15%(+0.541)#1,407 |
| 25. | Olney | 0.68% | 0.13%(+0.545)#25 | 0.15%(+0.528)#1,437 |
| 26. | Glenmont | 0.67% | 0.13%(+0.542)#26 | 0.15%(+0.526)#1,445 |
| 27. | Rockville | 0.61% | 0.13%(+0.480)#27 | 0.15%(+0.463)#1,609 |
| 28. | Chestertown | 0.60% | 0.13%(+0.467)#28 | 0.15%(+0.450)#1,657 |
| 29. | Funkstown | 0.58% | 0.13%(+0.450)#29 | 0.15%(+0.433)#1,701 |
| 30. | Mays Chapel | 0.58% | 0.13%(+0.449)#30 | 0.15%(+0.433)#1,703 |
| 31. | National Harbor | 0.52% | 0.13%(+0.384)#31 | 0.15%(+0.368)#1,900 |
| 32. | Bethesda | 0.49% | 0.13%(+0.361)#32 | 0.15%(+0.344)#1,986 |
| 33. | Woodmore | 0.48% | 0.13%(+0.349)#33 | 0.15%(+0.333)#2,022 |
| 34. | Colesville | 0.47% | 0.13%(+0.336)#34 | 0.15%(+0.320)#2,078 |
| 35. | Owings | 0.46% | 0.13%(+0.332)#35 | 0.15%(+0.316)#2,087 |
| 36. | Brookmont | 0.46% | 0.13%(+0.325)#36 | 0.15%(+0.308)#2,115 |
| 37. | Oakland | 0.45% | 0.13%(+0.320)#37 | 0.15%(+0.304)#2,135 |
| 38. | Paramount Long Meadow | 0.43% | 0.13%(+0.298)#38 | 0.15%(+0.282)#2,223 |
| 39. | Brunswick | 0.41% | 0.13%(+0.280)#39 | 0.15%(+0.264)#2,316 |
| 40. | Annapolis | 0.41% | 0.13%(+0.279)#40 | 0.15%(+0.263)#2,324 |
| 41. | Melwood | 0.41% | 0.13%(+0.276)#41 | 0.15%(+0.260)#2,344 |
| 42. | Hagerstown | 0.41% | 0.13%(+0.275)#42 | 0.15%(+0.258)#2,349 |
| 43. | South Kensington | 0.39% | 0.13%(+0.263)#43 | 0.15%(+0.247)#2,412 |
| 44. | St Michaels | 0.39% | 0.13%(+0.263)#44 | 0.15%(+0.247)#2,414 |
| 45. | Garrett Park | 0.37% | 0.13%(+0.237)#45 | 0.15%(+0.220)#2,582 |
| 46. | Havre De Grace | 0.37% | 0.13%(+0.235)#46 | 0.15%(+0.219)#2,590 |
| 47. | Chevy Chase View | 0.36% | 0.13%(+0.225)#47 | 0.15%(+0.209)#2,661 |
| 48. | Gambrills | 0.35% | 0.13%(+0.223)#48 | 0.15%(+0.206)#2,675 |
| 49. | Severna Park | 0.35% | 0.13%(+0.220)#49 | 0.15%(+0.204)#2,697 |
| 50. | Cecilton | 0.34% | 0.13%(+0.211)#50 | 0.15%(+0.194)#2,752 |
| 51. | Annapolis Neck | 0.34% | 0.13%(+0.207)#51 | 0.15%(+0.191)#2,775 |
| 52. | Poolesville | 0.33% | 0.13%(+0.203)#52 | 0.15%(+0.187)#2,800 |
| 53. | Potomac | 0.33% | 0.13%(+0.202)#53 | 0.15%(+0.186)#2,803 |
| 54. | Chesapeake Beach | 0.33% | 0.13%(+0.199)#54 | 0.15%(+0.183)#2,825 |
| 55. | Lutherville | 0.30% | 0.13%(+0.172)#55 | 0.15%(+0.156)#3,020 |
| 56. | Bryans Road | 0.29% | 0.13%(+0.160)#56 | 0.15%(+0.144)#3,117 |
| 57. | Takoma Park | 0.29% | 0.13%(+0.160)#57 | 0.15%(+0.143)#3,119 |
| 58. | North Bethesda | 0.28% | 0.13%(+0.148)#58 | 0.15%(+0.132)#3,215 |
| 59. | Mount Airy | 0.28% | 0.13%(+0.148)#59 | 0.15%(+0.132)#3,216 |
| 60. | Mayo | 0.28% | 0.13%(+0.148)#60 | 0.15%(+0.131)#3,223 |
| 61. | Rock Hall | 0.27% | 0.13%(+0.144)#61 | 0.15%(+0.127)#3,242 |
| 62. | Arnold | 0.27% | 0.13%(+0.139)#62 | 0.15%(+0.123)#3,288 |
| 63. | Riviera Beach | 0.26% | 0.13%(+0.125)#63 | 0.15%(+0.108)#3,393 |
| 64. | Mountain Lake Park | 0.24% | 0.13%(+0.105)#64 | 0.15%(+0.089)#3,558 |
| 65. | Damascus | 0.23% | 0.13%(+0.101)#65 | 0.15%(+0.084)#3,600 |
| 66. | Stevensville | 0.22% | 0.13%(+0.093)#66 | 0.15%(+0.077)#3,679 |
| 67. | Towson | 0.22% | 0.13%(+0.091)#67 | 0.15%(+0.075)#3,696 |
| 68. | Reisterstown | 0.22% | 0.13%(+0.090)#68 | 0.15%(+0.074)#3,716 |
| 69. | Eldersburg | 0.21% | 0.13%(+0.083)#69 | 0.15%(+0.067)#3,785 |
| 70. | Westminster | 0.21% | 0.13%(+0.078)#70 | 0.15%(+0.062)#3,837 |
| 71. | Columbia | 0.21% | 0.13%(+0.076)#71 | 0.15%(+0.060)#3,851 |
| 72. | Martin S Additions | 0.20% | 0.13%(+0.070)#72 | 0.15%(+0.054)#3,922 |
| 73. | Myersville | 0.20% | 0.13%(+0.070)#73 | 0.15%(+0.053)#3,932 |
| 74. | Hillandale | 0.20% | 0.13%(+0.069)#74 | 0.15%(+0.053)#3,938 |
| 75. | Crofton | 0.19% | 0.13%(+0.063)#75 | 0.15%(+0.047)#4,012 |
| 76. | Walkersville | 0.19% | 0.13%(+0.061)#76 | 0.15%(+0.045)#4,035 |
| 77. | Mardela Springs | 0.19% | 0.13%(+0.058)#77 | 0.15%(+0.042)#4,069 |
| 78. | North Beach | 0.19% | 0.13%(+0.058)#78 | 0.15%(+0.042)#4,071 |
| 79. | Travilah | 0.18% | 0.13%(+0.053)#79 | 0.15%(+0.037)#4,123 |
| 80. | Silver Spring | 0.18% | 0.13%(+0.049)#80 | 0.15%(+0.032)#4,175 |
| 81. | Linthicum | 0.18% | 0.13%(+0.046)#81 | 0.15%(+0.030)#4,220 |
| 82. | Greenbelt | 0.17% | 0.13%(+0.043)#82 | 0.15%(+0.027)#4,254 |
| 83. | Germantown | 0.16% | 0.13%(+0.033)#83 | 0.15%(+0.017)#4,361 |
| 84. | Sykesville | 0.16% | 0.13%(+0.032)#84 | 0.15%(+0.015)#4,373 |
| 85. | Ballenger Creek | 0.16% | 0.13%(+0.029)#85 | 0.15%(+0.013)#4,394 |
| 86. | Woodlawn Cdp Baltimore County | 0.15% | 0.13%(+0.023)#86 | 0.15%(+0.007)#4,487 |
| 87. | Fallston | 0.15% | 0.13%(+0.020)#87 | 0.15%(+0.003)#4,517 |
| 88. | Leisure World | 0.14% | 0.13%(+0.014)#88 | 0.15%(-0.002)#4,594 |
| 89. | Severn | 0.14% | 0.13%(+0.011)#89 | 0.15%(-0.006)#4,631 |
| 90. | Lexington Park | 0.14% | 0.13%(+0.009)#90 | 0.15%(-0.007)#4,644 |
| 91. | Elkton | 0.13% | 0.13%(+0.002)#91 | 0.15%(-0.015)#4,743 |
| 92. | Cape St Claire | 0.13% | 0.13%(-0.001)#92 | 0.15%(-0.017)#4,778 |
| 93. | Parole | 0.13% | 0.13%(-0.001)#93 | 0.15%(-0.018)#4,785 |
| 94. | Andrews Afb | 0.13% | 0.13%(-0.002)#94 | 0.15%(-0.018)#4,791 |
| 95. | College Park | 0.12% | 0.13%(-0.006)#95 | 0.15%(-0.022)#4,846 |
| 96. | Hyattsville | 0.12% | 0.13%(-0.006)#96 | 0.15%(-0.023)#4,851 |
| 97. | Cockeysville | 0.12% | 0.13%(-0.015)#97 | 0.15%(-0.031)#4,968 |
| 98. | Bowie | 0.12% | 0.13%(-0.015)#98 | 0.15%(-0.032)#4,974 |
| 99. | Bensville | 0.11% | 0.13%(-0.018)#99 | 0.15%(-0.035)#5,015 |
| 100. | North Laurel | 0.11% | 0.13%(-0.020)#100 | 0.15%(-0.037)#5,054 |
Common Questions
What are the Top 10 Cities with the Highest Percentage of Northern European Population in Maryland?
Top 10 Cities with the Highest Percentage of Northern European Population in Maryland are:
#1
14.01%
#2
7.08%
#3
3.88%
#4
2.46%
#5
2.27%
#6
2.12%
#7
2.01%
#8
1.74%
#9
1.69%
#10
1.57%
What city has the Highest Percentage of Northern European Population in Maryland?
Garretts Mill has the Highest Percentage of Northern European Population in Maryland with 14.01%.
What is the Percentage of Northern European Population in the State of Maryland?
Percentage of Northern European Population in Maryland is 0.13%.
What is the Percentage of Northern European Population in the United States?
Percentage of Northern European Population in the United States is 0.15%.