Cities with the Highest Percentage of Northern European Population in Texas
RELATED REPORTS & OPTIONS
Northern European
Texas
Compare Cities
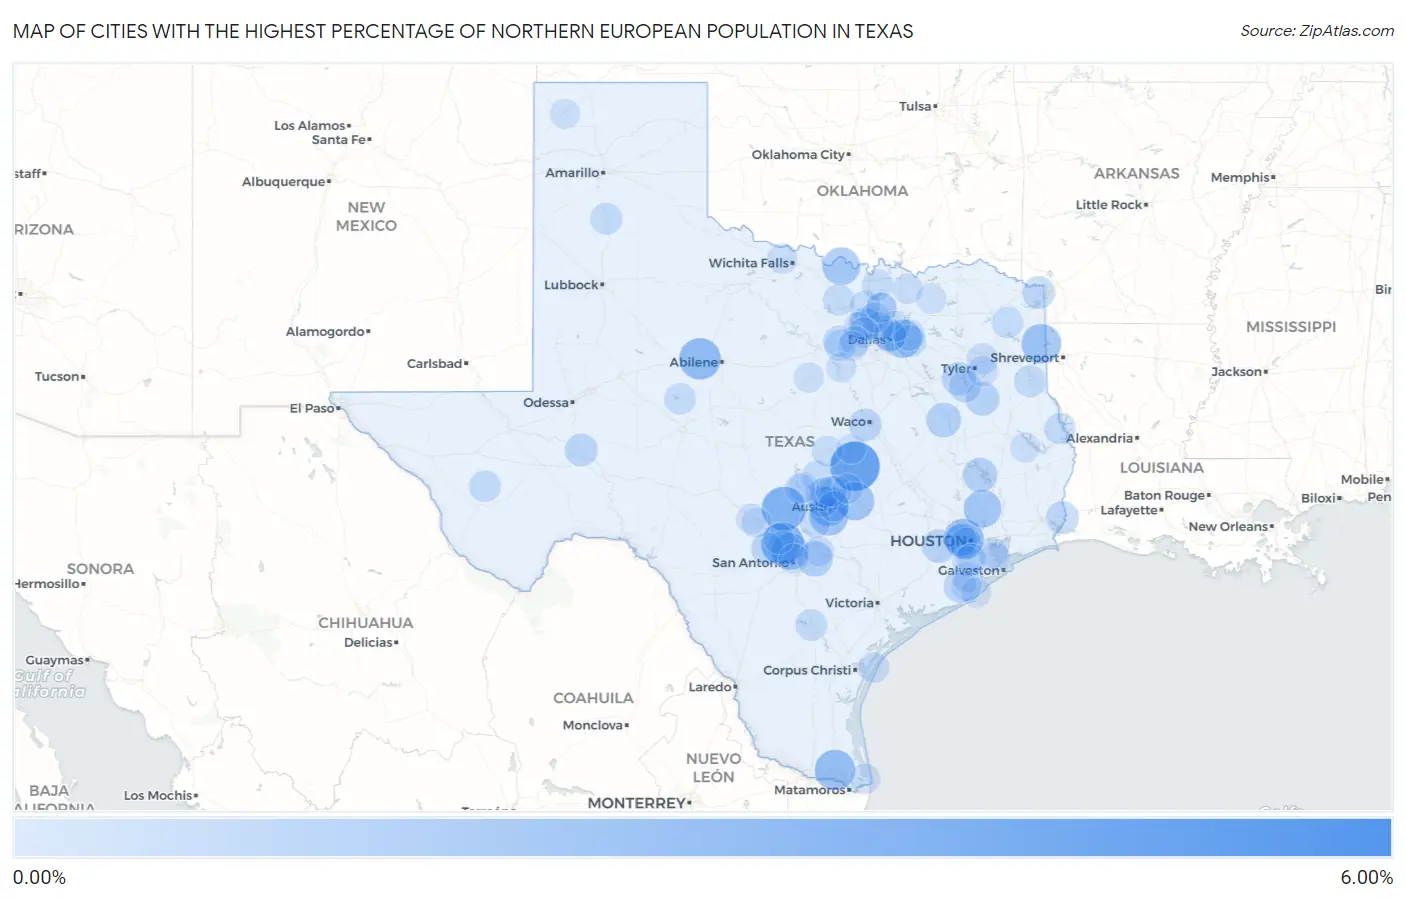
Map of Cities with the Highest Percentage of Northern European Population in Texas
0.00%
6.00%
Cities with the Highest Percentage of Northern European Population in Texas
| City | Northern European | vs State | vs National | |
| 1. | Double Horn | 5.77% | 0.100%(+5.67)#1 | 0.15%(+5.62)#89 |
| 2. | Holland | 4.63% | 0.100%(+4.53)#2 | 0.15%(+4.48)#125 |
| 3. | Stonewall | 3.40% | 0.100%(+3.30)#3 | 0.15%(+3.25)#184 |
| 4. | Scenic Oaks | 3.11% | 0.100%(+3.01)#4 | 0.15%(+2.96)#201 |
| 5. | Trent | 2.81% | 0.100%(+2.71)#5 | 0.15%(+2.66)#223 |
| 6. | Ringgold | 2.75% | 0.100%(+2.65)#6 | 0.15%(+2.60)#232 |
| 7. | Palm Valley | 2.56% | 0.100%(+2.46)#7 | 0.15%(+2.41)#272 |
| 8. | Hilshire Village | 2.46% | 0.100%(+2.36)#8 | 0.15%(+2.31)#296 |
| 9. | Uncertain | 2.35% | 0.100%(+2.25)#9 | 0.15%(+2.21)#321 |
| 10. | Barton Creek | 2.29% | 0.100%(+2.19)#10 | 0.15%(+2.14)#331 |
| 11. | Hays | 2.17% | 0.100%(+2.07)#11 | 0.15%(+2.03)#351 |
| 12. | Sunnyvale | 2.12% | 0.100%(+2.02)#12 | 0.15%(+1.97)#364 |
| 13. | Elgin | 2.12% | 0.100%(+2.02)#13 | 0.15%(+1.97)#365 |
| 14. | Splendora | 1.95% | 0.100%(+1.85)#14 | 0.15%(+1.80)#396 |
| 15. | Nocona Hills | 1.94% | 0.100%(+1.84)#15 | 0.15%(+1.79)#400 |
| 16. | Shavano Park | 1.83% | 0.100%(+1.73)#16 | 0.15%(+1.69)#435 |
| 17. | New Berlin | 1.44% | 0.100%(+1.34)#17 | 0.15%(+1.29)#593 |
| 18. | Piney Point Village | 1.35% | 0.100%(+1.25)#18 | 0.15%(+1.20)#639 |
| 19. | Oakwood | 1.30% | 0.100%(+1.20)#19 | 0.15%(+1.15)#680 |
| 20. | Point Blank | 1.23% | 0.100%(+1.13)#20 | 0.15%(+1.08)#711 |
| 21. | Gallatin | 1.12% | 0.100%(+1.02)#21 | 0.15%(+0.970)#790 |
| 22. | Moore Station | 1.06% | 0.100%(+0.959)#22 | 0.15%(+0.911)#843 |
| 23. | Weston Lakes | 1.05% | 0.100%(+0.950)#23 | 0.15%(+0.902)#847 |
| 24. | Cross Mountain | 0.97% | 0.100%(+0.873)#24 | 0.15%(+0.825)#930 |
| 25. | Lakehills | 0.92% | 0.100%(+0.824)#25 | 0.15%(+0.776)#987 |
| 26. | Pinehurst | 0.89% | 0.100%(+0.794)#26 | 0.15%(+0.747)#1,027 |
| 27. | Mccamey | 0.89% | 0.100%(+0.787)#27 | 0.15%(+0.740)#1,039 |
| 28. | Woodway | 0.87% | 0.100%(+0.773)#28 | 0.15%(+0.725)#1,057 |
| 29. | Brazoria | 0.87% | 0.100%(+0.770)#29 | 0.15%(+0.722)#1,063 |
| 30. | Highland Park | 0.84% | 0.100%(+0.737)#30 | 0.15%(+0.690)#1,110 |
| 31. | Roanoke | 0.83% | 0.100%(+0.726)#31 | 0.15%(+0.679)#1,130 |
| 32. | Red Lick | 0.82% | 0.100%(+0.720)#32 | 0.15%(+0.672)#1,136 |
| 33. | Berryville | 0.77% | 0.100%(+0.670)#33 | 0.15%(+0.623)#1,216 |
| 34. | University Park | 0.76% | 0.100%(+0.659)#34 | 0.15%(+0.611)#1,238 |
| 35. | Southside Place | 0.72% | 0.100%(+0.617)#35 | 0.15%(+0.569)#1,338 |
| 36. | Forney | 0.72% | 0.100%(+0.617)#36 | 0.15%(+0.569)#1,341 |
| 37. | Carthage | 0.70% | 0.100%(+0.603)#37 | 0.15%(+0.555)#1,375 |
| 38. | Lago Vista | 0.70% | 0.100%(+0.600)#38 | 0.15%(+0.553)#1,383 |
| 39. | Tulia | 0.68% | 0.100%(+0.578)#39 | 0.15%(+0.530)#1,433 |
| 40. | Bunker Hill Village | 0.65% | 0.100%(+0.555)#40 | 0.15%(+0.507)#1,485 |
| 41. | Milam | 0.65% | 0.100%(+0.551)#41 | 0.15%(+0.504)#1,495 |
| 42. | Fort Davis | 0.65% | 0.100%(+0.550)#42 | 0.15%(+0.502)#1,500 |
| 43. | Three Rivers | 0.65% | 0.100%(+0.547)#43 | 0.15%(+0.500)#1,508 |
| 44. | Alvord | 0.62% | 0.100%(+0.523)#44 | 0.15%(+0.475)#1,574 |
| 45. | Westlake | 0.62% | 0.100%(+0.516)#45 | 0.15%(+0.468)#1,593 |
| 46. | Heath | 0.61% | 0.100%(+0.514)#46 | 0.15%(+0.467)#1,597 |
| 47. | Robert Lee | 0.61% | 0.100%(+0.511)#47 | 0.15%(+0.463)#1,607 |
| 48. | Bertram | 0.60% | 0.100%(+0.501)#48 | 0.15%(+0.453)#1,646 |
| 49. | Daingerfield | 0.60% | 0.100%(+0.500)#49 | 0.15%(+0.452)#1,653 |
| 50. | Paloma Creek | 0.56% | 0.100%(+0.464)#50 | 0.15%(+0.416)#1,751 |
| 51. | Annetta | 0.55% | 0.100%(+0.453)#51 | 0.15%(+0.405)#1,776 |
| 52. | Krum | 0.55% | 0.100%(+0.451)#52 | 0.15%(+0.404)#1,784 |
| 53. | Hudson Oaks | 0.54% | 0.100%(+0.443)#53 | 0.15%(+0.395)#1,800 |
| 54. | Brushy Creek | 0.52% | 0.100%(+0.421)#54 | 0.15%(+0.373)#1,880 |
| 55. | The Hills | 0.52% | 0.100%(+0.419)#55 | 0.15%(+0.372)#1,888 |
| 56. | Winona | 0.51% | 0.100%(+0.414)#56 | 0.15%(+0.366)#1,906 |
| 57. | Lake Kiowa | 0.51% | 0.100%(+0.414)#57 | 0.15%(+0.366)#1,908 |
| 58. | Richardson | 0.50% | 0.100%(+0.403)#58 | 0.15%(+0.355)#1,950 |
| 59. | Copperas Cove | 0.48% | 0.100%(+0.378)#59 | 0.15%(+0.330)#2,033 |
| 60. | Boerne | 0.47% | 0.100%(+0.366)#60 | 0.15%(+0.318)#2,081 |
| 61. | Woodcreek | 0.46% | 0.100%(+0.361)#61 | 0.15%(+0.313)#2,100 |
| 62. | Port Aransas | 0.46% | 0.100%(+0.356)#62 | 0.15%(+0.308)#2,113 |
| 63. | Coppell | 0.45% | 0.100%(+0.347)#63 | 0.15%(+0.300)#2,150 |
| 64. | Center Point | 0.44% | 0.100%(+0.344)#64 | 0.15%(+0.296)#2,165 |
| 65. | Angleton | 0.44% | 0.100%(+0.337)#65 | 0.15%(+0.290)#2,194 |
| 66. | Reno City Parker And Tarrant Counties | 0.43% | 0.100%(+0.329)#66 | 0.15%(+0.281)#2,229 |
| 67. | Haslet | 0.43% | 0.100%(+0.328)#67 | 0.15%(+0.281)#2,230 |
| 68. | Meadowlakes | 0.42% | 0.100%(+0.320)#68 | 0.15%(+0.272)#2,272 |
| 69. | Jonestown | 0.42% | 0.100%(+0.318)#69 | 0.15%(+0.270)#2,283 |
| 70. | Iowa Park | 0.41% | 0.100%(+0.314)#70 | 0.15%(+0.266)#2,303 |
| 71. | Highland Village | 0.40% | 0.100%(+0.303)#71 | 0.15%(+0.256)#2,364 |
| 72. | Rollingwood | 0.40% | 0.100%(+0.297)#72 | 0.15%(+0.249)#2,402 |
| 73. | New Chapel Hill | 0.39% | 0.100%(+0.291)#73 | 0.15%(+0.243)#2,435 |
| 74. | Iowa Colony | 0.39% | 0.100%(+0.290)#74 | 0.15%(+0.242)#2,444 |
| 75. | Cedar Park | 0.39% | 0.100%(+0.288)#75 | 0.15%(+0.240)#2,454 |
| 76. | Watauga | 0.39% | 0.100%(+0.287)#76 | 0.15%(+0.240)#2,457 |
| 77. | Seabrook | 0.38% | 0.100%(+0.284)#77 | 0.15%(+0.236)#2,486 |
| 78. | Mcqueeney | 0.38% | 0.100%(+0.280)#78 | 0.15%(+0.232)#2,518 |
| 79. | Tom Bean | 0.37% | 0.100%(+0.274)#79 | 0.15%(+0.226)#2,547 |
| 80. | Westover Hills | 0.37% | 0.100%(+0.274)#80 | 0.15%(+0.226)#2,548 |
| 81. | Port Isabel | 0.37% | 0.100%(+0.270)#81 | 0.15%(+0.223)#2,569 |
| 82. | Horseshoe Bay | 0.37% | 0.100%(+0.270)#82 | 0.15%(+0.222)#2,570 |
| 83. | San Leon | 0.35% | 0.100%(+0.251)#83 | 0.15%(+0.203)#2,704 |
| 84. | Ingram | 0.35% | 0.100%(+0.250)#84 | 0.15%(+0.202)#2,713 |
| 85. | Reno City Lamar County | 0.35% | 0.100%(+0.248)#85 | 0.15%(+0.201)#2,720 |
| 86. | Kerrville | 0.34% | 0.100%(+0.241)#86 | 0.15%(+0.194)#2,758 |
| 87. | Stephenville | 0.33% | 0.100%(+0.233)#87 | 0.15%(+0.186)#2,806 |
| 88. | Benbrook | 0.33% | 0.100%(+0.233)#88 | 0.15%(+0.185)#2,809 |
| 89. | Pecan Plantation | 0.33% | 0.100%(+0.230)#89 | 0.15%(+0.183)#2,826 |
| 90. | Zavalla | 0.33% | 0.100%(+0.230)#90 | 0.15%(+0.183)#2,827 |
| 91. | Wolfe City | 0.33% | 0.100%(+0.229)#91 | 0.15%(+0.181)#2,840 |
| 92. | Surfside Beach | 0.32% | 0.100%(+0.225)#92 | 0.15%(+0.177)#2,872 |
| 93. | Hutto | 0.32% | 0.100%(+0.222)#93 | 0.15%(+0.175)#2,887 |
| 94. | Morgan S Point Resort | 0.32% | 0.100%(+0.222)#94 | 0.15%(+0.174)#2,889 |
| 95. | Manvel | 0.32% | 0.100%(+0.220)#95 | 0.15%(+0.172)#2,901 |
| 96. | Steiner Ranch | 0.32% | 0.100%(+0.219)#96 | 0.15%(+0.171)#2,908 |
| 97. | Lake Jackson | 0.32% | 0.100%(+0.219)#97 | 0.15%(+0.171)#2,913 |
| 98. | Dalhart | 0.31% | 0.100%(+0.212)#98 | 0.15%(+0.165)#2,959 |
| 99. | Providence Village | 0.31% | 0.100%(+0.212)#99 | 0.15%(+0.164)#2,963 |
| 100. | Alamo Heights | 0.31% | 0.100%(+0.210)#100 | 0.15%(+0.163)#2,974 |
Common Questions
What are the Top 10 Cities with the Highest Percentage of Northern European Population in Texas?
Top 10 Cities with the Highest Percentage of Northern European Population in Texas are:
#1
4.63%
#2
3.40%
#3
3.11%
#4
2.81%
#5
2.56%
#6
2.46%
#7
2.35%
#8
2.29%
#9
2.17%
#10
2.12%
What city has the Highest Percentage of Northern European Population in Texas?
Holland has the Highest Percentage of Northern European Population in Texas with 4.63%.
What is the Percentage of Northern European Population in the State of Texas?
Percentage of Northern European Population in Texas is 0.100%.
What is the Percentage of Northern European Population in the United States?
Percentage of Northern European Population in the United States is 0.15%.