Cities with the Highest Percentage of Northern European Population in Idaho

RELATED REPORTS & OPTIONS

Northern European
Population
Families and Households
Female Fertility
Female Fertility (Unmarried)
Race (Community Size)
Race (Percentage)
Ancestry (Community Size)
AfghanAfricanAlaska NativeAlaskan AthabascanAlbanianAleutAlsatianAmericanApacheArabArapahoArgentineanArmenianAssyrian / Chaldean / SyriacAustralianAustrianBahamianBangladeshiBarbadianBasqueBelgianBelizeanBermudanBhutaneseBlackfeetBolivianBrazilianBritishBritish West IndianBulgarianBurmeseCajunCambodianCanadianCape VerdeanCarpatho RusynCelticCentral AmericanCentral American IndianCherokeeCheyenneChickasawChileanChineseChippewaChoctawColombianColvilleComancheCosta RicanCreeCreekCroatianCrowCubanCypriotCzechCzechoslovakianDanishDelawareDominicanDutchDutch West IndianEastern EuropeanEcuadorianEgyptianEnglishEstonianEthiopianEuropeanFijianFilipinoFinnishFrenchFrench American IndianFrench CanadianGermanGerman RussianGhanaianGreekGuamanian / ChamorroGuatemalanGuyaneseHaitianHmongHonduranHopiHoumaHungarianIcelanderIndian (Asian)IndonesianInupiatIranianIraqiIrishIroquoisIsraeliItalianJamaicanJapaneseJordanianKenyanKiowaKoreanLaotianLatvianLebaneseLiberianLithuanianLumbeeLuxembourgerMacedonianMalaysianMalteseMarshalleseMenomineeMexicanMexican American IndianMongolianMoroccanNative HawaiianNavajoNepaleseNew ZealanderNicaraguanNigerianNorthern EuropeanNorwegianOkinawanOsageOttawaPaiutePakistaniPalestinianPanamanianParaguayanPennsylvania GermanPeruvianPimaPolishPortuguesePotawatomiPuebloPuerto RicanPuget Sound SalishRomanianRussianSalvadoranSamoanScandinavianScotch-IrishScottishSeminoleSenegaleseSerbianShoshoneSierra LeoneanSiouxSlavicSlovakSloveneSomaliSouth AfricanSouth AmericanSouth American IndianSoviet UnionSpaniardSpanishSpanish AmericanSpanish American IndianSri LankanSubsaharan AfricanSudaneseSwedishSwissSyrianTaiwaneseThaiTlingit-HaidaTohono O'OdhamTonganTrinidadian and TobagonianTsimshianTurkishU.S. Virgin IslanderUgandanUkrainianUruguayanUteVenezuelanVietnameseWelshWest IndianYakamaYaquiYugoslavianYumanYup'ikZimbabwean
Ancestry (Percentage)
AfghanAfricanAlaska NativeAlaskan AthabascanAlbanianAleutAlsatianAmericanApacheArabArapahoArgentineanArmenianAssyrian / Chaldean / SyriacAustralianAustrianBahamianBangladeshiBarbadianBasqueBelgianBelizeanBermudanBhutaneseBlackfeetBolivianBrazilianBritishBritish West IndianBulgarianBurmeseCajunCambodianCanadianCape VerdeanCarpatho RusynCelticCentral AmericanCentral American IndianCherokeeCheyenneChickasawChileanChineseChippewaChoctawColombianColvilleComancheCosta RicanCreeCreekCroatianCrowCubanCypriotCzechCzechoslovakianDanishDelawareDominicanDutchDutch West IndianEastern EuropeanEcuadorianEgyptianEnglishEstonianEthiopianEuropeanFijianFilipinoFinnishFrenchFrench American IndianFrench CanadianGermanGerman RussianGhanaianGreekGuamanian / ChamorroGuatemalanGuyaneseHaitianHmongHonduranHopiHoumaHungarianIcelanderIndian (Asian)IndonesianInupiatIranianIraqiIrishIroquoisIsraeliItalianJamaicanJapaneseJordanianKenyanKiowaKoreanLaotianLatvianLebaneseLiberianLithuanianLumbeeLuxembourgerMacedonianMalaysianMalteseMarshalleseMenomineeMexicanMexican American IndianMongolianMoroccanNative HawaiianNavajoNepaleseNew ZealanderNicaraguanNigerianNorthern EuropeanNorwegianOkinawanOsageOttawaPaiutePakistaniPalestinianPanamanianParaguayanPennsylvania GermanPeruvianPimaPolishPortuguesePotawatomiPuebloPuerto RicanPuget Sound SalishRomanianRussianSalvadoranSamoanScandinavianScotch-IrishScottishSeminoleSenegaleseSerbianShoshoneSierra LeoneanSiouxSlavicSlovakSloveneSomaliSouth AfricanSouth AmericanSouth American IndianSoviet UnionSpaniardSpanishSpanish AmericanSpanish American IndianSri LankanSubsaharan AfricanSudaneseSwedishSwissSyrianTaiwaneseThaiTlingit-HaidaTohono O'OdhamTonganTrinidadian and TobagonianTsimshianTurkishU.S. Virgin IslanderUgandanUkrainianUruguayanUteVenezuelanVietnameseWelshWest IndianYakamaYaquiYugoslavianYumanYup'ikZimbabwean
Immigrant Origin (Total)
AfghanistanAfricaAlbaniaArgentinaArmeniaAsiaAustraliaAustriaAzoresBahamasBangladeshBarbadosBelarusBelgiumBelizeBoliviaBosnia and HerzegovinaBrazilBulgariaBurma / MyanmarCabo VerdeCambodiaCameroonCanadaCaribbeanCentral AmericaChileChinaColombiaCongoCosta RicaCroatiaCubaCzechoslovakiaDenmarkDominicaDominican RepublicEastern AfricaEastern AsiaEastern EuropeEcuadorEgyptEl SalvadorEnglandEritreaEthiopiaEuropeFijiFranceGermanyGhanaGreeceGrenadaGuatemalaGuyanaHaitiHondurasHong KongHungaryIndiaIndonesiaIranIraqIrelandIsraelItalyJamaicaJapanJordanKazakhstanKenyaKoreaKuwaitLaosLatin AmericaLatviaLebanonLiberiaLithuaniaMalaysiaMexicoMicronesiaMiddle AfricaMoldovaMoroccoNepalNetherlandsNicaraguaNigeriaNorth MacedoniaNorthern AfricaNorthern EuropeNorwayOceaniaPakistanPanamaPeruPhilippinesPolandPortugalRomaniaRussiaSaudi ArabiaScotlandSenegalSerbiaSierra LeoneSingaporeSomaliaSouth AfricaSouth AmericaSouth Central AsiaSouth Eastern AsiaSouthern EuropeSpainSri LankaSt. Vincent and the GrenadinesSudanSwedenSwitzerlandSyriaTaiwanThailandTrinidad and TobagoTurkeyUgandaUkraineUruguayUzbekistanVenezuelaVietnamWest IndiesWestern AfricaWestern AsiaWestern EuropeYemenZaireZimbabwe
Immigrant Origin (Percentage)
AfghanistanAfricaAlbaniaArgentinaArmeniaAsiaAustraliaAustriaAzoresBahamasBangladeshBarbadosBelarusBelgiumBelizeBoliviaBosnia and HerzegovinaBrazilBulgariaBurma / MyanmarCabo VerdeCambodiaCameroonCanadaCaribbeanCentral AmericaChileChinaColombiaCongoCosta RicaCroatiaCubaCzechoslovakiaDenmarkDominicaDominican RepublicEastern AfricaEastern AsiaEastern EuropeEcuadorEgyptEl SalvadorEnglandEritreaEthiopiaEuropeFijiFranceGermanyGhanaGreeceGrenadaGuatemalaGuyanaHaitiHondurasHong KongHungaryIndiaIndonesiaIranIraqIrelandIsraelItalyJamaicaJapanJordanKazakhstanKenyaKoreaKuwaitLaosLatin AmericaLatviaLebanonLiberiaLithuaniaMalaysiaMexicoMicronesiaMiddle AfricaMoldovaMoroccoNepalNetherlandsNicaraguaNigeriaNorth MacedoniaNorthern AfricaNorthern EuropeNorwayOceaniaPakistanPanamaPeruPhilippinesPolandPortugalRomaniaRussiaSaudi ArabiaScotlandSenegalSerbiaSierra LeoneSingaporeSomaliaSouth AfricaSouth AmericaSouth Central AsiaSouth Eastern AsiaSouthern EuropeSpainSri LankaSt. Vincent and the GrenadinesSudanSwedenSwitzerlandSyriaTaiwanThailandTrinidad and TobagoTurkeyUgandaUkraineUruguayUzbekistanVenezuelaVietnamWest IndiesWestern AfricaWestern AsiaWestern EuropeYemenZaireZimbabwe
Income
Income (Families)
Income (Households)
Poverty
Poverty (Families)
Unemployment
Employment Occupations
Employment Industries
Employer Class
Commute Time
Commute Means
School Enrollment
Education by Degree Field
Occupancy
Finances
Physical Characteristics
Idaho
Compare Cities
Comparison Subject

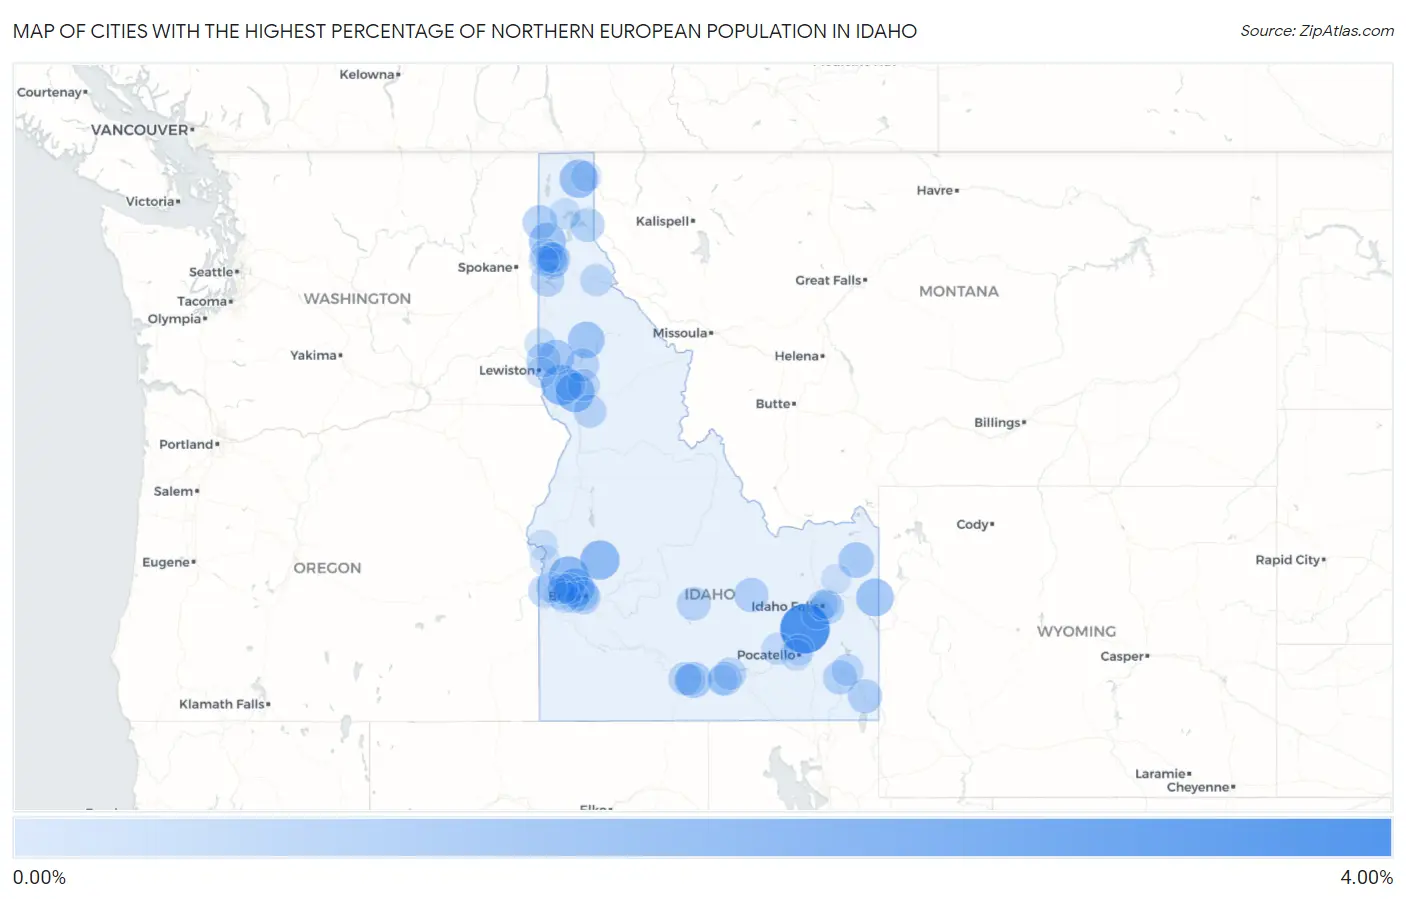
Map of Cities with the Highest Percentage of Northern European Population in Idaho

0.00%
4.00%
Cities with the Highest Percentage of Northern European Population in Idaho Map

Cities with the Highest Percentage of Northern European Population in Idaho

City Northern European vs State vs National
1.Blackfoot3.72%0.34%(+3.37)#10.15%(+3.57)#161
2.Winchester1.90%0.34%(+1.56)#20.15%(+1.75)#416
3.Emmett1.85%0.34%(+1.50)#30.15%(+1.70)#429
4.Garden Valley1.71%0.34%(+1.37)#40.15%(+1.56)#469
5.Ferdinand1.68%0.34%(+1.33)#50.15%(+1.53)#487
6.Eagle1.60%0.34%(+1.25)#60.15%(+1.45)#529
7.Bonners Ferry1.52%0.34%(+1.18)#70.15%(+1.38)#556
8.Victor1.39%0.34%(+1.05)#80.15%(+1.24)#615
9.Spirit Lake1.26%0.34%(+0.921)#90.15%(+1.12)#694
10.Elk River1.22%0.34%(+0.877)#100.15%(+1.07)#715
11.Hansen1.09%0.34%(+0.752)#110.15%(+0.947)#810
12.Juliaetta1.03%0.34%(+0.683)#120.15%(+0.878)#867
13.Ashton1.02%0.34%(+0.682)#130.15%(+0.877)#870
14.Oldtown0.83%0.34%(+0.491)#140.15%(+0.686)#1,116
15.Arco0.80%0.34%(+0.459)#150.15%(+0.654)#1,177
16.Garden City0.76%0.34%(+0.422)#160.15%(+0.617)#1,230
17.Montpelier0.76%0.34%(+0.413)#170.15%(+0.608)#1,244
18.Genesee0.74%0.34%(+0.402)#180.15%(+0.597)#1,265
19.Clark Fork0.73%0.34%(+0.384)#190.15%(+0.580)#1,310
20.Grace0.71%0.34%(+0.365)#200.15%(+0.560)#1,359
21.Heyburn0.69%0.34%(+0.344)#210.15%(+0.539)#1,412
22.Hailey0.66%0.34%(+0.318)#220.15%(+0.513)#1,475
23.Boise City0.66%0.34%(+0.318)#230.15%(+0.513)#1,476
24.Ammon0.66%0.34%(+0.316)#240.15%(+0.511)#1,479
25.Rockford Bay0.65%0.34%(+0.311)#250.15%(+0.506)#1,488
26.Orofino0.62%0.34%(+0.273)#260.15%(+0.468)#1,595
27.Wilder0.60%0.34%(+0.256)#270.15%(+0.451)#1,655
28.Dalton Gardens0.60%0.34%(+0.255)#280.15%(+0.450)#1,658
29.Twin Falls0.59%0.34%(+0.248)#290.15%(+0.443)#1,676
30.Grangeville0.56%0.34%(+0.221)#300.15%(+0.417)#1,750
31.Rathdrum0.50%0.34%(+0.160)#310.15%(+0.355)#1,949
32.Rupert0.45%0.34%(+0.103)#320.15%(+0.298)#2,157
33.Osburn0.43%0.34%(+0.088)#330.15%(+0.283)#2,220
34.Nezperce0.39%0.34%(+0.044)#340.15%(+0.239)#2,466
35.Soda Springs0.38%0.34%(+0.042)#350.15%(+0.237)#2,481
36.Aberdeen0.34%0.34%(+0.002)#360.15%(+0.197)#2,735
37.Shelley0.31%0.34%(-0.035)#370.15%(+0.160)#2,990
38.Kimberly0.30%0.34%(-0.044)#380.15%(+0.151)#3,063
39.Coeur D Alene0.29%0.34%(-0.055)#390.15%(+0.140)#3,142
40.Pocatello0.28%0.34%(-0.061)#400.15%(+0.134)#3,203
41.Hayden Lake0.26%0.34%(-0.083)#410.15%(+0.112)#3,368
42.Caldwell0.23%0.34%(-0.111)#420.15%(+0.085)#3,596
43.Meridian0.22%0.34%(-0.118)#430.15%(+0.077)#3,675
44.Moscow0.22%0.34%(-0.120)#440.15%(+0.075)#3,691
45.Star0.22%0.34%(-0.125)#450.15%(+0.070)#3,751
46.Sandpoint0.21%0.34%(-0.129)#460.15%(+0.066)#3,795
47.Nampa0.20%0.34%(-0.142)#470.15%(+0.053)#3,930
48.Craigmont0.20%0.34%(-0.143)#480.15%(+0.052)#3,943
49.Hayden0.17%0.34%(-0.171)#490.15%(+0.025)#4,278
50.Notus0.16%0.34%(-0.185)#500.15%(+0.011)#4,428
51.Moyie Springs0.15%0.34%(-0.188)#510.15%(+0.007)#4,481
52.Idaho Falls0.13%0.34%(-0.210)#520.15%(-0.015)#4,747
53.Lewiston0.13%0.34%(-0.211)#530.15%(-0.016)#4,761
54.Burley0.13%0.34%(-0.212)#540.15%(-0.017)#4,775
55.Chubbuck0.13%0.34%(-0.215)#550.15%(-0.019)#4,812
56.Weiser0.12%0.34%(-0.219)#560.15%(-0.024)#4,871
57.Payette0.11%0.34%(-0.232)#570.15%(-0.037)#5,063
58.Middleton0.10%0.34%(-0.238)#580.15%(-0.043)#5,143
59.Post Falls0.070%0.34%(-0.272)#590.15%(-0.077)#5,604
60.Lincoln0.055%0.34%(-0.288)#600.15%(-0.092)#5,794
61.Rexburg0.036%0.34%(-0.306)#610.15%(-0.111)#6,053

Common Questions

What are the Top 10 Cities with the Highest Percentage of Northern European Population in Idaho?
Top 10 Cities with the Highest Percentage of Northern European Population in Idaho are:
#1
3.72%
#2
1.90%
#3
1.85%
#4
1.71%
#5
1.68%
#6
1.60%
#7
1.52%
#8
1.39%
#9
1.26%
#10
1.22%
What city has the Highest Percentage of Northern European Population in Idaho?
Blackfoot has the Highest Percentage of Northern European Population in Idaho with 3.72%.
What is the Percentage of Northern European Population in the State of Idaho?
Percentage of Northern European Population in Idaho is 0.34%.
What is the Percentage of Northern European Population in the United States?
Percentage of Northern European Population in the United States is 0.15%.