Cities with the Highest Percentage of Northern European Population in North Carolina
RELATED REPORTS & OPTIONS
Northern European
North Carolina
Compare Cities
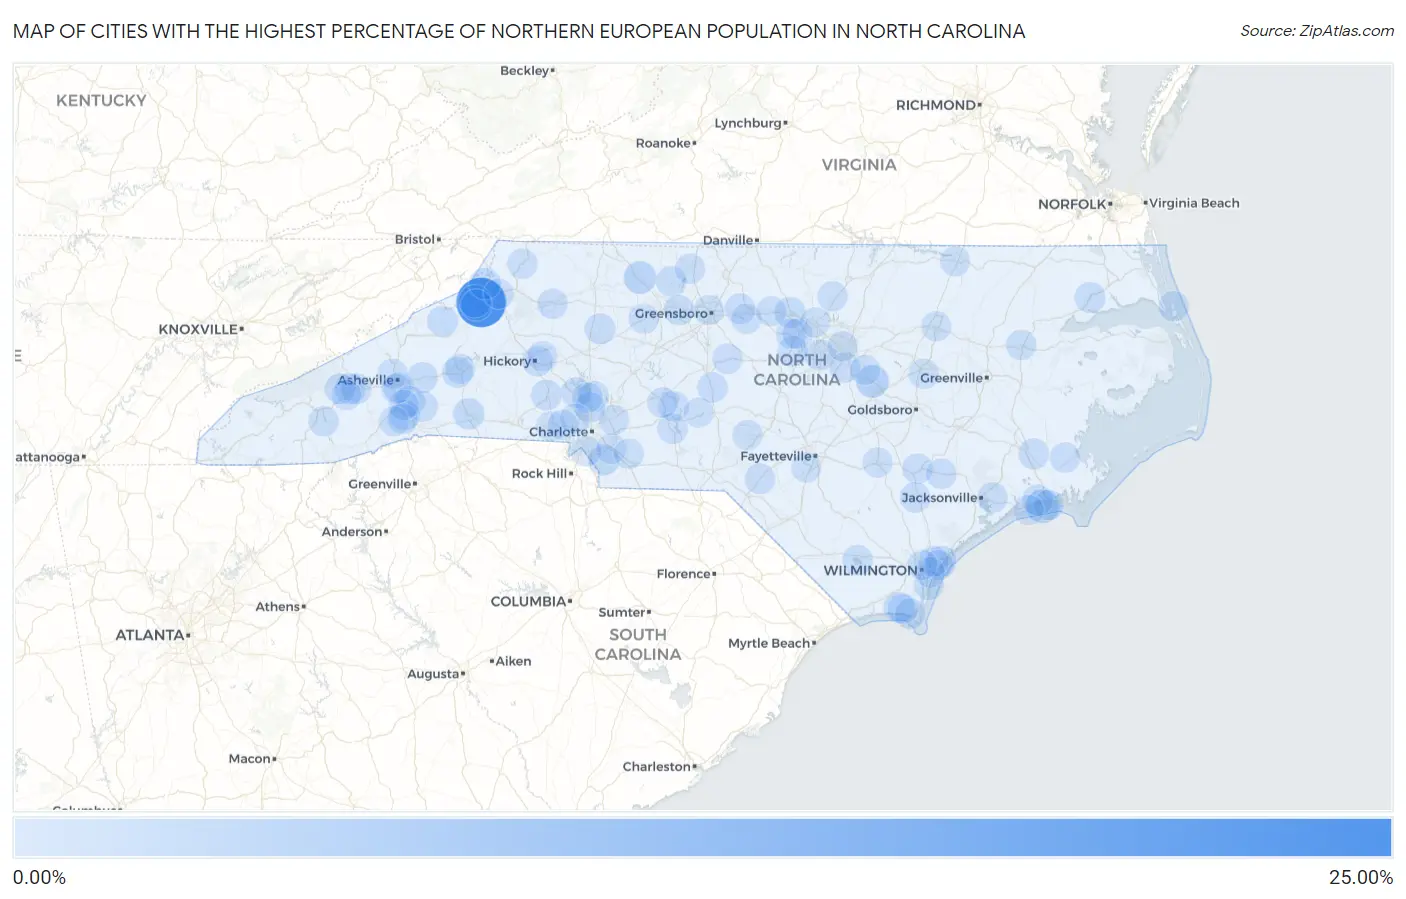
Map of Cities with the Highest Percentage of Northern European Population in North Carolina
0.00%
25.00%
Cities with the Highest Percentage of Northern European Population in North Carolina
| City | Northern European | vs State | vs National | |
| 1. | Seven Devils | 20.14% | 0.11%(+20.0)#1 | 0.15%(+20.0)#16 |
| 2. | Indian Beach | 3.56% | 0.11%(+3.45)#2 | 0.15%(+3.41)#171 |
| 3. | Wilson S Mills | 2.71% | 0.11%(+2.61)#3 | 0.15%(+2.56)#241 |
| 4. | Pinnacle | 2.40% | 0.11%(+2.30)#4 | 0.15%(+2.26)#308 |
| 5. | Banner Elk | 2.35% | 0.11%(+2.24)#5 | 0.15%(+2.20)#322 |
| 6. | Cove Creek | 1.48% | 0.11%(+1.37)#6 | 0.15%(+1.33)#573 |
| 7. | Spindale | 1.23% | 0.11%(+1.13)#7 | 0.15%(+1.09)#707 |
| 8. | Sugar Mountain | 1.23% | 0.11%(+1.12)#8 | 0.15%(+1.08)#709 |
| 9. | Weddington | 0.99% | 0.11%(+0.888)#9 | 0.15%(+0.847)#900 |
| 10. | Grandy | 0.94% | 0.11%(+0.836)#10 | 0.15%(+0.796)#962 |
| 11. | Hertford | 0.93% | 0.11%(+0.822)#11 | 0.15%(+0.782)#980 |
| 12. | Broad Creek | 0.89% | 0.11%(+0.787)#12 | 0.15%(+0.747)#1,025 |
| 13. | Oak Island | 0.86% | 0.11%(+0.757)#13 | 0.15%(+0.717)#1,069 |
| 14. | Bakersville | 0.82% | 0.11%(+0.717)#14 | 0.15%(+0.677)#1,131 |
| 15. | Hillsborough | 0.82% | 0.11%(+0.711)#15 | 0.15%(+0.671)#1,140 |
| 16. | Caswell Beach | 0.82% | 0.11%(+0.711)#16 | 0.15%(+0.671)#1,141 |
| 17. | Porters Neck | 0.73% | 0.11%(+0.619)#17 | 0.15%(+0.578)#1,312 |
| 18. | Harmony | 0.68% | 0.11%(+0.578)#18 | 0.15%(+0.538)#1,418 |
| 19. | Lake Junaluska | 0.67% | 0.11%(+0.565)#19 | 0.15%(+0.524)#1,449 |
| 20. | West Marion | 0.66% | 0.11%(+0.548)#20 | 0.15%(+0.508)#1,484 |
| 21. | Cary | 0.65% | 0.11%(+0.546)#21 | 0.15%(+0.505)#1,491 |
| 22. | Black Mountain | 0.62% | 0.11%(+0.510)#22 | 0.15%(+0.470)#1,589 |
| 23. | Lincolnton | 0.58% | 0.11%(+0.472)#23 | 0.15%(+0.432)#1,706 |
| 24. | Fairfield Harbour | 0.57% | 0.11%(+0.461)#24 | 0.15%(+0.421)#1,734 |
| 25. | Edneyville | 0.57% | 0.11%(+0.459)#25 | 0.15%(+0.418)#1,745 |
| 26. | Clyde | 0.56% | 0.11%(+0.455)#26 | 0.15%(+0.414)#1,756 |
| 27. | Maggie Valley | 0.55% | 0.11%(+0.440)#27 | 0.15%(+0.399)#1,792 |
| 28. | Fearrington Village | 0.54% | 0.11%(+0.435)#28 | 0.15%(+0.395)#1,802 |
| 29. | Kenansville | 0.54% | 0.11%(+0.431)#29 | 0.15%(+0.391)#1,822 |
| 30. | Biltmore Forest | 0.53% | 0.11%(+0.422)#30 | 0.15%(+0.382)#1,850 |
| 31. | Wagram | 0.53% | 0.11%(+0.422)#31 | 0.15%(+0.381)#1,854 |
| 32. | Hoopers Creek | 0.53% | 0.11%(+0.421)#32 | 0.15%(+0.381)#1,857 |
| 33. | Balfour | 0.53% | 0.11%(+0.418)#33 | 0.15%(+0.378)#1,867 |
| 34. | Gibsonville | 0.52% | 0.11%(+0.414)#34 | 0.15%(+0.374)#1,877 |
| 35. | Seagrove | 0.49% | 0.11%(+0.387)#35 | 0.15%(+0.346)#1,977 |
| 36. | Beulaville | 0.49% | 0.11%(+0.380)#36 | 0.15%(+0.339)#2,001 |
| 37. | Westport | 0.48% | 0.11%(+0.374)#37 | 0.15%(+0.334)#2,016 |
| 38. | Carrboro | 0.48% | 0.11%(+0.373)#38 | 0.15%(+0.333)#2,021 |
| 39. | Ramseur | 0.48% | 0.11%(+0.373)#39 | 0.15%(+0.332)#2,023 |
| 40. | Chapel Hill | 0.48% | 0.11%(+0.372)#40 | 0.15%(+0.331)#2,027 |
| 41. | Garner | 0.47% | 0.11%(+0.363)#41 | 0.15%(+0.323)#2,068 |
| 42. | Norwood | 0.41% | 0.11%(+0.306)#42 | 0.15%(+0.266)#2,306 |
| 43. | Wilkesboro | 0.41% | 0.11%(+0.301)#43 | 0.15%(+0.261)#2,338 |
| 44. | Piney Green | 0.39% | 0.11%(+0.286)#44 | 0.15%(+0.245)#2,421 |
| 45. | Badin | 0.39% | 0.11%(+0.279)#45 | 0.15%(+0.238)#2,469 |
| 46. | Hickory | 0.38% | 0.11%(+0.276)#46 | 0.15%(+0.236)#2,495 |
| 47. | Wallace | 0.35% | 0.11%(+0.242)#47 | 0.15%(+0.201)#2,716 |
| 48. | Walnut Cove | 0.35% | 0.11%(+0.238)#48 | 0.15%(+0.198)#2,733 |
| 49. | Laurel Park | 0.34% | 0.11%(+0.237)#49 | 0.15%(+0.197)#2,739 |
| 50. | Pineville | 0.33% | 0.11%(+0.225)#50 | 0.15%(+0.185)#2,810 |
| 51. | Southern Shores | 0.32% | 0.11%(+0.216)#51 | 0.15%(+0.175)#2,884 |
| 52. | Davidson | 0.32% | 0.11%(+0.209)#52 | 0.15%(+0.168)#2,930 |
| 53. | Oriental | 0.31% | 0.11%(+0.203)#53 | 0.15%(+0.163)#2,976 |
| 54. | Spout Springs | 0.31% | 0.11%(+0.201)#54 | 0.15%(+0.161)#2,985 |
| 55. | Kernersville | 0.30% | 0.11%(+0.191)#55 | 0.15%(+0.151)#3,064 |
| 56. | New London | 0.30% | 0.11%(+0.190)#56 | 0.15%(+0.149)#3,073 |
| 57. | Pine Knoll Shores | 0.29% | 0.11%(+0.187)#57 | 0.15%(+0.146)#3,092 |
| 58. | Forest Hills | 0.29% | 0.11%(+0.184)#58 | 0.15%(+0.143)#3,120 |
| 59. | Williamston | 0.29% | 0.11%(+0.180)#59 | 0.15%(+0.140)#3,145 |
| 60. | Huntersville | 0.29% | 0.11%(+0.179)#60 | 0.15%(+0.139)#3,156 |
| 61. | Lake Waccamaw | 0.27% | 0.11%(+0.167)#61 | 0.15%(+0.126)#3,254 |
| 62. | Jefferson | 0.27% | 0.11%(+0.160)#62 | 0.15%(+0.120)#3,306 |
| 63. | Black Creek | 0.26% | 0.11%(+0.157)#63 | 0.15%(+0.117)#3,331 |
| 64. | Alamance | 0.23% | 0.11%(+0.126)#64 | 0.15%(+0.086)#3,590 |
| 65. | Gastonia | 0.23% | 0.11%(+0.123)#65 | 0.15%(+0.082)#3,619 |
| 66. | Stallings | 0.22% | 0.11%(+0.115)#66 | 0.15%(+0.075)#3,693 |
| 67. | Rocky Mount | 0.22% | 0.11%(+0.114)#67 | 0.15%(+0.074)#3,711 |
| 68. | Lowell | 0.22% | 0.11%(+0.110)#68 | 0.15%(+0.069)#3,757 |
| 69. | Myrtle Grove | 0.22% | 0.11%(+0.108)#69 | 0.15%(+0.068)#3,772 |
| 70. | St James | 0.21% | 0.11%(+0.106)#70 | 0.15%(+0.066)#3,800 |
| 71. | Emerald Isle | 0.21% | 0.11%(+0.100)#71 | 0.15%(+0.059)#3,864 |
| 72. | Murraysville | 0.20% | 0.11%(+0.097)#72 | 0.15%(+0.057)#3,892 |
| 73. | Pinehurst | 0.20% | 0.11%(+0.097)#73 | 0.15%(+0.057)#3,893 |
| 74. | Unionville | 0.19% | 0.11%(+0.087)#74 | 0.15%(+0.047)#4,008 |
| 75. | Cornelius | 0.19% | 0.11%(+0.084)#75 | 0.15%(+0.044)#4,048 |
| 76. | Woodfin | 0.19% | 0.11%(+0.083)#76 | 0.15%(+0.043)#4,060 |
| 77. | Fletcher | 0.19% | 0.11%(+0.081)#77 | 0.15%(+0.040)#4,083 |
| 78. | Stem | 0.19% | 0.11%(+0.080)#78 | 0.15%(+0.039)#4,096 |
| 79. | Madison | 0.18% | 0.11%(+0.076)#79 | 0.15%(+0.036)#4,137 |
| 80. | Etowah | 0.17% | 0.11%(+0.062)#80 | 0.15%(+0.022)#4,313 |
| 81. | Clayton | 0.16% | 0.11%(+0.057)#81 | 0.15%(+0.017)#4,366 |
| 82. | Asheville | 0.16% | 0.11%(+0.050)#82 | 0.15%(+0.010)#4,444 |
| 83. | Ogden | 0.15% | 0.11%(+0.043)#83 | 0.15%(+0.002)#4,534 |
| 84. | Harrisburg | 0.15% | 0.11%(+0.041)#84 | 0.15%(+0.001)#4,552 |
| 85. | Wilmington | 0.15% | 0.11%(+0.040)#85 | 0.15%(-0.000)#4,563 |
| 86. | St Stephens | 0.15% | 0.11%(+0.039)#86 | 0.15%(-0.002)#4,581 |
| 87. | Mebane | 0.15% | 0.11%(+0.038)#87 | 0.15%(-0.002)#4,588 |
| 88. | Clinton | 0.14% | 0.11%(+0.037)#88 | 0.15%(-0.004)#4,609 |
| 89. | Raleigh | 0.14% | 0.11%(+0.031)#89 | 0.15%(-0.009)#4,673 |
| 90. | Hightsville | 0.13% | 0.11%(+0.026)#90 | 0.15%(-0.014)#4,736 |
| 91. | Mount Holly | 0.13% | 0.11%(+0.023)#91 | 0.15%(-0.017)#4,776 |
| 92. | Hope Mills | 0.13% | 0.11%(+0.023)#92 | 0.15%(-0.017)#4,779 |
| 93. | Greensboro | 0.12% | 0.11%(+0.014)#93 | 0.15%(-0.027)#4,895 |
| 94. | Boone | 0.12% | 0.11%(+0.012)#94 | 0.15%(-0.029)#4,927 |
| 95. | Waynesville | 0.12% | 0.11%(+0.009)#95 | 0.15%(-0.031)#4,965 |
| 96. | Clemmons | 0.11% | 0.11%(+0.006)#96 | 0.15%(-0.035)#5,012 |
| 97. | Roanoke Rapids | 0.11% | 0.11%(+0.005)#97 | 0.15%(-0.035)#5,022 |
| 98. | Durham | 0.11% | 0.11%(+0.005)#98 | 0.15%(-0.035)#5,029 |
| 99. | Marion | 0.10% | 0.11%(-0.002)#99 | 0.15%(-0.043)#5,138 |
| 100. | Troy | 0.10% | 0.11%(-0.004)#100 | 0.15%(-0.045)#5,162 |
Common Questions
What are the Top 10 Cities with the Highest Percentage of Northern European Population in North Carolina?
Top 10 Cities with the Highest Percentage of Northern European Population in North Carolina are:
#1
20.14%
#2
3.56%
#3
2.71%
#4
2.40%
#5
2.35%
#6
1.48%
#7
1.23%
#8
1.23%
#9
0.99%
#10
0.93%
What city has the Highest Percentage of Northern European Population in North Carolina?
Seven Devils has the Highest Percentage of Northern European Population in North Carolina with 20.14%.
What is the Percentage of Northern European Population in the State of North Carolina?
Percentage of Northern European Population in North Carolina is 0.11%.
What is the Percentage of Northern European Population in the United States?
Percentage of Northern European Population in the United States is 0.15%.