Cities with the Highest Percentage of Northern European Population in Ohio
RELATED REPORTS & OPTIONS
Northern European
Ohio
Compare Cities
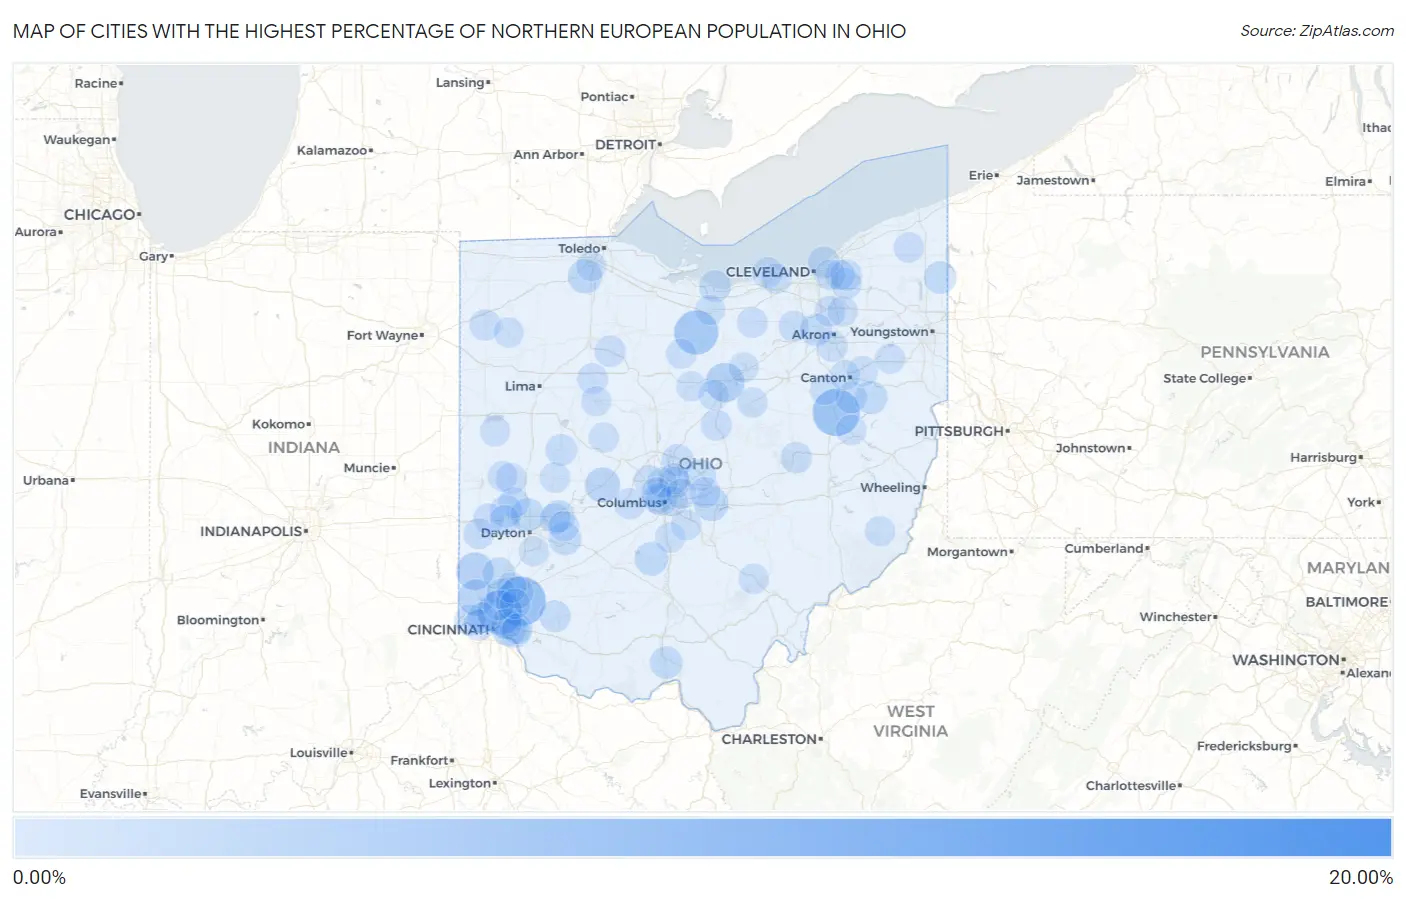
Map of Cities with the Highest Percentage of Northern European Population in Ohio
0.00%
20.00%
Cities with the Highest Percentage of Northern European Population in Ohio
| City | Northern European | vs State | vs National | |
| 1. | Jersey | 16.52% | 0.096%(+16.4)#1 | 0.15%(+16.4)#25 |
| 2. | Loveland Park | 6.03% | 0.096%(+5.93)#2 | 0.15%(+5.88)#87 |
| 3. | Parral | 5.38% | 0.096%(+5.28)#3 | 0.15%(+5.23)#96 |
| 4. | Arlington Heights | 4.52% | 0.096%(+4.43)#4 | 0.15%(+4.38)#126 |
| 5. | Holiday Lakes | 4.43% | 0.096%(+4.33)#5 | 0.15%(+4.28)#130 |
| 6. | North Industry | 3.42% | 0.096%(+3.32)#6 | 0.15%(+3.27)#182 |
| 7. | Lincoln Heights | 2.91% | 0.096%(+2.81)#7 | 0.15%(+2.76)#212 |
| 8. | Hamburg | 2.88% | 0.096%(+2.78)#8 | 0.15%(+2.73)#215 |
| 9. | Darrtown | 2.50% | 0.096%(+2.41)#9 | 0.15%(+2.36)#287 |
| 10. | Ross | 2.13% | 0.096%(+2.03)#10 | 0.15%(+1.98)#362 |
| 11. | Mechanicsburg | 1.77% | 0.096%(+1.68)#11 | 0.15%(+1.63)#449 |
| 12. | Turpin Hills | 1.63% | 0.096%(+1.53)#12 | 0.15%(+1.48)#510 |
| 13. | Kirkersville | 1.62% | 0.096%(+1.52)#13 | 0.15%(+1.47)#514 |
| 14. | Haskins | 1.52% | 0.096%(+1.42)#14 | 0.15%(+1.37)#558 |
| 15. | Vandalia | 1.37% | 0.096%(+1.27)#15 | 0.15%(+1.22)#630 |
| 16. | Williamsport | 1.36% | 0.096%(+1.26)#16 | 0.15%(+1.21)#634 |
| 17. | Wilberforce | 1.10% | 0.096%(+0.999)#17 | 0.15%(+0.949)#808 |
| 18. | Lake Mohawk | 1.09% | 0.096%(+0.989)#18 | 0.15%(+0.938)#819 |
| 19. | Phillipsburg | 1.01% | 0.096%(+0.909)#19 | 0.15%(+0.858)#886 |
| 20. | Trenton | 0.99% | 0.096%(+0.893)#20 | 0.15%(+0.843)#907 |
| 21. | Pigeon Creek | 0.99% | 0.096%(+0.890)#21 | 0.15%(+0.839)#912 |
| 22. | Kinsman Center | 0.97% | 0.096%(+0.878)#22 | 0.15%(+0.827)#928 |
| 23. | Lucasville | 0.97% | 0.096%(+0.877)#23 | 0.15%(+0.826)#929 |
| 24. | Enon | 0.92% | 0.096%(+0.820)#24 | 0.15%(+0.769)#998 |
| 25. | Huron | 0.81% | 0.096%(+0.717)#25 | 0.15%(+0.666)#1,149 |
| 26. | Mason | 0.78% | 0.096%(+0.686)#26 | 0.15%(+0.635)#1,200 |
| 27. | Bratenahl | 0.77% | 0.096%(+0.677)#27 | 0.15%(+0.626)#1,210 |
| 28. | Sunbury | 0.76% | 0.096%(+0.668)#28 | 0.15%(+0.617)#1,228 |
| 29. | Johnstown | 0.75% | 0.096%(+0.656)#29 | 0.15%(+0.605)#1,249 |
| 30. | De Graff | 0.72% | 0.096%(+0.628)#30 | 0.15%(+0.577)#1,315 |
| 31. | East Sparta | 0.70% | 0.096%(+0.606)#31 | 0.15%(+0.555)#1,373 |
| 32. | Lake Lorelei | 0.70% | 0.096%(+0.603)#32 | 0.15%(+0.553)#1,384 |
| 33. | West Jefferson | 0.65% | 0.096%(+0.549)#33 | 0.15%(+0.498)#1,509 |
| 34. | Hunting Valley | 0.63% | 0.096%(+0.529)#34 | 0.15%(+0.478)#1,567 |
| 35. | Covington | 0.62% | 0.096%(+0.528)#35 | 0.15%(+0.477)#1,569 |
| 36. | Vanlue | 0.62% | 0.096%(+0.523)#36 | 0.15%(+0.472)#1,585 |
| 37. | Miami Heights | 0.61% | 0.096%(+0.514)#37 | 0.15%(+0.463)#1,608 |
| 38. | Coshocton | 0.61% | 0.096%(+0.510)#38 | 0.15%(+0.459)#1,622 |
| 39. | Paulding | 0.60% | 0.096%(+0.508)#39 | 0.15%(+0.457)#1,627 |
| 40. | Covedale | 0.59% | 0.096%(+0.495)#40 | 0.15%(+0.444)#1,674 |
| 41. | Grandview Heights | 0.57% | 0.096%(+0.473)#41 | 0.15%(+0.422)#1,732 |
| 42. | Fredericktown | 0.57% | 0.096%(+0.471)#42 | 0.15%(+0.420)#1,737 |
| 43. | Huber Ridge | 0.56% | 0.096%(+0.461)#43 | 0.15%(+0.411)#1,768 |
| 44. | West Milton | 0.55% | 0.096%(+0.455)#44 | 0.15%(+0.404)#1,783 |
| 45. | Beechwood Trails | 0.55% | 0.096%(+0.454)#45 | 0.15%(+0.403)#1,785 |
| 46. | Holiday Valley | 0.53% | 0.096%(+0.432)#46 | 0.15%(+0.381)#1,858 |
| 47. | Cherry Grove | 0.53% | 0.096%(+0.431)#47 | 0.15%(+0.380)#1,862 |
| 48. | Portage Lakes | 0.51% | 0.096%(+0.417)#48 | 0.15%(+0.366)#1,907 |
| 49. | Sheffield Lake | 0.50% | 0.096%(+0.406)#49 | 0.15%(+0.355)#1,948 |
| 50. | Dunkirk | 0.49% | 0.096%(+0.396)#50 | 0.15%(+0.345)#1,985 |
| 51. | Westerville | 0.49% | 0.096%(+0.394)#51 | 0.15%(+0.344)#1,990 |
| 52. | Fairfax | 0.48% | 0.096%(+0.385)#52 | 0.15%(+0.334)#2,014 |
| 53. | Peninsula | 0.47% | 0.096%(+0.378)#53 | 0.15%(+0.327)#2,048 |
| 54. | Medina | 0.46% | 0.096%(+0.363)#54 | 0.15%(+0.313)#2,103 |
| 55. | Lewisburg | 0.43% | 0.096%(+0.338)#55 | 0.15%(+0.287)#2,207 |
| 56. | Eaton | 0.43% | 0.096%(+0.334)#56 | 0.15%(+0.283)#2,221 |
| 57. | Bentleyville | 0.43% | 0.096%(+0.333)#57 | 0.15%(+0.282)#2,227 |
| 58. | Monfort Heights | 0.42% | 0.096%(+0.328)#58 | 0.15%(+0.277)#2,247 |
| 59. | Rock Creek | 0.42% | 0.096%(+0.320)#59 | 0.15%(+0.269)#2,290 |
| 60. | Wellington | 0.41% | 0.096%(+0.318)#60 | 0.15%(+0.268)#2,299 |
| 61. | Mount Carmel | 0.41% | 0.096%(+0.310)#61 | 0.15%(+0.259)#2,347 |
| 62. | Marble Cliff | 0.40% | 0.096%(+0.300)#62 | 0.15%(+0.249)#2,401 |
| 63. | Ashville | 0.39% | 0.096%(+0.297)#63 | 0.15%(+0.246)#2,418 |
| 64. | Louisville | 0.39% | 0.096%(+0.293)#64 | 0.15%(+0.242)#2,445 |
| 65. | Lexington | 0.38% | 0.096%(+0.287)#65 | 0.15%(+0.236)#2,489 |
| 66. | Shaker Heights | 0.38% | 0.096%(+0.281)#66 | 0.15%(+0.230)#2,530 |
| 67. | Lithopolis | 0.37% | 0.096%(+0.279)#67 | 0.15%(+0.228)#2,541 |
| 68. | Yellow Springs | 0.37% | 0.096%(+0.278)#68 | 0.15%(+0.227)#2,543 |
| 69. | St Paris | 0.37% | 0.096%(+0.278)#69 | 0.15%(+0.227)#2,545 |
| 70. | Glendale | 0.37% | 0.096%(+0.275)#70 | 0.15%(+0.224)#2,563 |
| 71. | Avon | 0.37% | 0.096%(+0.270)#71 | 0.15%(+0.219)#2,588 |
| 72. | Meyers Lake | 0.36% | 0.096%(+0.262)#72 | 0.15%(+0.211)#2,647 |
| 73. | Loudonville | 0.35% | 0.096%(+0.249)#73 | 0.15%(+0.198)#2,734 |
| 74. | West Mansfield | 0.34% | 0.096%(+0.244)#74 | 0.15%(+0.193)#2,760 |
| 75. | Bexley | 0.34% | 0.096%(+0.243)#75 | 0.15%(+0.192)#2,764 |
| 76. | Beckett Ridge | 0.33% | 0.096%(+0.238)#76 | 0.15%(+0.187)#2,801 |
| 77. | New Washington | 0.33% | 0.096%(+0.237)#77 | 0.15%(+0.186)#2,804 |
| 78. | Barnhill | 0.33% | 0.096%(+0.236)#78 | 0.15%(+0.185)#2,808 |
| 79. | Chickasaw | 0.33% | 0.096%(+0.235)#79 | 0.15%(+0.184)#2,821 |
| 80. | Pepper Pike | 0.32% | 0.096%(+0.228)#80 | 0.15%(+0.177)#2,868 |
| 81. | Bradford | 0.32% | 0.096%(+0.227)#81 | 0.15%(+0.176)#2,878 |
| 82. | Centerville | 0.32% | 0.096%(+0.222)#82 | 0.15%(+0.171)#2,915 |
| 83. | Worthington | 0.31% | 0.096%(+0.217)#83 | 0.15%(+0.166)#2,946 |
| 84. | Four Bridges | 0.31% | 0.096%(+0.217)#84 | 0.15%(+0.166)#2,949 |
| 85. | Dublin | 0.31% | 0.096%(+0.210)#85 | 0.15%(+0.159)#3,000 |
| 86. | Nelsonville | 0.30% | 0.096%(+0.208)#86 | 0.15%(+0.157)#3,011 |
| 87. | Woodsfield | 0.30% | 0.096%(+0.205)#87 | 0.15%(+0.154)#3,030 |
| 88. | Hudson | 0.30% | 0.096%(+0.204)#88 | 0.15%(+0.153)#3,040 |
| 89. | Sixteen Mile Stand | 0.30% | 0.096%(+0.203)#89 | 0.15%(+0.152)#3,051 |
| 90. | Galion | 0.30% | 0.096%(+0.202)#90 | 0.15%(+0.151)#3,055 |
| 91. | Ashland | 0.30% | 0.096%(+0.199)#91 | 0.15%(+0.148)#3,077 |
| 92. | Oakwood | 0.29% | 0.096%(+0.198)#92 | 0.15%(+0.148)#3,081 |
| 93. | Upper Arlington | 0.29% | 0.096%(+0.194)#93 | 0.15%(+0.143)#3,121 |
| 94. | Sebring | 0.29% | 0.096%(+0.190)#94 | 0.15%(+0.139)#3,148 |
| 95. | Brewster | 0.29% | 0.096%(+0.190)#95 | 0.15%(+0.139)#3,152 |
| 96. | Kenton | 0.29% | 0.096%(+0.190)#96 | 0.15%(+0.139)#3,154 |
| 97. | Brookville | 0.28% | 0.096%(+0.185)#97 | 0.15%(+0.134)#3,196 |
| 98. | Norwalk | 0.28% | 0.096%(+0.185)#98 | 0.15%(+0.134)#3,197 |
| 99. | Perrysburg | 0.28% | 0.096%(+0.185)#99 | 0.15%(+0.134)#3,198 |
| 100. | Gahanna | 0.28% | 0.096%(+0.182)#100 | 0.15%(+0.131)#3,222 |
Common Questions
What are the Top 10 Cities with the Highest Percentage of Northern European Population in Ohio?
Top 10 Cities with the Highest Percentage of Northern European Population in Ohio are:
#1
6.03%
#2
5.38%
#3
4.52%
#4
4.43%
#5
2.91%
#6
2.50%
#7
2.13%
#8
1.77%
#9
1.63%
#10
1.62%
What city has the Highest Percentage of Northern European Population in Ohio?
Loveland Park has the Highest Percentage of Northern European Population in Ohio with 6.03%.
What is the Percentage of Northern European Population in the State of Ohio?
Percentage of Northern European Population in Ohio is 0.096%.
What is the Percentage of Northern European Population in the United States?
Percentage of Northern European Population in the United States is 0.15%.