Cities with the Highest Percentage of Northern European Population in Illinois
RELATED REPORTS & OPTIONS
Northern European
Illinois
Compare Cities
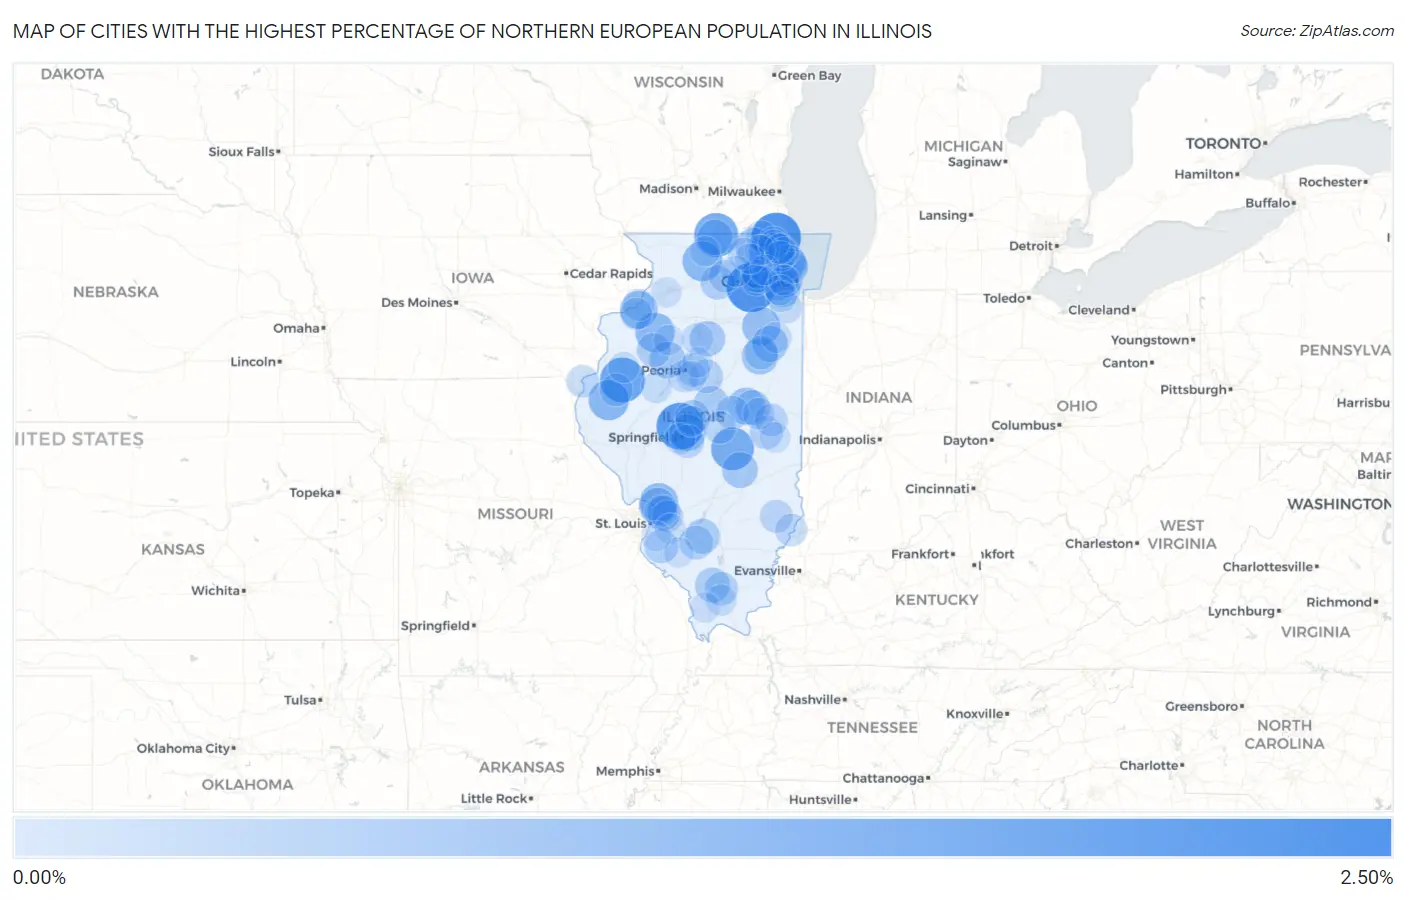
Map of Cities with the Highest Percentage of Northern European Population in Illinois
0.00%
2.50%
Cities with the Highest Percentage of Northern European Population in Illinois
| City | Northern European | vs State | vs National | |
| 1. | Old Mill Creek | 2.46% | 0.11%(+2.35)#1 | 0.15%(+2.31)#295 |
| 2. | Prestbury | 2.43% | 0.11%(+2.32)#2 | 0.15%(+2.28)#300 |
| 3. | Cantrall | 2.16% | 0.11%(+2.05)#3 | 0.15%(+2.01)#355 |
| 4. | Good Hope | 1.92% | 0.11%(+1.81)#4 | 0.15%(+1.78)#406 |
| 5. | South Beloit | 1.84% | 0.11%(+1.73)#5 | 0.15%(+1.69)#432 |
| 6. | Bethany | 1.71% | 0.11%(+1.60)#6 | 0.15%(+1.56)#468 |
| 7. | Campbell's Island | 1.68% | 0.11%(+1.57)#7 | 0.15%(+1.53)#485 |
| 8. | Plymouth | 1.43% | 0.11%(+1.32)#8 | 0.15%(+1.28)#596 |
| 9. | Byron | 1.39% | 0.11%(+1.28)#9 | 0.15%(+1.24)#616 |
| 10. | Bishop Hill | 1.32% | 0.11%(+1.21)#10 | 0.15%(+1.18)#659 |
| 11. | Bethalto | 1.26% | 0.11%(+1.15)#11 | 0.15%(+1.11)#695 |
| 12. | Diamond | 1.19% | 0.11%(+1.08)#12 | 0.15%(+1.04)#731 |
| 13. | Carbon Cliff | 1.14% | 0.11%(+1.03)#13 | 0.15%(+0.996)#765 |
| 14. | Mansfield | 1.10% | 0.11%(+0.988)#14 | 0.15%(+0.952)#804 |
| 15. | Wood River | 1.05% | 0.11%(+0.936)#15 | 0.15%(+0.900)#850 |
| 16. | Bull Valley | 1.04% | 0.11%(+0.931)#16 | 0.15%(+0.894)#854 |
| 17. | Spaulding | 1.04% | 0.11%(+0.925)#17 | 0.15%(+0.889)#859 |
| 18. | Cullom | 1.01% | 0.11%(+0.899)#18 | 0.15%(+0.863)#880 |
| 19. | Brimfield | 1.01% | 0.11%(+0.896)#19 | 0.15%(+0.860)#884 |
| 20. | Countryside | 0.96% | 0.11%(+0.854)#20 | 0.15%(+0.818)#939 |
| 21. | Herscher | 0.96% | 0.11%(+0.847)#21 | 0.15%(+0.810)#947 |
| 22. | Glen Carbon | 0.94% | 0.11%(+0.834)#22 | 0.15%(+0.797)#960 |
| 23. | Wayne | 0.94% | 0.11%(+0.833)#23 | 0.15%(+0.796)#961 |
| 24. | Strasburg | 0.93% | 0.11%(+0.823)#24 | 0.15%(+0.787)#969 |
| 25. | Rockton | 0.92% | 0.11%(+0.811)#25 | 0.15%(+0.775)#991 |
| 26. | River Forest | 0.92% | 0.11%(+0.805)#26 | 0.15%(+0.769)#1,000 |
| 27. | Magnolia | 0.89% | 0.11%(+0.782)#27 | 0.15%(+0.746)#1,032 |
| 28. | Tower Lakes | 0.86% | 0.11%(+0.747)#28 | 0.15%(+0.711)#1,079 |
| 29. | Waynesville | 0.86% | 0.11%(+0.745)#29 | 0.15%(+0.709)#1,081 |
| 30. | Hoyleton | 0.85% | 0.11%(+0.735)#30 | 0.15%(+0.698)#1,095 |
| 31. | Libertyville | 0.84% | 0.11%(+0.731)#31 | 0.15%(+0.694)#1,100 |
| 32. | Carterville | 0.84% | 0.11%(+0.729)#32 | 0.15%(+0.692)#1,105 |
| 33. | Mahomet | 0.84% | 0.11%(+0.727)#33 | 0.15%(+0.691)#1,109 |
| 34. | Broadwell | 0.83% | 0.11%(+0.722)#34 | 0.15%(+0.686)#1,118 |
| 35. | Steward | 0.76% | 0.11%(+0.652)#35 | 0.15%(+0.616)#1,231 |
| 36. | Oak Run | 0.74% | 0.11%(+0.632)#36 | 0.15%(+0.596)#1,267 |
| 37. | Hecker | 0.74% | 0.11%(+0.630)#37 | 0.15%(+0.593)#1,272 |
| 38. | Oak Brook | 0.73% | 0.11%(+0.620)#38 | 0.15%(+0.584)#1,297 |
| 39. | Nashville | 0.73% | 0.11%(+0.616)#39 | 0.15%(+0.580)#1,307 |
| 40. | Winnetka | 0.72% | 0.11%(+0.611)#40 | 0.15%(+0.574)#1,325 |
| 41. | Glencoe | 0.72% | 0.11%(+0.606)#41 | 0.15%(+0.570)#1,337 |
| 42. | Kempton | 0.71% | 0.11%(+0.603)#42 | 0.15%(+0.567)#1,348 |
| 43. | Congerville | 0.70% | 0.11%(+0.593)#43 | 0.15%(+0.557)#1,368 |
| 44. | Marion | 0.69% | 0.11%(+0.577)#44 | 0.15%(+0.540)#1,408 |
| 45. | Weldon | 0.67% | 0.11%(+0.560)#45 | 0.15%(+0.524)#1,450 |
| 46. | Kenilworth | 0.67% | 0.11%(+0.559)#46 | 0.15%(+0.523)#1,452 |
| 47. | Rochester | 0.67% | 0.11%(+0.555)#47 | 0.15%(+0.519)#1,456 |
| 48. | Villa Grove | 0.66% | 0.11%(+0.551)#48 | 0.15%(+0.514)#1,469 |
| 49. | Washington | 0.64% | 0.11%(+0.533)#49 | 0.15%(+0.497)#1,512 |
| 50. | Claremont | 0.63% | 0.11%(+0.518)#50 | 0.15%(+0.482)#1,560 |
| 51. | Colchester | 0.63% | 0.11%(+0.514)#51 | 0.15%(+0.478)#1,566 |
| 52. | Sidney | 0.61% | 0.11%(+0.501)#52 | 0.15%(+0.465)#1,604 |
| 53. | St Charles | 0.60% | 0.11%(+0.493)#53 | 0.15%(+0.457)#1,629 |
| 54. | Malta | 0.59% | 0.11%(+0.475)#54 | 0.15%(+0.439)#1,686 |
| 55. | Nauvoo | 0.58% | 0.11%(+0.470)#55 | 0.15%(+0.433)#1,702 |
| 56. | Allendale | 0.58% | 0.11%(+0.465)#56 | 0.15%(+0.428)#1,717 |
| 57. | Forsyth | 0.57% | 0.11%(+0.459)#57 | 0.15%(+0.423)#1,726 |
| 58. | South Elgin | 0.56% | 0.11%(+0.451)#58 | 0.15%(+0.415)#1,755 |
| 59. | Hampton | 0.53% | 0.11%(+0.422)#59 | 0.15%(+0.386)#1,837 |
| 60. | Coal Valley | 0.53% | 0.11%(+0.419)#60 | 0.15%(+0.383)#1,846 |
| 61. | Forest Park | 0.53% | 0.11%(+0.418)#61 | 0.15%(+0.382)#1,849 |
| 62. | Union | 0.53% | 0.11%(+0.417)#62 | 0.15%(+0.381)#1,856 |
| 63. | Marquette Heights | 0.52% | 0.11%(+0.413)#63 | 0.15%(+0.377)#1,871 |
| 64. | Champaign | 0.51% | 0.11%(+0.394)#64 | 0.15%(+0.358)#1,931 |
| 65. | Troy | 0.50% | 0.11%(+0.393)#65 | 0.15%(+0.356)#1,943 |
| 66. | Evanston | 0.49% | 0.11%(+0.384)#66 | 0.15%(+0.348)#1,974 |
| 67. | Third Lake | 0.49% | 0.11%(+0.383)#67 | 0.15%(+0.347)#1,976 |
| 68. | Frankfort Square | 0.49% | 0.11%(+0.380)#68 | 0.15%(+0.344)#1,989 |
| 69. | Henry | 0.49% | 0.11%(+0.375)#69 | 0.15%(+0.338)#2,003 |
| 70. | Palos Park | 0.48% | 0.11%(+0.365)#70 | 0.15%(+0.328)#2,042 |
| 71. | Spring Grove | 0.46% | 0.11%(+0.346)#71 | 0.15%(+0.309)#2,109 |
| 72. | Jerome | 0.46% | 0.11%(+0.345)#72 | 0.15%(+0.308)#2,112 |
| 73. | Bryant | 0.44% | 0.11%(+0.333)#73 | 0.15%(+0.297)#2,161 |
| 74. | Goreville | 0.44% | 0.11%(+0.325)#74 | 0.15%(+0.289)#2,197 |
| 75. | Geneva | 0.43% | 0.11%(+0.324)#75 | 0.15%(+0.287)#2,203 |
| 76. | Roseville | 0.43% | 0.11%(+0.321)#76 | 0.15%(+0.285)#2,211 |
| 77. | Sycamore | 0.42% | 0.11%(+0.313)#77 | 0.15%(+0.276)#2,252 |
| 78. | Elkhart | 0.41% | 0.11%(+0.299)#78 | 0.15%(+0.263)#2,329 |
| 79. | Limestone | 0.41% | 0.11%(+0.295)#79 | 0.15%(+0.258)#2,350 |
| 80. | Island Lake | 0.40% | 0.11%(+0.287)#80 | 0.15%(+0.251)#2,390 |
| 81. | Grayslake | 0.39% | 0.11%(+0.283)#81 | 0.15%(+0.247)#2,413 |
| 82. | Lake Forest | 0.39% | 0.11%(+0.280)#82 | 0.15%(+0.244)#2,430 |
| 83. | Newman | 0.38% | 0.11%(+0.274)#83 | 0.15%(+0.237)#2,475 |
| 84. | Edwardsville | 0.38% | 0.11%(+0.272)#84 | 0.15%(+0.236)#2,491 |
| 85. | Lincolnshire | 0.38% | 0.11%(+0.268)#85 | 0.15%(+0.232)#2,520 |
| 86. | Maywood | 0.38% | 0.11%(+0.265)#86 | 0.15%(+0.229)#2,533 |
| 87. | Anna | 0.38% | 0.11%(+0.265)#87 | 0.15%(+0.228)#2,535 |
| 88. | Morton | 0.37% | 0.11%(+0.262)#88 | 0.15%(+0.226)#2,550 |
| 89. | Scott Afb | 0.37% | 0.11%(+0.262)#89 | 0.15%(+0.226)#2,557 |
| 90. | Toulon | 0.37% | 0.11%(+0.254)#90 | 0.15%(+0.218)#2,596 |
| 91. | Tilden | 0.36% | 0.11%(+0.253)#91 | 0.15%(+0.217)#2,611 |
| 92. | Streamwood | 0.36% | 0.11%(+0.253)#92 | 0.15%(+0.217)#2,612 |
| 93. | Burr Ridge | 0.36% | 0.11%(+0.248)#93 | 0.15%(+0.212)#2,635 |
| 94. | Lyndon | 0.36% | 0.11%(+0.245)#94 | 0.15%(+0.209)#2,657 |
| 95. | Prairie Grove | 0.36% | 0.11%(+0.245)#95 | 0.15%(+0.209)#2,664 |
| 96. | Huntley | 0.35% | 0.11%(+0.240)#96 | 0.15%(+0.203)#2,701 |
| 97. | Millstadt | 0.35% | 0.11%(+0.236)#97 | 0.15%(+0.200)#2,723 |
| 98. | Metamora | 0.34% | 0.11%(+0.233)#98 | 0.15%(+0.197)#2,737 |
| 99. | Green Oaks | 0.34% | 0.11%(+0.231)#99 | 0.15%(+0.194)#2,751 |
| 100. | Winnebago | 0.33% | 0.11%(+0.222)#100 | 0.15%(+0.186)#2,807 |
Common Questions
What are the Top 10 Cities with the Highest Percentage of Northern European Population in Illinois?
Top 10 Cities with the Highest Percentage of Northern European Population in Illinois are:
#1
2.46%
#2
2.43%
#3
2.16%
#4
1.92%
#5
1.84%
#6
1.71%
#7
1.43%
#8
1.39%
#9
1.32%
#10
1.26%
What city has the Highest Percentage of Northern European Population in Illinois?
Old Mill Creek has the Highest Percentage of Northern European Population in Illinois with 2.46%.
What is the Percentage of Northern European Population in the State of Illinois?
Percentage of Northern European Population in Illinois is 0.11%.
What is the Percentage of Northern European Population in the United States?
Percentage of Northern European Population in the United States is 0.15%.