Cities with the Highest Percentage of Northern European Population in Virginia
RELATED REPORTS & OPTIONS
Northern European
Virginia
Compare Cities
Map of Cities with the Highest Percentage of Northern European Population in Virginia
0.00%
30.00%
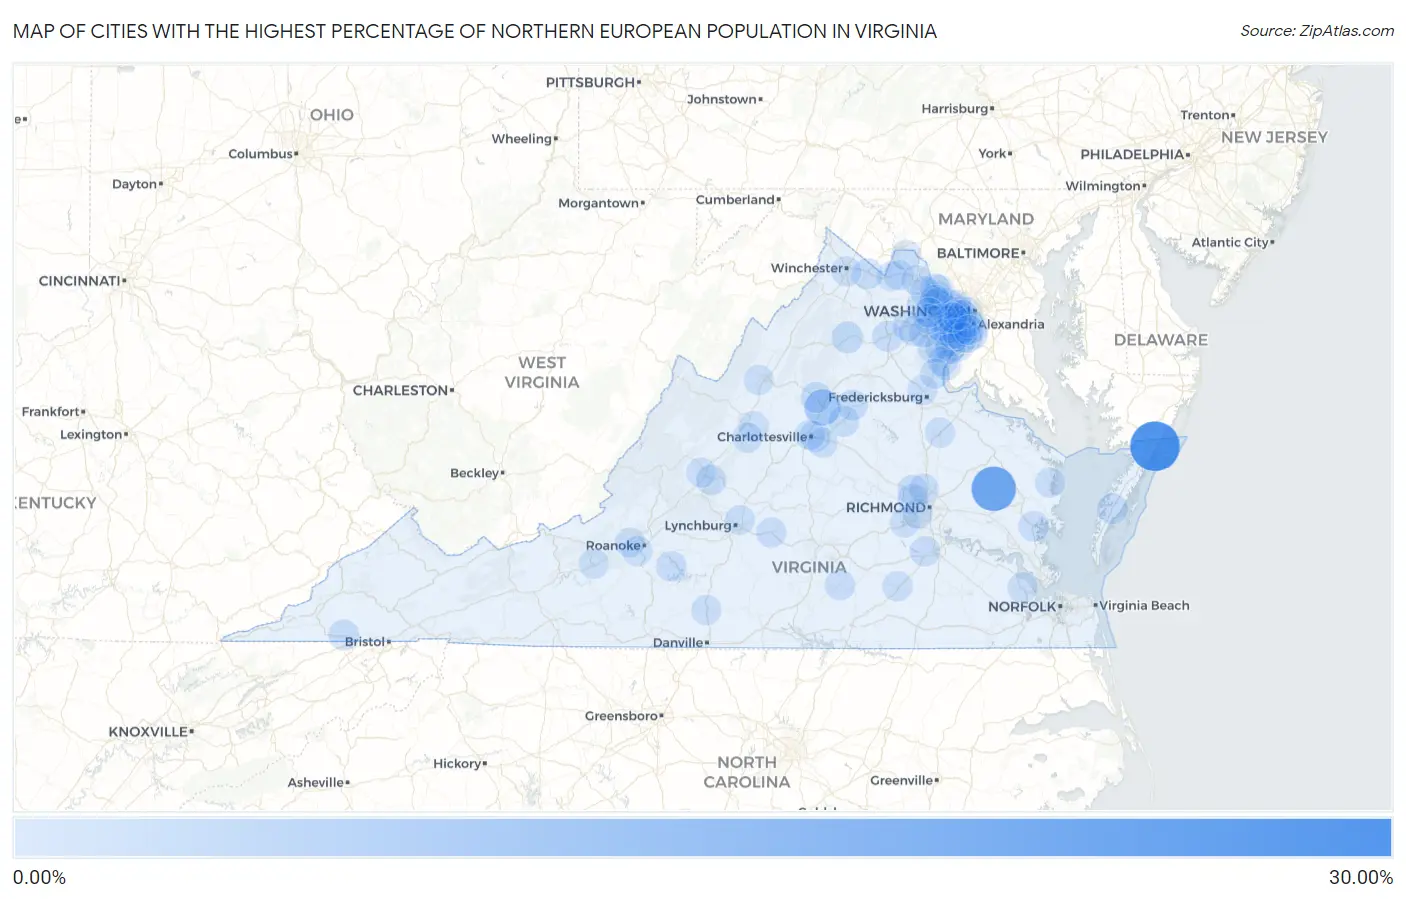
Cities with the Highest Percentage of Northern European Population in Virginia
| City | Northern European | vs State | vs National | |
| 1. | Horntown | 26.05% | 0.16% (+25.9)#1 | 0.15% (+25.9)#12 |
| 2. | King And Queen Court House | 19.05% | 0.16% (+18.9)#2 | 0.15% (+18.9)#17 |
| 3. | Osaka | 13.73% | 0.16% (+13.6)#3 | 0.15% (+13.6)#34 |
| 4. | Innovation | 10.22% | 0.16% (+10.1)#4 | 0.15% (+10.1)#46 |
| 5. | Ruckersville | 7.69% | 0.16% (+7.53)#5 | 0.15% (+7.54)#66 |
| 6. | Stewartsville | 2.33% | 0.16% (+2.18)#6 | 0.15% (+2.19)#325 |
| 7. | Washington | 1.85% | 0.16% (+1.69)#7 | 0.15% (+1.70)#425 |
| 8. | Difficult Run | 1.38% | 0.16% (+1.22)#8 | 0.15% (+1.23)#625 |
| 9. | Pantops | 1.24% | 0.16% (+1.08)#9 | 0.15% (+1.09)#703 |
| 10. | Gordonsville | 1.18% | 0.16% (+1.02)#10 | 0.15% (+1.03)#736 |
| 11. | Warrenton | 1.02% | 0.16% (+0.861)#11 | 0.15% (+0.871)#875 |
| 12. | Stanardsville | 1.02% | 0.16% (+0.858)#12 | 0.15% (+0.869)#877 |
| 13. | Mason Neck | 0.98% | 0.16% (+0.825)#13 | 0.15% (+0.836)#916 |
| 14. | Orange | 0.98% | 0.16% (+0.818)#14 | 0.15% (+0.828)#925 |
| 15. | Fort Hunt | 0.96% | 0.16% (+0.804)#15 | 0.15% (+0.815)#943 |
| 16. | Gate City | 0.94% | 0.16% (+0.784)#16 | 0.15% (+0.795)#964 |
| 17. | Berryville | 0.94% | 0.16% (+0.777)#17 | 0.15% (+0.788)#967 |
| 18. | Kings Park | 0.87% | 0.16% (+0.716)#18 | 0.15% (+0.727)#1,056 |
| 19. | Exmore | 0.86% | 0.16% (+0.702)#19 | 0.15% (+0.713)#1,075 |
| 20. | Earlysville | 0.85% | 0.16% (+0.688)#20 | 0.15% (+0.699)#1,094 |
| 21. | Occoquan | 0.84% | 0.16% (+0.681)#21 | 0.15% (+0.692)#1,106 |
| 22. | Braddock | 0.83% | 0.16% (+0.675)#22 | 0.15% (+0.686)#1,115 |
| 23. | Westlake Corner | 0.83% | 0.16% (+0.668)#23 | 0.15% (+0.679)#1,129 |
| 24. | Independent Hill | 0.80% | 0.16% (+0.643)#24 | 0.15% (+0.654)#1,176 |
| 25. | Gloucester Courthouse | 0.80% | 0.16% (+0.639)#25 | 0.15% (+0.650)#1,183 |
| 26. | Mount Vernon | 0.77% | 0.16% (+0.616)#26 | 0.15% (+0.627)#1,207 |
| 27. | Falls Church | 0.74% | 0.16% (+0.583)#27 | 0.15% (+0.594)#1,269 |
| 28. | Mantua | 0.70% | 0.16% (+0.546)#28 | 0.15% (+0.556)#1,369 |
| 29. | Fair Lakes | 0.70% | 0.16% (+0.537)#29 | 0.15% (+0.548)#1,394 |
| 30. | Fairfax Station | 0.69% | 0.16% (+0.534)#30 | 0.15% (+0.545)#1,400 |
| 31. | Matoaca | 0.67% | 0.16% (+0.516)#31 | 0.15% (+0.527)#1,444 |
| 32. | Long Branch | 0.67% | 0.16% (+0.510)#32 | 0.15% (+0.521)#1,454 |
| 33. | Belle Haven | 0.66% | 0.16% (+0.502)#33 | 0.15% (+0.513)#1,474 |
| 34. | Ravensworth | 0.64% | 0.16% (+0.481)#34 | 0.15% (+0.492)#1,533 |
| 35. | South Run | 0.62% | 0.16% (+0.461)#35 | 0.15% (+0.472)#1,581 |
| 36. | West Springfield | 0.60% | 0.16% (+0.445)#36 | 0.15% (+0.456)#1,640 |
| 37. | Hayfield | 0.59% | 0.16% (+0.434)#37 | 0.15% (+0.445)#1,671 |
| 38. | Burke | 0.59% | 0.16% (+0.430)#38 | 0.15% (+0.441)#1,683 |
| 39. | Wolf Trap | 0.57% | 0.16% (+0.408)#39 | 0.15% (+0.419)#1,742 |
| 40. | Buena Vista | 0.53% | 0.16% (+0.369)#40 | 0.15% (+0.380)#1,863 |
| 41. | Dranesville | 0.51% | 0.16% (+0.352)#41 | 0.15% (+0.363)#1,917 |
| 42. | Floris | 0.50% | 0.16% (+0.341)#42 | 0.15% (+0.352)#1,957 |
| 43. | Gainesville | 0.48% | 0.16% (+0.319)#43 | 0.15% (+0.330)#2,036 |
| 44. | Appomattox | 0.46% | 0.16% (+0.305)#44 | 0.15% (+0.316)#2,086 |
| 45. | Lowes Island | 0.44% | 0.16% (+0.286)#45 | 0.15% (+0.297)#2,164 |
| 46. | Pimmit Hills | 0.43% | 0.16% (+0.273)#46 | 0.15% (+0.283)#2,219 |
| 47. | Innsbrook | 0.43% | 0.16% (+0.267)#47 | 0.15% (+0.278)#2,244 |
| 48. | Victoria | 0.41% | 0.16% (+0.253)#48 | 0.15% (+0.264)#2,317 |
| 49. | Bowling Green | 0.39% | 0.16% (+0.232)#49 | 0.15% (+0.243)#2,440 |
| 50. | Rivanna | 0.38% | 0.16% (+0.225)#50 | 0.15% (+0.236)#2,492 |
| 51. | Fishersville | 0.38% | 0.16% (+0.224)#51 | 0.15% (+0.235)#2,502 |
| 52. | Winchester | 0.38% | 0.16% (+0.223)#52 | 0.15% (+0.233)#2,509 |
| 53. | Leesylvania | 0.38% | 0.16% (+0.217)#53 | 0.15% (+0.228)#2,537 |
| 54. | Quantico | 0.37% | 0.16% (+0.210)#54 | 0.15% (+0.221)#2,576 |
| 55. | Reston | 0.36% | 0.16% (+0.201)#55 | 0.15% (+0.212)#2,636 |
| 56. | Woodbridge | 0.36% | 0.16% (+0.201)#56 | 0.15% (+0.212)#2,640 |
| 57. | Mckenney | 0.36% | 0.16% (+0.200)#57 | 0.15% (+0.210)#2,652 |
| 58. | Franconia | 0.35% | 0.16% (+0.188)#58 | 0.15% (+0.199)#2,728 |
| 59. | Triangle | 0.34% | 0.16% (+0.182)#59 | 0.15% (+0.193)#2,763 |
| 60. | South Riding | 0.34% | 0.16% (+0.181)#60 | 0.15% (+0.191)#2,772 |
| 61. | Mclean | 0.32% | 0.16% (+0.167)#61 | 0.15% (+0.177)#2,866 |
| 62. | Arlington | 0.32% | 0.16% (+0.166)#62 | 0.15% (+0.177)#2,875 |
| 63. | Tuckahoe | 0.32% | 0.16% (+0.158)#63 | 0.15% (+0.169)#2,927 |
| 64. | Southern Gateway | 0.31% | 0.16% (+0.155)#64 | 0.15% (+0.166)#2,944 |
| 65. | Newington Forest | 0.31% | 0.16% (+0.150)#65 | 0.15% (+0.161)#2,982 |
| 66. | Lovettsville | 0.30% | 0.16% (+0.142)#66 | 0.15% (+0.153)#3,038 |
| 67. | Linton Hall | 0.30% | 0.16% (+0.142)#67 | 0.15% (+0.152)#3,043 |
| 68. | Round Hill | 0.30% | 0.16% (+0.141)#68 | 0.15% (+0.152)#3,049 |
| 69. | Purcellville | 0.29% | 0.16% (+0.133)#69 | 0.15% (+0.144)#3,111 |
| 70. | Cascades | 0.29% | 0.16% (+0.129)#70 | 0.15% (+0.140)#3,147 |
| 71. | Alexandria | 0.28% | 0.16% (+0.126)#71 | 0.15% (+0.137)#3,170 |
| 72. | Brandermill | 0.28% | 0.16% (+0.122)#72 | 0.15% (+0.133)#3,209 |
| 73. | George Mason | 0.26% | 0.16% (+0.101)#73 | 0.15% (+0.112)#3,373 |
| 74. | Dale City | 0.25% | 0.16% (+0.096)#74 | 0.15% (+0.107)#3,416 |
| 75. | Seven Corners | 0.25% | 0.16% (+0.093)#75 | 0.15% (+0.104)#3,443 |
| 76. | Stuarts Draft | 0.25% | 0.16% (+0.093)#76 | 0.15% (+0.104)#3,453 |
| 77. | Ashburn | 0.25% | 0.16% (+0.090)#77 | 0.15% (+0.101)#3,470 |
| 78. | Leesburg | 0.25% | 0.16% (+0.089)#78 | 0.15% (+0.100)#3,479 |
| 79. | Newington | 0.24% | 0.16% (+0.085)#79 | 0.15% (+0.096)#3,508 |
| 80. | Charlottesville | 0.24% | 0.16% (+0.077)#80 | 0.15% (+0.088)#3,566 |
| 81. | Kilmarnock | 0.23% | 0.16% (+0.076)#81 | 0.15% (+0.086)#3,586 |
| 82. | Cave Spring | 0.23% | 0.16% (+0.073)#82 | 0.15% (+0.083)#3,608 |
| 83. | Fort Belvoir | 0.23% | 0.16% (+0.072)#83 | 0.15% (+0.083)#3,613 |
| 84. | Centreville | 0.23% | 0.16% (+0.069)#84 | 0.15% (+0.080)#3,649 |
| 85. | Herndon | 0.22% | 0.16% (+0.063)#85 | 0.15% (+0.073)#3,718 |
| 86. | Aquia Harbour | 0.22% | 0.16% (+0.058)#86 | 0.15% (+0.069)#3,762 |
| 87. | Salem | 0.21% | 0.16% (+0.055)#87 | 0.15% (+0.066)#3,804 |
| 88. | Manchester | 0.21% | 0.16% (+0.051)#88 | 0.15% (+0.062)#3,829 |
| 89. | Glen Allen | 0.21% | 0.16% (+0.051)#89 | 0.15% (+0.062)#3,833 |
| 90. | Christiansburg | 0.21% | 0.16% (+0.051)#90 | 0.15% (+0.062)#3,835 |
| 91. | Dayton | 0.21% | 0.16% (+0.051)#91 | 0.15% (+0.062)#3,839 |
| 92. | West Falls Church | 0.21% | 0.16% (+0.048)#92 | 0.15% (+0.058)#3,872 |
| 93. | Lexington | 0.20% | 0.16% (+0.046)#93 | 0.15% (+0.057)#3,890 |
| 94. | Woodburn | 0.20% | 0.16% (+0.043)#94 | 0.15% (+0.053)#3,928 |
| 95. | Smithfield | 0.20% | 0.16% (+0.039)#95 | 0.15% (+0.050)#3,970 |
| 96. | Madison Heights | 0.20% | 0.16% (+0.038)#96 | 0.15% (+0.049)#3,979 |
| 97. | Manassas | 0.19% | 0.16% (+0.037)#97 | 0.15% (+0.047)#4,002 |
| 98. | Groveton | 0.19% | 0.16% (+0.033)#98 | 0.15% (+0.044)#4,045 |
| 99. | Chatham | 0.18% | 0.16% (+0.025)#99 | 0.15% (+0.036)#4,135 |
| 100. | Chantilly | 0.18% | 0.16% (+0.024)#100 | 0.15% (+0.034)#4,154 |
Common Questions
What are the Top 10 Cities with the Highest Percentage of Northern European Population in Virginia?
Top 10 Cities with the Highest Percentage of Northern European Population in Virginia are:
#1
26.05%
#2
19.05%
#3
7.69%
#4
1.85%
#5
1.24%
#6
1.18%
#7
1.02%
#8
1.02%
#9
0.98%
#10
0.98%
What city has the Highest Percentage of Northern European Population in Virginia?
Horntown has the Highest Percentage of Northern European Population in Virginia with 26.05%.
What is the Percentage of Northern European Population in the State of Virginia?
Percentage of Northern European Population in Virginia is 0.16%.
What is the Percentage of Northern European Population in the United States?
Percentage of Northern European Population in the United States is 0.15%.