Cities with the Highest Percentage of Northern European Population in Oklahoma
RELATED REPORTS & OPTIONS
Northern European
Oklahoma
Compare Cities
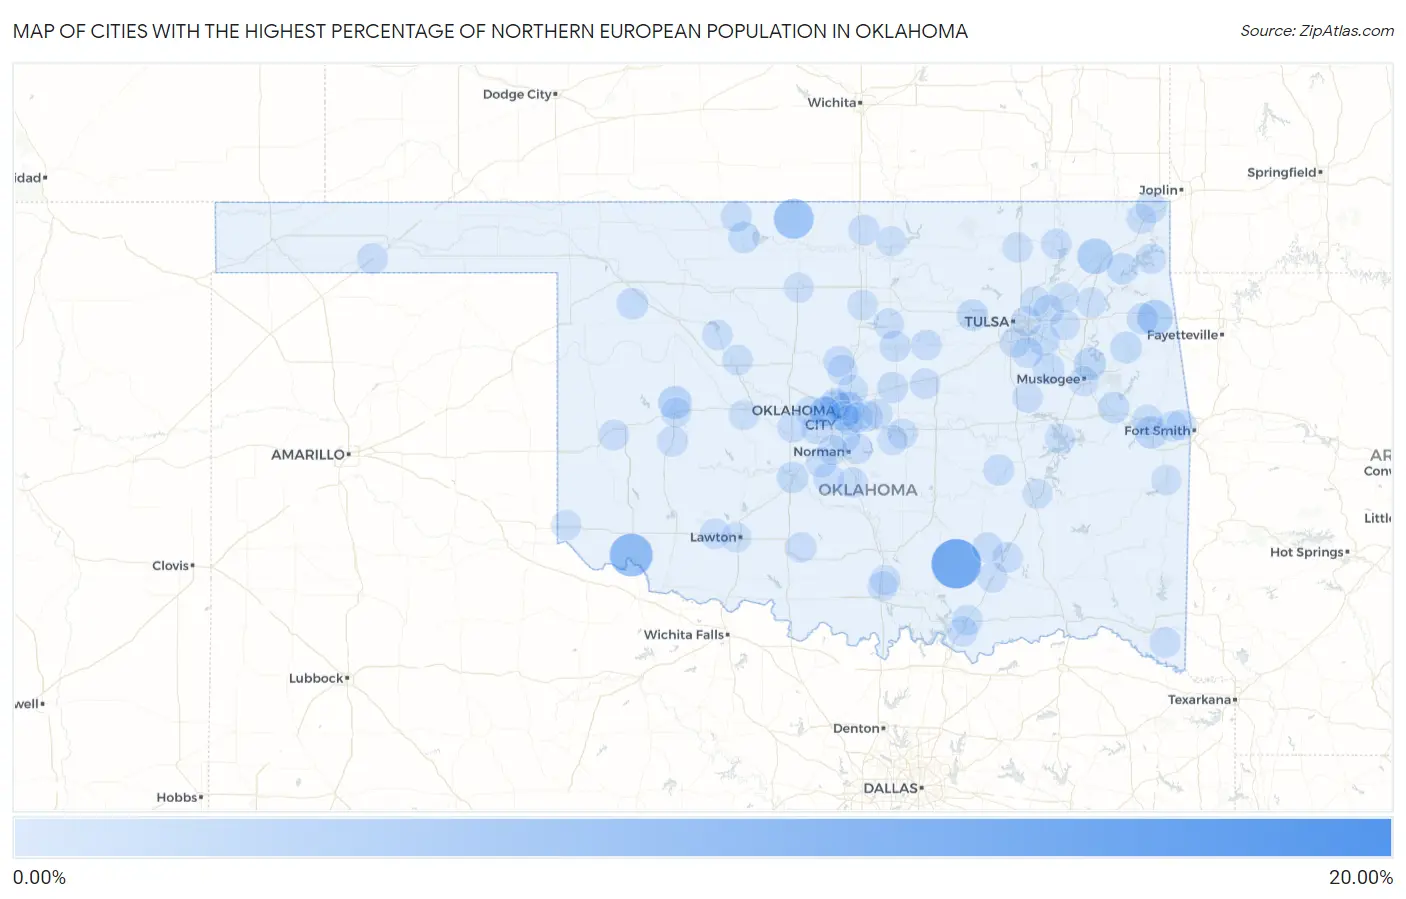
Map of Cities with the Highest Percentage of Northern European Population in Oklahoma
0.00%
20.00%
Cities with the Highest Percentage of Northern European Population in Oklahoma
| City | Northern European | vs State | vs National | |
| 1. | Pontotoc | 16.87% | 0.15%(+16.7)#1 | 0.15%(+16.7)#22 |
| 2. | Bromide | 11.48% | 0.15%(+11.3)#2 | 0.15%(+11.3)#40 |
| 3. | Elmer | 7.50% | 0.15%(+7.35)#3 | 0.15%(+7.35)#68 |
| 4. | Wakita | 5.59% | 0.15%(+5.44)#4 | 0.15%(+5.44)#93 |
| 5. | Leonard | 4.69% | 0.15%(+4.54)#5 | 0.15%(+4.54)#120 |
| 6. | White Oak | 3.17% | 0.15%(+3.02)#6 | 0.15%(+3.02)#199 |
| 7. | Flint Creek | 3.10% | 0.15%(+2.95)#7 | 0.15%(+2.95)#203 |
| 8. | Pumpkin Hollow | 2.02% | 0.15%(+1.87)#8 | 0.15%(+1.87)#385 |
| 9. | Arapaho | 1.89% | 0.15%(+1.74)#9 | 0.15%(+1.74)#419 |
| 10. | Lake Aluma | 1.89% | 0.15%(+1.74)#10 | 0.15%(+1.74)#420 |
| 11. | Brent | 1.44% | 0.15%(+1.29)#11 | 0.15%(+1.30)#591 |
| 12. | Okay | 1.39% | 0.15%(+1.24)#12 | 0.15%(+1.24)#620 |
| 13. | Grandview | 0.99% | 0.15%(+0.838)#13 | 0.15%(+0.841)#910 |
| 14. | Broken Arrow | 0.89% | 0.15%(+0.738)#14 | 0.15%(+0.740)#1,037 |
| 15. | Westport | 0.82% | 0.15%(+0.668)#15 | 0.15%(+0.670)#1,142 |
| 16. | Gore | 0.80% | 0.15%(+0.647)#16 | 0.15%(+0.650)#1,182 |
| 17. | Cherokee | 0.77% | 0.15%(+0.622)#17 | 0.15%(+0.624)#1,212 |
| 18. | Chickasha | 0.77% | 0.15%(+0.620)#18 | 0.15%(+0.623)#1,214 |
| 19. | Ketchum | 0.75% | 0.15%(+0.601)#19 | 0.15%(+0.603)#1,253 |
| 20. | Sharon | 0.72% | 0.15%(+0.575)#20 | 0.15%(+0.577)#1,314 |
| 21. | Oaks | 0.72% | 0.15%(+0.572)#21 | 0.15%(+0.575)#1,324 |
| 22. | Haskell | 0.71% | 0.15%(+0.563)#22 | 0.15%(+0.565)#1,352 |
| 23. | Quapaw | 0.71% | 0.15%(+0.555)#23 | 0.15%(+0.558)#1,367 |
| 24. | Woodlawn Park | 0.68% | 0.15%(+0.531)#24 | 0.15%(+0.533)#1,428 |
| 25. | Burlington | 0.55% | 0.15%(+0.397)#25 | 0.15%(+0.399)#1,795 |
| 26. | Wellston | 0.50% | 0.15%(+0.354)#26 | 0.15%(+0.356)#1,942 |
| 27. | Lamar | 0.50% | 0.15%(+0.350)#27 | 0.15%(+0.353)#1,954 |
| 28. | Perkins | 0.47% | 0.15%(+0.316)#28 | 0.15%(+0.319)#2,079 |
| 29. | Nichols Hills | 0.44% | 0.15%(+0.291)#29 | 0.15%(+0.294)#2,178 |
| 30. | Bixby | 0.41% | 0.15%(+0.261)#30 | 0.15%(+0.263)#2,320 |
| 31. | Blackwell | 0.41% | 0.15%(+0.258)#31 | 0.15%(+0.260)#2,341 |
| 32. | Cedar Valley | 0.40% | 0.15%(+0.250)#32 | 0.15%(+0.253)#2,380 |
| 33. | Dibble | 0.37% | 0.15%(+0.216)#33 | 0.15%(+0.219)#2,591 |
| 34. | New Cordell | 0.36% | 0.15%(+0.211)#34 | 0.15%(+0.214)#2,623 |
| 35. | Haworth | 0.35% | 0.15%(+0.204)#35 | 0.15%(+0.206)#2,679 |
| 36. | Elk City | 0.33% | 0.15%(+0.181)#36 | 0.15%(+0.183)#2,824 |
| 37. | Cushing | 0.30% | 0.15%(+0.150)#37 | 0.15%(+0.153)#3,041 |
| 38. | Davenport | 0.29% | 0.15%(+0.142)#38 | 0.15%(+0.144)#3,106 |
| 39. | Durant | 0.29% | 0.15%(+0.138)#39 | 0.15%(+0.141)#3,138 |
| 40. | Goodwell | 0.28% | 0.15%(+0.134)#40 | 0.15%(+0.136)#3,176 |
| 41. | Muldrow | 0.27% | 0.15%(+0.124)#41 | 0.15%(+0.126)#3,257 |
| 42. | Nowata | 0.25% | 0.15%(+0.104)#42 | 0.15%(+0.107)#3,418 |
| 43. | Verdigris | 0.24% | 0.15%(+0.095)#43 | 0.15%(+0.098)#3,495 |
| 44. | Tushka | 0.24% | 0.15%(+0.086)#44 | 0.15%(+0.088)#3,568 |
| 45. | Mustang | 0.23% | 0.15%(+0.079)#45 | 0.15%(+0.082)#3,627 |
| 46. | Stringtown | 0.23% | 0.15%(+0.079)#46 | 0.15%(+0.081)#3,634 |
| 47. | Watonga | 0.23% | 0.15%(+0.077)#47 | 0.15%(+0.079)#3,656 |
| 48. | Union City | 0.23% | 0.15%(+0.077)#48 | 0.15%(+0.079)#3,657 |
| 49. | Purcell | 0.23% | 0.15%(+0.076)#49 | 0.15%(+0.079)#3,659 |
| 50. | Choctaw | 0.22% | 0.15%(+0.072)#50 | 0.15%(+0.075)#3,697 |
| 51. | The Village | 0.22% | 0.15%(+0.072)#51 | 0.15%(+0.074)#3,705 |
| 52. | Jenks | 0.22% | 0.15%(+0.071)#52 | 0.15%(+0.073)#3,722 |
| 53. | Norman | 0.22% | 0.15%(+0.067)#53 | 0.15%(+0.070)#3,754 |
| 54. | Coalgate | 0.21% | 0.15%(+0.062)#54 | 0.15%(+0.065)#3,813 |
| 55. | Sallisaw | 0.21% | 0.15%(+0.061)#55 | 0.15%(+0.064)#3,818 |
| 56. | Calera | 0.21% | 0.15%(+0.058)#56 | 0.15%(+0.060)#3,854 |
| 57. | Cache | 0.20% | 0.15%(+0.052)#57 | 0.15%(+0.054)#3,916 |
| 58. | Duncan | 0.20% | 0.15%(+0.048)#58 | 0.15%(+0.050)#3,962 |
| 59. | Tulsa | 0.20% | 0.15%(+0.046)#59 | 0.15%(+0.049)#3,986 |
| 60. | Blanchard | 0.20% | 0.15%(+0.046)#60 | 0.15%(+0.048)#3,998 |
| 61. | Canton | 0.19% | 0.15%(+0.043)#61 | 0.15%(+0.045)#4,036 |
| 62. | Edmond | 0.19% | 0.15%(+0.038)#62 | 0.15%(+0.040)#4,084 |
| 63. | Morris | 0.19% | 0.15%(+0.036)#63 | 0.15%(+0.038)#4,107 |
| 64. | Roland | 0.18% | 0.15%(+0.026)#64 | 0.15%(+0.029)#4,230 |
| 65. | Grove | 0.17% | 0.15%(+0.021)#65 | 0.15%(+0.024)#4,288 |
| 66. | Stillwater | 0.17% | 0.15%(+0.021)#66 | 0.15%(+0.023)#4,292 |
| 67. | Inola | 0.16% | 0.15%(+0.010)#67 | 0.15%(+0.012)#4,403 |
| 68. | Moore | 0.15% | 0.15%(+0.003)#68 | 0.15%(+0.006)#4,495 |
| 69. | Guthrie | 0.15% | 0.15%(-0.003)#69 | 0.15%(-0.000)#4,562 |
| 70. | Claremore | 0.15% | 0.15%(-0.003)#70 | 0.15%(-0.000)#4,565 |
| 71. | Del City | 0.13% | 0.15%(-0.016)#71 | 0.15%(-0.014)#4,731 |
| 72. | Springer | 0.13% | 0.15%(-0.017)#72 | 0.15%(-0.015)#4,751 |
| 73. | Oklahoma City | 0.13% | 0.15%(-0.021)#73 | 0.15%(-0.018)#4,792 |
| 74. | Hollis | 0.13% | 0.15%(-0.021)#74 | 0.15%(-0.018)#4,794 |
| 75. | Pryor Creek | 0.13% | 0.15%(-0.023)#75 | 0.15%(-0.021)#4,824 |
| 76. | Hinton | 0.12% | 0.15%(-0.025)#76 | 0.15%(-0.023)#4,850 |
| 77. | Bartlesville | 0.12% | 0.15%(-0.026)#77 | 0.15%(-0.024)#4,873 |
| 78. | Clinton | 0.12% | 0.15%(-0.032)#78 | 0.15%(-0.030)#4,949 |
| 79. | Midwest City | 0.11% | 0.15%(-0.036)#79 | 0.15%(-0.034)#4,997 |
| 80. | Poteau | 0.11% | 0.15%(-0.037)#80 | 0.15%(-0.034)#5,008 |
| 81. | Newcastle | 0.11% | 0.15%(-0.037)#81 | 0.15%(-0.034)#5,009 |
| 82. | Shawnee | 0.11% | 0.15%(-0.038)#82 | 0.15%(-0.036)#5,037 |
| 83. | Perry | 0.11% | 0.15%(-0.039)#83 | 0.15%(-0.037)#5,055 |
| 84. | Yukon | 0.10% | 0.15%(-0.046)#84 | 0.15%(-0.044)#5,154 |
| 85. | Ardmore | 0.10% | 0.15%(-0.049)#85 | 0.15%(-0.046)#5,185 |
| 86. | Bethel Acres | 0.098% | 0.15%(-0.052)#86 | 0.15%(-0.049)#5,217 |
| 87. | Harrah | 0.096% | 0.15%(-0.054)#87 | 0.15%(-0.051)#5,252 |
| 88. | Lawton | 0.092% | 0.15%(-0.057)#88 | 0.15%(-0.055)#5,300 |
| 89. | Mcalester | 0.088% | 0.15%(-0.061)#89 | 0.15%(-0.059)#5,346 |
| 90. | Owasso | 0.081% | 0.15%(-0.068)#90 | 0.15%(-0.066)#5,445 |
| 91. | Muskogee | 0.065% | 0.15%(-0.085)#91 | 0.15%(-0.082)#5,669 |
| 92. | Enid | 0.063% | 0.15%(-0.087)#92 | 0.15%(-0.085)#5,696 |
| 93. | Bethany | 0.053% | 0.15%(-0.096)#93 | 0.15%(-0.094)#5,817 |
| 94. | Eufaula | 0.036% | 0.15%(-0.114)#94 | 0.15%(-0.111)#6,055 |
| 95. | Miami | 0.023% | 0.15%(-0.127)#95 | 0.15%(-0.124)#6,201 |
| 96. | Ponca City | 0.020% | 0.15%(-0.129)#96 | 0.15%(-0.127)#6,229 |
Common Questions
What are the Top 10 Cities with the Highest Percentage of Northern European Population in Oklahoma?
Top 10 Cities with the Highest Percentage of Northern European Population in Oklahoma are:
#1
11.48%
#2
7.50%
#3
5.59%
#4
3.17%
#5
3.10%
#6
1.89%
#7
1.89%
#8
1.44%
#9
1.39%
#10
0.99%
What city has the Highest Percentage of Northern European Population in Oklahoma?
Bromide has the Highest Percentage of Northern European Population in Oklahoma with 11.48%.
What is the Percentage of Northern European Population in the State of Oklahoma?
Percentage of Northern European Population in Oklahoma is 0.15%.
What is the Percentage of Northern European Population in the United States?
Percentage of Northern European Population in the United States is 0.15%.