Cities with the Highest Percentage of Northern European Population in Massachusetts
RELATED REPORTS & OPTIONS
Northern European
Massachusetts
Compare Cities
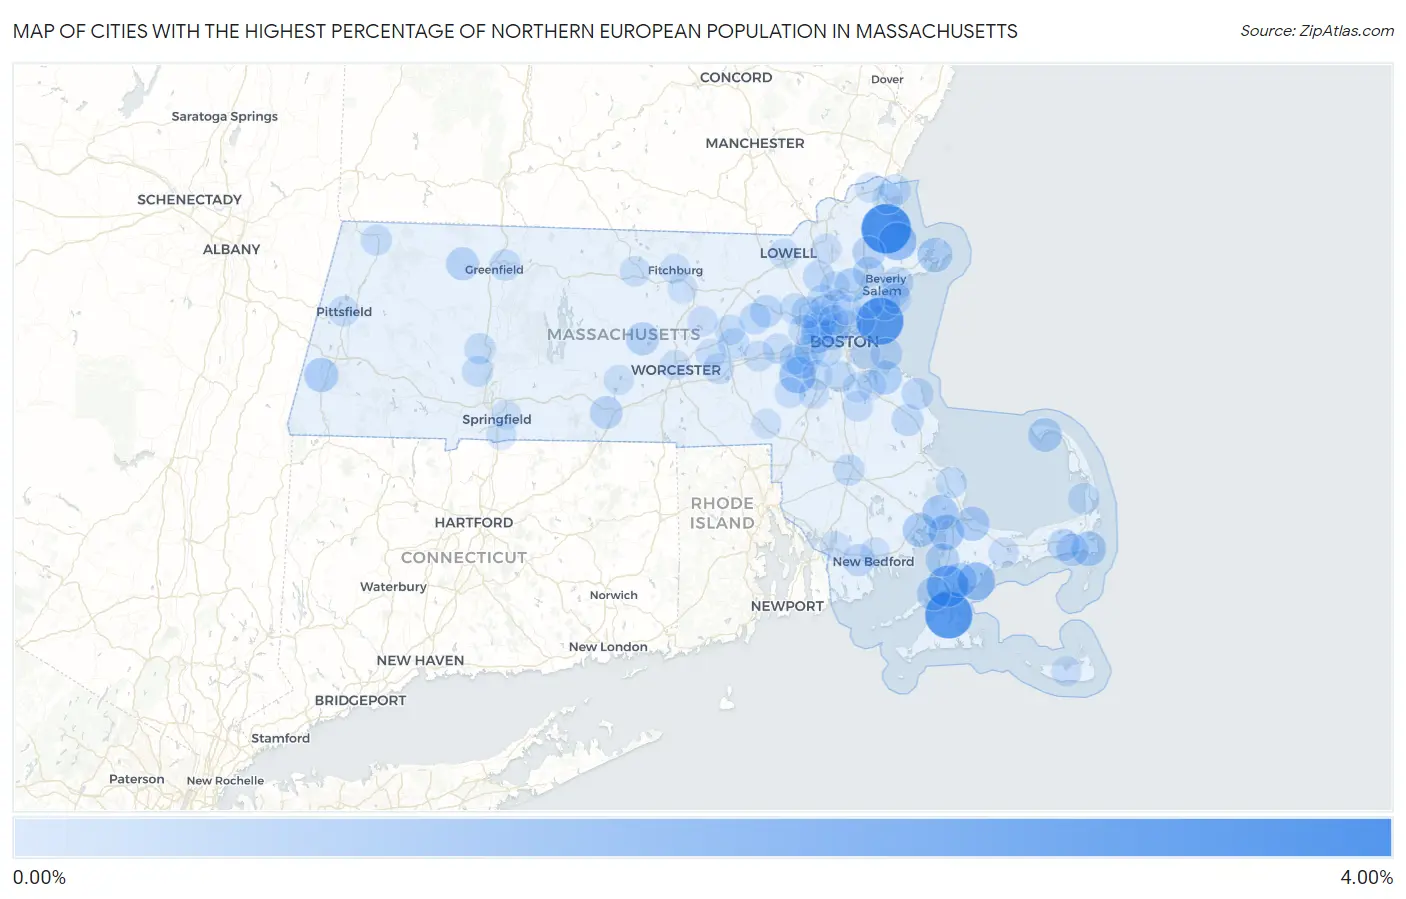
Map of Cities with the Highest Percentage of Northern European Population in Massachusetts
0.00%
4.00%
Cities with the Highest Percentage of Northern European Population in Massachusetts
| City | Northern European | vs State | vs National | |
| 1. | Rowley | 3.90% | 0.14%(+3.75)#1 | 0.15%(+3.75)#150 |
| 2. | Vineyard Haven | 3.42% | 0.14%(+3.28)#2 | 0.15%(+3.27)#181 |
| 3. | Nahant | 3.39% | 0.14%(+3.24)#3 | 0.15%(+3.24)#185 |
| 4. | Falmouth | 2.24% | 0.14%(+2.10)#4 | 0.15%(+2.09)#337 |
| 5. | Ipswich | 1.54% | 0.14%(+1.40)#5 | 0.15%(+1.39)#550 |
| 6. | New Seabury | 1.49% | 0.14%(+1.35)#6 | 0.15%(+1.34)#569 |
| 7. | Dover | 1.23% | 0.14%(+1.09)#7 | 0.15%(+1.09)#706 |
| 8. | Bourne | 1.07% | 0.14%(+0.923)#8 | 0.15%(+0.919)#835 |
| 9. | White Island Shores | 0.99% | 0.14%(+0.847)#9 | 0.15%(+0.842)#908 |
| 10. | West Chatham | 0.92% | 0.14%(+0.776)#10 | 0.15%(+0.771)#997 |
| 11. | Gloucester | 0.90% | 0.14%(+0.756)#11 | 0.15%(+0.751)#1,020 |
| 12. | Weweantic | 0.88% | 0.14%(+0.736)#12 | 0.15%(+0.732)#1,050 |
| 13. | Sandwich | 0.81% | 0.14%(+0.671)#13 | 0.15%(+0.667)#1,148 |
| 14. | Housatonic | 0.81% | 0.14%(+0.669)#14 | 0.15%(+0.665)#1,152 |
| 15. | East Falmouth | 0.79% | 0.14%(+0.650)#15 | 0.15%(+0.646)#1,192 |
| 16. | Hingham | 0.75% | 0.14%(+0.606)#16 | 0.15%(+0.602)#1,255 |
| 17. | Provincetown | 0.73% | 0.14%(+0.585)#17 | 0.15%(+0.581)#1,303 |
| 18. | Lynnfield | 0.72% | 0.14%(+0.577)#18 | 0.15%(+0.572)#1,330 |
| 19. | Woods Hole | 0.71% | 0.14%(+0.563)#19 | 0.15%(+0.558)#1,364 |
| 20. | Watertown Town | 0.70% | 0.14%(+0.559)#20 | 0.15%(+0.555)#1,379 |
| 21. | North Falmouth | 0.69% | 0.14%(+0.547)#21 | 0.15%(+0.543)#1,405 |
| 22. | Arlington | 0.64% | 0.14%(+0.500)#22 | 0.15%(+0.495)#1,519 |
| 23. | Rutland | 0.59% | 0.14%(+0.449)#23 | 0.15%(+0.444)#1,673 |
| 24. | Shelburne Falls | 0.59% | 0.14%(+0.446)#24 | 0.15%(+0.441)#1,681 |
| 25. | Topsfield | 0.54% | 0.14%(+0.393)#25 | 0.15%(+0.389)#1,828 |
| 26. | Fiskdale | 0.53% | 0.14%(+0.388)#26 | 0.15%(+0.383)#1,844 |
| 27. | Harwich Port | 0.49% | 0.14%(+0.346)#27 | 0.15%(+0.341)#1,997 |
| 28. | West Concord | 0.48% | 0.14%(+0.338)#28 | 0.15%(+0.333)#2,019 |
| 29. | Belmont | 0.46% | 0.14%(+0.316)#29 | 0.15%(+0.312)#2,104 |
| 30. | Northwest Harwich | 0.44% | 0.14%(+0.299)#30 | 0.15%(+0.294)#2,176 |
| 31. | Smith Mills | 0.44% | 0.14%(+0.296)#31 | 0.15%(+0.292)#2,187 |
| 32. | Needham | 0.43% | 0.14%(+0.292)#32 | 0.15%(+0.288)#2,202 |
| 33. | Danvers | 0.41% | 0.14%(+0.266)#33 | 0.15%(+0.261)#2,336 |
| 34. | Cambridge | 0.40% | 0.14%(+0.255)#34 | 0.15%(+0.250)#2,393 |
| 35. | Hull | 0.39% | 0.14%(+0.243)#35 | 0.15%(+0.238)#2,470 |
| 36. | Lexington | 0.38% | 0.14%(+0.240)#36 | 0.15%(+0.235)#2,496 |
| 37. | North Pembroke | 0.38% | 0.14%(+0.237)#37 | 0.15%(+0.232)#2,521 |
| 38. | Scituate | 0.37% | 0.14%(+0.225)#38 | 0.15%(+0.220)#2,585 |
| 39. | Wilmington | 0.34% | 0.14%(+0.194)#39 | 0.15%(+0.189)#2,782 |
| 40. | Beverly | 0.33% | 0.14%(+0.185)#40 | 0.15%(+0.180)#2,845 |
| 41. | Winchester | 0.32% | 0.14%(+0.182)#41 | 0.15%(+0.177)#2,870 |
| 42. | Wellesley | 0.31% | 0.14%(+0.165)#42 | 0.15%(+0.161)#2,986 |
| 43. | North Eastham | 0.30% | 0.14%(+0.162)#43 | 0.15%(+0.157)#3,012 |
| 44. | Salisbury | 0.30% | 0.14%(+0.161)#44 | 0.15%(+0.156)#3,016 |
| 45. | Newton | 0.30% | 0.14%(+0.158)#45 | 0.15%(+0.153)#3,032 |
| 46. | Maynard | 0.30% | 0.14%(+0.157)#46 | 0.15%(+0.153)#3,042 |
| 47. | Raynham Center | 0.30% | 0.14%(+0.153)#47 | 0.15%(+0.148)#3,078 |
| 48. | The Pinehills | 0.29% | 0.14%(+0.150)#48 | 0.15%(+0.145)#3,097 |
| 49. | Turners Falls | 0.29% | 0.14%(+0.144)#49 | 0.15%(+0.139)#3,153 |
| 50. | Milton | 0.27% | 0.14%(+0.131)#50 | 0.15%(+0.127)#3,248 |
| 51. | Salem | 0.26% | 0.14%(+0.122)#51 | 0.15%(+0.118)#3,318 |
| 52. | Northampton | 0.25% | 0.14%(+0.109)#52 | 0.15%(+0.104)#3,448 |
| 53. | Marlborough | 0.23% | 0.14%(+0.092)#53 | 0.15%(+0.087)#3,578 |
| 54. | Brookline | 0.23% | 0.14%(+0.084)#54 | 0.15%(+0.079)#3,654 |
| 55. | Hanscom Afb | 0.22% | 0.14%(+0.081)#55 | 0.15%(+0.077)#3,676 |
| 56. | Woburn | 0.22% | 0.14%(+0.079)#56 | 0.15%(+0.075)#3,700 |
| 57. | Somerville | 0.21% | 0.14%(+0.070)#57 | 0.15%(+0.065)#3,808 |
| 58. | Easthampton Town | 0.21% | 0.14%(+0.068)#58 | 0.15%(+0.063)#3,822 |
| 59. | North Adams | 0.21% | 0.14%(+0.066)#59 | 0.15%(+0.061)#3,842 |
| 60. | Westborough | 0.21% | 0.14%(+0.063)#60 | 0.15%(+0.058)#3,875 |
| 61. | Waltham | 0.19% | 0.14%(+0.047)#61 | 0.15%(+0.043)#4,059 |
| 62. | Hudson | 0.18% | 0.14%(+0.038)#62 | 0.15%(+0.033)#4,166 |
| 63. | Holbrook | 0.17% | 0.14%(+0.025)#63 | 0.15%(+0.020)#4,329 |
| 64. | Swampscott | 0.17% | 0.14%(+0.022)#64 | 0.15%(+0.018)#4,345 |
| 65. | Amherst | 0.16% | 0.14%(+0.022)#65 | 0.15%(+0.017)#4,355 |
| 66. | Marblehead | 0.16% | 0.14%(+0.019)#66 | 0.15%(+0.015)#4,378 |
| 67. | Framingham | 0.16% | 0.14%(+0.019)#67 | 0.15%(+0.014)#4,387 |
| 68. | Medfield | 0.16% | 0.14%(+0.015)#68 | 0.15%(+0.011)#4,425 |
| 69. | Pittsfield | 0.16% | 0.14%(+0.013)#69 | 0.15%(+0.008)#4,466 |
| 70. | Newburyport | 0.15% | 0.14%(+0.004)#70 | 0.15%(-0.000)#4,564 |
| 71. | Gardner | 0.14% | 0.14%(-0.005)#71 | 0.15%(-0.010)#4,679 |
| 72. | Norwood | 0.14% | 0.14%(-0.006)#72 | 0.15%(-0.010)#4,684 |
| 73. | Stoneham | 0.12% | 0.14%(-0.025)#73 | 0.15%(-0.030)#4,951 |
| 74. | Clinton | 0.11% | 0.14%(-0.034)#74 | 0.15%(-0.039)#5,082 |
| 75. | Boston | 0.11% | 0.14%(-0.035)#75 | 0.15%(-0.039)#5,087 |
| 76. | Dedham | 0.11% | 0.14%(-0.035)#76 | 0.15%(-0.040)#5,093 |
| 77. | Everett | 0.11% | 0.14%(-0.036)#77 | 0.15%(-0.041)#5,099 |
| 78. | Northborough | 0.10% | 0.14%(-0.038)#78 | 0.15%(-0.042)#5,132 |
| 79. | Revere | 0.10% | 0.14%(-0.039)#79 | 0.15%(-0.043)#5,145 |
| 80. | Barnstable Town | 0.10% | 0.14%(-0.043)#80 | 0.15%(-0.047)#5,193 |
| 81. | Medford | 0.097% | 0.14%(-0.046)#81 | 0.15%(-0.050)#5,233 |
| 82. | Cochituate | 0.086% | 0.14%(-0.056)#82 | 0.15%(-0.061)#5,371 |
| 83. | Worcester | 0.079% | 0.14%(-0.064)#83 | 0.15%(-0.068)#5,474 |
| 84. | Lowell | 0.076% | 0.14%(-0.067)#84 | 0.15%(-0.072)#5,519 |
| 85. | East Brookfield | 0.074% | 0.14%(-0.068)#85 | 0.15%(-0.073)#5,533 |
| 86. | Andover | 0.074% | 0.14%(-0.069)#86 | 0.15%(-0.073)#5,535 |
| 87. | Nantucket | 0.067% | 0.14%(-0.076)#87 | 0.15%(-0.081)#5,649 |
| 88. | Weymouth Town | 0.063% | 0.14%(-0.080)#88 | 0.15%(-0.085)#5,695 |
| 89. | Melrose | 0.061% | 0.14%(-0.082)#89 | 0.15%(-0.086)#5,711 |
| 90. | New Bedford | 0.059% | 0.14%(-0.084)#90 | 0.15%(-0.089)#5,744 |
| 91. | Reading | 0.055% | 0.14%(-0.088)#91 | 0.15%(-0.092)#5,793 |
| 92. | Amesbury Town | 0.052% | 0.14%(-0.091)#92 | 0.15%(-0.095)#5,835 |
| 93. | Franklin Town | 0.049% | 0.14%(-0.094)#93 | 0.15%(-0.099)#5,885 |
| 94. | Fall River | 0.046% | 0.14%(-0.097)#94 | 0.15%(-0.101)#5,918 |
| 95. | Lynn | 0.046% | 0.14%(-0.097)#95 | 0.15%(-0.102)#5,923 |
| 96. | Leominster | 0.044% | 0.14%(-0.099)#96 | 0.15%(-0.104)#5,955 |
| 97. | Fitchburg | 0.034% | 0.14%(-0.109)#97 | 0.15%(-0.114)#6,087 |
| 98. | Longmeadow | 0.032% | 0.14%(-0.111)#98 | 0.15%(-0.116)#6,118 |
| 99. | Springfield | 0.032% | 0.14%(-0.111)#99 | 0.15%(-0.116)#6,121 |
| 100. | Braintree Town | 0.031% | 0.14%(-0.112)#100 | 0.15%(-0.116)#6,132 |
Common Questions
What are the Top 10 Cities with the Highest Percentage of Northern European Population in Massachusetts?
Top 10 Cities with the Highest Percentage of Northern European Population in Massachusetts are:
#1
3.90%
#2
3.42%
#3
3.39%
#4
2.24%
#5
1.54%
#6
1.49%
#7
1.23%
#8
1.07%
#9
0.99%
#10
0.92%
What city has the Highest Percentage of Northern European Population in Massachusetts?
Rowley has the Highest Percentage of Northern European Population in Massachusetts with 3.90%.
What is the Percentage of Northern European Population in the State of Massachusetts?
Percentage of Northern European Population in Massachusetts is 0.14%.
What is the Percentage of Northern European Population in the United States?
Percentage of Northern European Population in the United States is 0.15%.