Cities with the Highest Percentage of Northern European Population in Arkansas

RELATED REPORTS & OPTIONS

Northern European
Population
Families and Households
Female Fertility
Female Fertility (Unmarried)
Race (Community Size)
Race (Percentage)
Ancestry (Community Size)
AfghanAfricanAlaska NativeAlaskan AthabascanAlbanianAleutAlsatianAmericanApacheArabArapahoArgentineanArmenianAssyrian / Chaldean / SyriacAustralianAustrianBahamianBangladeshiBarbadianBasqueBelgianBelizeanBermudanBhutaneseBlackfeetBolivianBrazilianBritishBritish West IndianBulgarianBurmeseCajunCambodianCanadianCape VerdeanCarpatho RusynCelticCentral AmericanCentral American IndianCherokeeCheyenneChickasawChileanChineseChippewaChoctawColombianColvilleComancheCosta RicanCreeCreekCroatianCrowCubanCypriotCzechCzechoslovakianDanishDelawareDominicanDutchDutch West IndianEastern EuropeanEcuadorianEgyptianEnglishEstonianEthiopianEuropeanFijianFilipinoFinnishFrenchFrench American IndianFrench CanadianGermanGerman RussianGhanaianGreekGuamanian / ChamorroGuatemalanGuyaneseHaitianHmongHonduranHopiHoumaHungarianIcelanderIndian (Asian)IndonesianInupiatIranianIraqiIrishIroquoisIsraeliItalianJamaicanJapaneseJordanianKenyanKiowaKoreanLaotianLatvianLebaneseLiberianLithuanianLumbeeLuxembourgerMacedonianMalaysianMalteseMarshalleseMenomineeMexicanMexican American IndianMongolianMoroccanNative HawaiianNavajoNepaleseNew ZealanderNicaraguanNigerianNorthern EuropeanNorwegianOkinawanOsageOttawaPaiutePakistaniPalestinianPanamanianParaguayanPennsylvania GermanPeruvianPimaPolishPortuguesePotawatomiPuebloPuerto RicanPuget Sound SalishRomanianRussianSalvadoranSamoanScandinavianScotch-IrishScottishSeminoleSenegaleseSerbianShoshoneSierra LeoneanSiouxSlavicSlovakSloveneSomaliSouth AfricanSouth AmericanSouth American IndianSoviet UnionSpaniardSpanishSpanish AmericanSpanish American IndianSri LankanSubsaharan AfricanSudaneseSwedishSwissSyrianTaiwaneseThaiTlingit-HaidaTohono O'OdhamTonganTrinidadian and TobagonianTsimshianTurkishU.S. Virgin IslanderUgandanUkrainianUruguayanUteVenezuelanVietnameseWelshWest IndianYakamaYaquiYugoslavianYumanYup'ikZimbabwean
Ancestry (Percentage)
AfghanAfricanAlaska NativeAlaskan AthabascanAlbanianAleutAlsatianAmericanApacheArabArapahoArgentineanArmenianAssyrian / Chaldean / SyriacAustralianAustrianBahamianBangladeshiBarbadianBasqueBelgianBelizeanBermudanBhutaneseBlackfeetBolivianBrazilianBritishBritish West IndianBulgarianBurmeseCajunCambodianCanadianCape VerdeanCarpatho RusynCelticCentral AmericanCentral American IndianCherokeeCheyenneChickasawChileanChineseChippewaChoctawColombianColvilleComancheCosta RicanCreeCreekCroatianCrowCubanCypriotCzechCzechoslovakianDanishDelawareDominicanDutchDutch West IndianEastern EuropeanEcuadorianEgyptianEnglishEstonianEthiopianEuropeanFijianFilipinoFinnishFrenchFrench American IndianFrench CanadianGermanGerman RussianGhanaianGreekGuamanian / ChamorroGuatemalanGuyaneseHaitianHmongHonduranHopiHoumaHungarianIcelanderIndian (Asian)IndonesianInupiatIranianIraqiIrishIroquoisIsraeliItalianJamaicanJapaneseJordanianKenyanKiowaKoreanLaotianLatvianLebaneseLiberianLithuanianLumbeeLuxembourgerMacedonianMalaysianMalteseMarshalleseMenomineeMexicanMexican American IndianMongolianMoroccanNative HawaiianNavajoNepaleseNew ZealanderNicaraguanNigerianNorthern EuropeanNorwegianOkinawanOsageOttawaPaiutePakistaniPalestinianPanamanianParaguayanPennsylvania GermanPeruvianPimaPolishPortuguesePotawatomiPuebloPuerto RicanPuget Sound SalishRomanianRussianSalvadoranSamoanScandinavianScotch-IrishScottishSeminoleSenegaleseSerbianShoshoneSierra LeoneanSiouxSlavicSlovakSloveneSomaliSouth AfricanSouth AmericanSouth American IndianSoviet UnionSpaniardSpanishSpanish AmericanSpanish American IndianSri LankanSubsaharan AfricanSudaneseSwedishSwissSyrianTaiwaneseThaiTlingit-HaidaTohono O'OdhamTonganTrinidadian and TobagonianTsimshianTurkishU.S. Virgin IslanderUgandanUkrainianUruguayanUteVenezuelanVietnameseWelshWest IndianYakamaYaquiYugoslavianYumanYup'ikZimbabwean
Immigrant Origin (Total)
AfghanistanAfricaAlbaniaArgentinaArmeniaAsiaAustraliaAustriaAzoresBahamasBangladeshBarbadosBelarusBelgiumBelizeBoliviaBosnia and HerzegovinaBrazilBulgariaBurma / MyanmarCabo VerdeCambodiaCameroonCanadaCaribbeanCentral AmericaChileChinaColombiaCongoCosta RicaCroatiaCubaCzechoslovakiaDenmarkDominicaDominican RepublicEastern AfricaEastern AsiaEastern EuropeEcuadorEgyptEl SalvadorEnglandEritreaEthiopiaEuropeFijiFranceGermanyGhanaGreeceGrenadaGuatemalaGuyanaHaitiHondurasHong KongHungaryIndiaIndonesiaIranIraqIrelandIsraelItalyJamaicaJapanJordanKazakhstanKenyaKoreaKuwaitLaosLatin AmericaLatviaLebanonLiberiaLithuaniaMalaysiaMexicoMicronesiaMiddle AfricaMoldovaMoroccoNepalNetherlandsNicaraguaNigeriaNorth MacedoniaNorthern AfricaNorthern EuropeNorwayOceaniaPakistanPanamaPeruPhilippinesPolandPortugalRomaniaRussiaSaudi ArabiaScotlandSenegalSerbiaSierra LeoneSingaporeSomaliaSouth AfricaSouth AmericaSouth Central AsiaSouth Eastern AsiaSouthern EuropeSpainSri LankaSt. Vincent and the GrenadinesSudanSwedenSwitzerlandSyriaTaiwanThailandTrinidad and TobagoTurkeyUgandaUkraineUruguayUzbekistanVenezuelaVietnamWest IndiesWestern AfricaWestern AsiaWestern EuropeYemenZaireZimbabwe
Immigrant Origin (Percentage)
AfghanistanAfricaAlbaniaArgentinaArmeniaAsiaAustraliaAustriaAzoresBahamasBangladeshBarbadosBelarusBelgiumBelizeBoliviaBosnia and HerzegovinaBrazilBulgariaBurma / MyanmarCabo VerdeCambodiaCameroonCanadaCaribbeanCentral AmericaChileChinaColombiaCongoCosta RicaCroatiaCubaCzechoslovakiaDenmarkDominicaDominican RepublicEastern AfricaEastern AsiaEastern EuropeEcuadorEgyptEl SalvadorEnglandEritreaEthiopiaEuropeFijiFranceGermanyGhanaGreeceGrenadaGuatemalaGuyanaHaitiHondurasHong KongHungaryIndiaIndonesiaIranIraqIrelandIsraelItalyJamaicaJapanJordanKazakhstanKenyaKoreaKuwaitLaosLatin AmericaLatviaLebanonLiberiaLithuaniaMalaysiaMexicoMicronesiaMiddle AfricaMoldovaMoroccoNepalNetherlandsNicaraguaNigeriaNorth MacedoniaNorthern AfricaNorthern EuropeNorwayOceaniaPakistanPanamaPeruPhilippinesPolandPortugalRomaniaRussiaSaudi ArabiaScotlandSenegalSerbiaSierra LeoneSingaporeSomaliaSouth AfricaSouth AmericaSouth Central AsiaSouth Eastern AsiaSouthern EuropeSpainSri LankaSt. Vincent and the GrenadinesSudanSwedenSwitzerlandSyriaTaiwanThailandTrinidad and TobagoTurkeyUgandaUkraineUruguayUzbekistanVenezuelaVietnamWest IndiesWestern AfricaWestern AsiaWestern EuropeYemenZaireZimbabwe
Income
Income (Families)
Income (Households)
Poverty
Poverty (Families)
Unemployment
Employment Occupations
Employment Industries
Employer Class
Commute Time
Commute Means
School Enrollment
Education by Degree Field
Occupancy
Finances
Physical Characteristics
Arkansas
Compare Cities
Comparison Subject

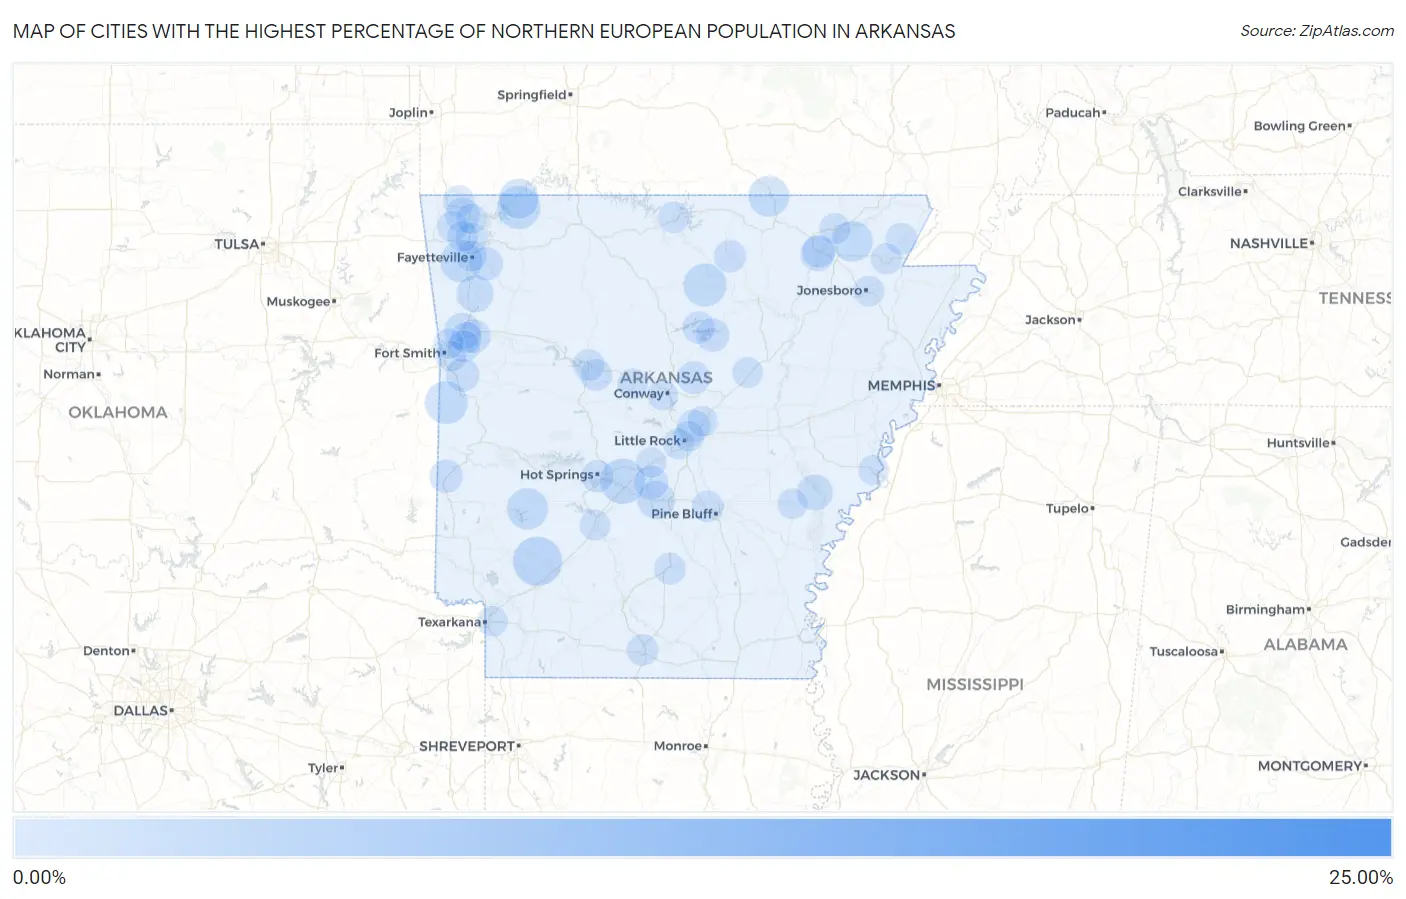
Map of Cities with the Highest Percentage of Northern European Population in Arkansas

0.00%
25.00%
Cities with the Highest Percentage of Northern European Population in Arkansas Map

Cities with the Highest Percentage of Northern European Population in Arkansas

City Northern European vs State vs National
1.Bismarck24.60%0.10%(+24.5)#10.15%(+24.5)#13
2.Blevins2.42%0.10%(+2.31)#20.15%(+2.27)#303
3.Magnet Cove1.91%0.10%(+1.81)#30.15%(+1.76)#412
4.Eureka Springs1.66%0.10%(+1.55)#40.15%(+1.51)#497
5.Mountain View1.64%0.10%(+1.54)#50.15%(+1.49)#505
6.Hartford1.60%0.10%(+1.50)#60.15%(+1.45)#526
7.Farmington1.50%0.10%(+1.40)#70.15%(+1.35)#566
8.Kirby1.40%0.10%(+1.29)#80.15%(+1.25)#612
9.Mammoth Spring1.35%0.10%(+1.25)#90.15%(+1.20)#638
10.O Kean1.34%0.10%(+1.24)#100.15%(+1.19)#643
11.Holiday Island1.19%0.10%(+1.08)#110.15%(+1.04)#733
12.Prattsville0.99%0.10%(+0.887)#120.15%(+0.843)#906
13.Winslow0.87%0.10%(+0.769)#130.15%(+0.725)#1,059
14.Rudy0.84%0.10%(+0.738)#140.15%(+0.693)#1,102
15.St Charles0.74%0.10%(+0.638)#150.15%(+0.593)#1,275
16.Powhatan0.57%0.10%(+0.466)#160.15%(+0.421)#1,736
17.Bentonville0.53%0.10%(+0.431)#170.15%(+0.386)#1,831
18.Tull0.46%0.10%(+0.359)#180.15%(+0.315)#2,092
19.Elkins0.44%0.10%(+0.338)#190.15%(+0.293)#2,180
20.Greenwood0.44%0.10%(+0.337)#200.15%(+0.293)#2,182
21.Dyer0.44%0.10%(+0.334)#210.15%(+0.289)#2,198
22.Heber Springs0.42%0.10%(+0.322)#220.15%(+0.277)#2,248
23.Hatfield0.40%0.10%(+0.298)#230.15%(+0.253)#2,376
24.Sherwood0.36%0.10%(+0.258)#240.15%(+0.213)#2,627
25.Black Rock0.35%0.10%(+0.252)#250.15%(+0.207)#2,671
26.Greers Ferry0.33%0.10%(+0.229)#260.15%(+0.184)#2,815
27.Enola0.33%0.10%(+0.223)#270.15%(+0.178)#2,858
28.Hot Springs0.29%0.10%(+0.187)#280.15%(+0.142)#3,128
29.Melbourne0.29%0.10%(+0.185)#290.15%(+0.141)#3,136
30.Morrow0.29%0.10%(+0.183)#300.15%(+0.138)#3,160
31.Kibler0.26%0.10%(+0.160)#310.15%(+0.116)#3,346
32.Pottsville0.25%0.10%(+0.152)#320.15%(+0.107)#3,408
33.Fordyce0.21%0.10%(+0.104)#330.15%(+0.059)#3,862
34.Marmaduke0.20%0.10%(+0.096)#340.15%(+0.051)#3,955
35.Mountain Home0.19%0.10%(+0.092)#350.15%(+0.047)#4,011
36.El Dorado0.18%0.10%(+0.079)#360.15%(+0.034)#4,155
37.White Hall0.18%0.10%(+0.077)#370.15%(+0.033)#4,173
38.Springdale0.18%0.10%(+0.075)#380.15%(+0.030)#4,211
39.Russellville0.18%0.10%(+0.074)#390.15%(+0.029)#4,226
40.Alma0.17%0.10%(+0.069)#400.15%(+0.024)#4,285
41.Bella Vista0.17%0.10%(+0.062)#410.15%(+0.018)#4,350
42.Paragould0.14%0.10%(+0.042)#420.15%(-0.002)#4,595
43.Little Rock0.14%0.10%(+0.033)#430.15%(-0.011)#4,706
44.Fayetteville0.13%0.10%(+0.029)#440.15%(-0.016)#4,756
45.Pocahontas0.12%0.10%(+0.019)#450.15%(-0.025)#4,883
46.Highfill0.12%0.10%(+0.016)#460.15%(-0.028)#4,919
47.Elm Springs0.11%0.10%(+0.009)#470.15%(-0.036)#5,047
48.Jonesboro0.10%0.10%(-0.002)#480.15%(-0.047)#5,186
49.Arkadelphia0.087%0.10%(-0.016)#490.15%(-0.060)#5,363
50.Texarkana0.054%0.10%(-0.048)#500.15%(-0.093)#5,802
51.Rogers0.054%0.10%(-0.048)#510.15%(-0.093)#5,803
52.Searcy0.052%0.10%(-0.050)#520.15%(-0.095)#5,831
53.North Little Rock0.051%0.10%(-0.051)#530.15%(-0.096)#5,851
54.Fort Smith0.049%0.10%(-0.053)#540.15%(-0.098)#5,879
55.Benton0.037%0.10%(-0.066)#550.15%(-0.111)#6,046
56.Van Buren0.034%0.10%(-0.068)#560.15%(-0.113)#6,080
57.Jacksonville0.034%0.10%(-0.069)#570.15%(-0.113)#6,084
58.Dewitt0.033%0.10%(-0.069)#580.15%(-0.114)#6,098
59.Helena West Helena0.032%0.10%(-0.071)#590.15%(-0.116)#6,117
60.Morrilton0.029%0.10%(-0.074)#600.15%(-0.119)#6,152
61.Conway0.025%0.10%(-0.078)#610.15%(-0.123)#6,193

Common Questions

What are the Top 10 Cities with the Highest Percentage of Northern European Population in Arkansas?
Top 10 Cities with the Highest Percentage of Northern European Population in Arkansas are:
#1
2.42%
#2
1.91%
#3
1.66%
#4
1.64%
#5
1.60%
#6
1.50%
#7
1.40%
#8
1.35%
#9
1.34%
#10
1.19%
What city has the Highest Percentage of Northern European Population in Arkansas?
Blevins has the Highest Percentage of Northern European Population in Arkansas with 2.42%.
What is the Percentage of Northern European Population in the State of Arkansas?
Percentage of Northern European Population in Arkansas is 0.10%.
What is the Percentage of Northern European Population in the United States?
Percentage of Northern European Population in the United States is 0.15%.