Cities with the Highest Percentage of Immigrants from Southern Europe in Ohio
RELATED REPORTS & OPTIONS
Southern Europe
Ohio
Compare Cities
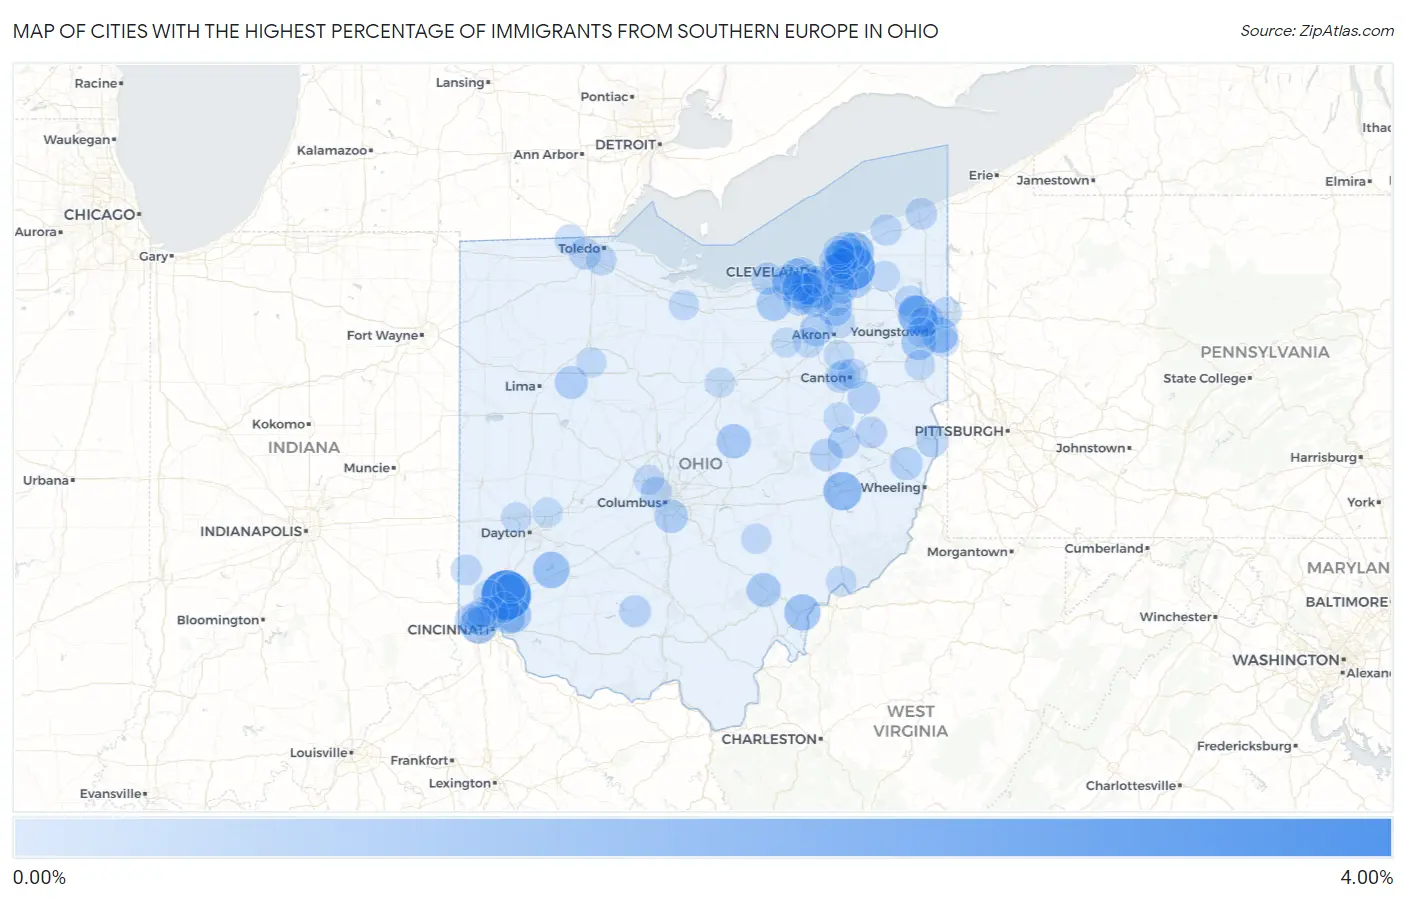
Map of Cities with the Highest Percentage of Immigrants from Southern Europe in Ohio
0.00%
4.00%
Cities with the Highest Percentage of Immigrants from Southern Europe in Ohio
| City | Southern Europe | vs State | vs National | |
| 1. | Olde West Chester | 3.20% | 0.096%(+3.10)#1 | 0.22%(+2.98)#134 |
| 2. | Chesterland | 2.45% | 0.096%(+2.35)#2 | 0.22%(+2.23)#216 |
| 3. | Oakwood Village Cuyahoga County | 1.97% | 0.096%(+1.88)#3 | 0.22%(+1.75)#289 |
| 4. | Bolindale | 1.54% | 0.096%(+1.45)#4 | 0.22%(+1.32)#418 |
| 5. | North Lima | 1.54% | 0.096%(+1.45)#5 | 0.22%(+1.32)#419 |
| 6. | Old Washington | 1.46% | 0.096%(+1.36)#6 | 0.22%(+1.24)#450 |
| 7. | Kirtland Hills | 1.33% | 0.096%(+1.23)#7 | 0.22%(+1.11)#519 |
| 8. | Seven Hills | 1.33% | 0.096%(+1.23)#8 | 0.22%(+1.11)#520 |
| 9. | Covedale | 1.28% | 0.096%(+1.18)#9 | 0.22%(+1.06)#553 |
| 10. | Harveysburg | 1.16% | 0.096%(+1.06)#10 | 0.22%(+0.938)#630 |
| 11. | Coolville | 1.14% | 0.096%(+1.04)#11 | 0.22%(+0.918)#645 |
| 12. | Mayfield Heights | 1.07% | 0.096%(+0.977)#12 | 0.22%(+0.853)#710 |
| 13. | Middleburg Heights | 1.05% | 0.096%(+0.953)#13 | 0.22%(+0.829)#728 |
| 14. | Campbell | 1.04% | 0.096%(+0.940)#14 | 0.22%(+0.816)#747 |
| 15. | The Village Of Indian Hill | 0.93% | 0.096%(+0.829)#15 | 0.22%(+0.705)#857 |
| 16. | Canfield | 0.91% | 0.096%(+0.817)#16 | 0.22%(+0.694)#873 |
| 17. | Gambier | 0.85% | 0.096%(+0.754)#17 | 0.22%(+0.630)#931 |
| 18. | Grafton | 0.82% | 0.096%(+0.724)#18 | 0.22%(+0.600)#972 |
| 19. | The Plains | 0.81% | 0.096%(+0.711)#19 | 0.22%(+0.588)#990 |
| 20. | Boston Heights | 0.81% | 0.096%(+0.709)#20 | 0.22%(+0.585)#994 |
| 21. | Kirtland | 0.80% | 0.096%(+0.699)#21 | 0.22%(+0.575)#1,010 |
| 22. | Broadview Heights | 0.74% | 0.096%(+0.641)#22 | 0.22%(+0.517)#1,102 |
| 23. | Wetherington | 0.73% | 0.096%(+0.631)#23 | 0.22%(+0.508)#1,119 |
| 24. | Obetz | 0.72% | 0.096%(+0.621)#24 | 0.22%(+0.497)#1,141 |
| 25. | South Russell | 0.71% | 0.096%(+0.610)#25 | 0.22%(+0.486)#1,175 |
| 26. | Woodworth | 0.68% | 0.096%(+0.582)#26 | 0.22%(+0.458)#1,229 |
| 27. | Willoughby Hills | 0.67% | 0.096%(+0.576)#27 | 0.22%(+0.452)#1,245 |
| 28. | Madeira | 0.67% | 0.096%(+0.572)#28 | 0.22%(+0.448)#1,251 |
| 29. | Ada | 0.65% | 0.096%(+0.552)#29 | 0.22%(+0.429)#1,304 |
| 30. | Lakewood | 0.64% | 0.096%(+0.542)#30 | 0.22%(+0.418)#1,330 |
| 31. | Highland Heights | 0.62% | 0.096%(+0.528)#31 | 0.22%(+0.404)#1,361 |
| 32. | Pigeon Creek | 0.62% | 0.096%(+0.520)#32 | 0.22%(+0.396)#1,383 |
| 33. | Adena | 0.61% | 0.096%(+0.511)#33 | 0.22%(+0.387)#1,407 |
| 34. | Rocky River | 0.60% | 0.096%(+0.507)#34 | 0.22%(+0.383)#1,415 |
| 35. | Newcomerstown | 0.55% | 0.096%(+0.456)#35 | 0.22%(+0.332)#1,540 |
| 36. | Waynesburg | 0.55% | 0.096%(+0.454)#36 | 0.22%(+0.330)#1,548 |
| 37. | Waite Hill | 0.54% | 0.096%(+0.445)#37 | 0.22%(+0.321)#1,567 |
| 38. | Steubenville | 0.52% | 0.096%(+0.426)#38 | 0.22%(+0.303)#1,608 |
| 39. | Sheffield | 0.52% | 0.096%(+0.424)#39 | 0.22%(+0.301)#1,615 |
| 40. | Brooklyn | 0.52% | 0.096%(+0.419)#40 | 0.22%(+0.295)#1,633 |
| 41. | Gnadenhutten | 0.51% | 0.096%(+0.410)#41 | 0.22%(+0.286)#1,662 |
| 42. | Bainbridge | 0.49% | 0.096%(+0.392)#42 | 0.22%(+0.268)#1,714 |
| 43. | Richmond Heights | 0.49% | 0.096%(+0.389)#43 | 0.22%(+0.265)#1,724 |
| 44. | Girard | 0.48% | 0.096%(+0.385)#44 | 0.22%(+0.261)#1,741 |
| 45. | Parma | 0.47% | 0.096%(+0.377)#45 | 0.22%(+0.253)#1,767 |
| 46. | Macedonia | 0.47% | 0.096%(+0.374)#46 | 0.22%(+0.250)#1,773 |
| 47. | Parma Heights | 0.47% | 0.096%(+0.372)#47 | 0.22%(+0.248)#1,777 |
| 48. | Holland | 0.45% | 0.096%(+0.352)#48 | 0.22%(+0.228)#1,844 |
| 49. | North Olmsted | 0.45% | 0.096%(+0.350)#49 | 0.22%(+0.227)#1,848 |
| 50. | Upper Arlington | 0.44% | 0.096%(+0.348)#50 | 0.22%(+0.224)#1,864 |
| 51. | Lyndhurst | 0.42% | 0.096%(+0.327)#51 | 0.22%(+0.203)#1,934 |
| 52. | Bowerston | 0.42% | 0.096%(+0.327)#52 | 0.22%(+0.203)#1,937 |
| 53. | Finneytown | 0.42% | 0.096%(+0.323)#53 | 0.22%(+0.200)#1,945 |
| 54. | Edgewood | 0.41% | 0.096%(+0.315)#54 | 0.22%(+0.191)#1,975 |
| 55. | Champion Heights | 0.39% | 0.096%(+0.298)#55 | 0.22%(+0.174)#2,037 |
| 56. | Madison | 0.38% | 0.096%(+0.284)#56 | 0.22%(+0.160)#2,098 |
| 57. | Evendale | 0.38% | 0.096%(+0.279)#57 | 0.22%(+0.155)#2,123 |
| 58. | West Hill | 0.36% | 0.096%(+0.262)#58 | 0.22%(+0.138)#2,201 |
| 59. | Meyers Lake | 0.36% | 0.096%(+0.262)#59 | 0.22%(+0.138)#2,202 |
| 60. | Willoughby | 0.36% | 0.096%(+0.261)#60 | 0.22%(+0.137)#2,209 |
| 61. | Strongsville | 0.35% | 0.096%(+0.257)#61 | 0.22%(+0.133)#2,231 |
| 62. | Westlake | 0.35% | 0.096%(+0.256)#62 | 0.22%(+0.133)#2,234 |
| 63. | Brook Park | 0.35% | 0.096%(+0.255)#63 | 0.22%(+0.131)#2,245 |
| 64. | Mayfield | 0.33% | 0.096%(+0.233)#64 | 0.22%(+0.109)#2,353 |
| 65. | Oxford | 0.33% | 0.096%(+0.230)#65 | 0.22%(+0.106)#2,367 |
| 66. | Berkey | 0.32% | 0.096%(+0.226)#66 | 0.22%(+0.103)#2,387 |
| 67. | Perry Heights | 0.32% | 0.096%(+0.223)#67 | 0.22%(+0.100)#2,400 |
| 68. | Cuyahoga Heights | 0.32% | 0.096%(+0.223)#68 | 0.22%(+0.099)#2,405 |
| 69. | Willowick | 0.32% | 0.096%(+0.220)#69 | 0.22%(+0.097)#2,417 |
| 70. | Miami Heights | 0.31% | 0.096%(+0.209)#70 | 0.22%(+0.085)#2,472 |
| 71. | Rossford | 0.30% | 0.096%(+0.205)#71 | 0.22%(+0.081)#2,497 |
| 72. | Orange | 0.29% | 0.096%(+0.195)#72 | 0.22%(+0.071)#2,540 |
| 73. | Dover | 0.29% | 0.096%(+0.193)#73 | 0.22%(+0.070)#2,551 |
| 74. | Dublin | 0.29% | 0.096%(+0.190)#74 | 0.22%(+0.066)#2,569 |
| 75. | North Royalton | 0.29% | 0.096%(+0.190)#75 | 0.22%(+0.066)#2,571 |
| 76. | Wadsworth | 0.28% | 0.096%(+0.182)#76 | 0.22%(+0.058)#2,621 |
| 77. | Fairfield | 0.28% | 0.096%(+0.180)#77 | 0.22%(+0.056)#2,633 |
| 78. | Lowellville | 0.27% | 0.096%(+0.176)#78 | 0.22%(+0.052)#2,665 |
| 79. | Bellevue | 0.27% | 0.096%(+0.172)#79 | 0.22%(+0.048)#2,696 |
| 80. | Silver Lake | 0.27% | 0.096%(+0.171)#80 | 0.22%(+0.047)#2,700 |
| 81. | Marietta | 0.26% | 0.096%(+0.166)#81 | 0.22%(+0.042)#2,737 |
| 82. | Wickliffe | 0.26% | 0.096%(+0.164)#82 | 0.22%(+0.041)#2,747 |
| 83. | Four Bridges | 0.26% | 0.096%(+0.160)#83 | 0.22%(+0.036)#2,781 |
| 84. | Middlefield | 0.25% | 0.096%(+0.158)#84 | 0.22%(+0.034)#2,793 |
| 85. | Mcdonald | 0.25% | 0.096%(+0.157)#85 | 0.22%(+0.033)#2,803 |
| 86. | New Lexington | 0.25% | 0.096%(+0.156)#86 | 0.22%(+0.032)#2,814 |
| 87. | Canton | 0.25% | 0.096%(+0.153)#87 | 0.22%(+0.029)#2,829 |
| 88. | Arlington | 0.25% | 0.096%(+0.152)#88 | 0.22%(+0.028)#2,836 |
| 89. | Englewood | 0.25% | 0.096%(+0.149)#89 | 0.22%(+0.026)#2,851 |
| 90. | Cheviot | 0.24% | 0.096%(+0.146)#90 | 0.22%(+0.022)#2,870 |
| 91. | Leetonia | 0.24% | 0.096%(+0.145)#91 | 0.22%(+0.021)#2,876 |
| 92. | White Oak | 0.24% | 0.096%(+0.145)#92 | 0.22%(+0.021)#2,878 |
| 93. | Green | 0.24% | 0.096%(+0.142)#93 | 0.22%(+0.018)#2,902 |
| 94. | Solon | 0.23% | 0.096%(+0.137)#94 | 0.22%(+0.013)#2,935 |
| 95. | Warren | 0.23% | 0.096%(+0.136)#95 | 0.22%(+0.012)#2,944 |
| 96. | Westfield Center | 0.23% | 0.096%(+0.132)#96 | 0.22%(+0.009)#2,969 |
| 97. | Park Layne | 0.23% | 0.096%(+0.130)#97 | 0.22%(+0.006)#2,986 |
| 98. | Austintown | 0.22% | 0.096%(+0.121)#98 | 0.22%(-0.003)#3,045 |
| 99. | Dent | 0.21% | 0.096%(+0.118)#99 | 0.22%(-0.006)#3,065 |
| 100. | Mansfield | 0.21% | 0.096%(+0.118)#100 | 0.22%(-0.006)#3,067 |
Common Questions
What are the Top 10 Cities with the Highest Percentage of Immigrants from Southern Europe in Ohio?
Top 10 Cities with the Highest Percentage of Immigrants from Southern Europe in Ohio are:
#1
3.20%
#2
2.45%
#3
1.54%
#4
1.46%
#5
1.33%
#6
1.33%
#7
1.28%
#8
1.16%
#9
1.14%
#10
1.07%
What city has the Highest Percentage of Immigrants from Southern Europe in Ohio?
Olde West Chester has the Highest Percentage of Immigrants from Southern Europe in Ohio with 3.20%.
What is the Percentage of Immigrants from Southern Europe in the State of Ohio?
Percentage of Immigrants from Southern Europe in Ohio is 0.096%.
What is the Percentage of Immigrants from Southern Europe in the United States?
Percentage of Immigrants from Southern Europe in the United States is 0.22%.