Cities with the Highest Percentage of Immigrants from Southern Europe in New Mexico
RELATED REPORTS & OPTIONS
Southern Europe
New Mexico
Compare Cities
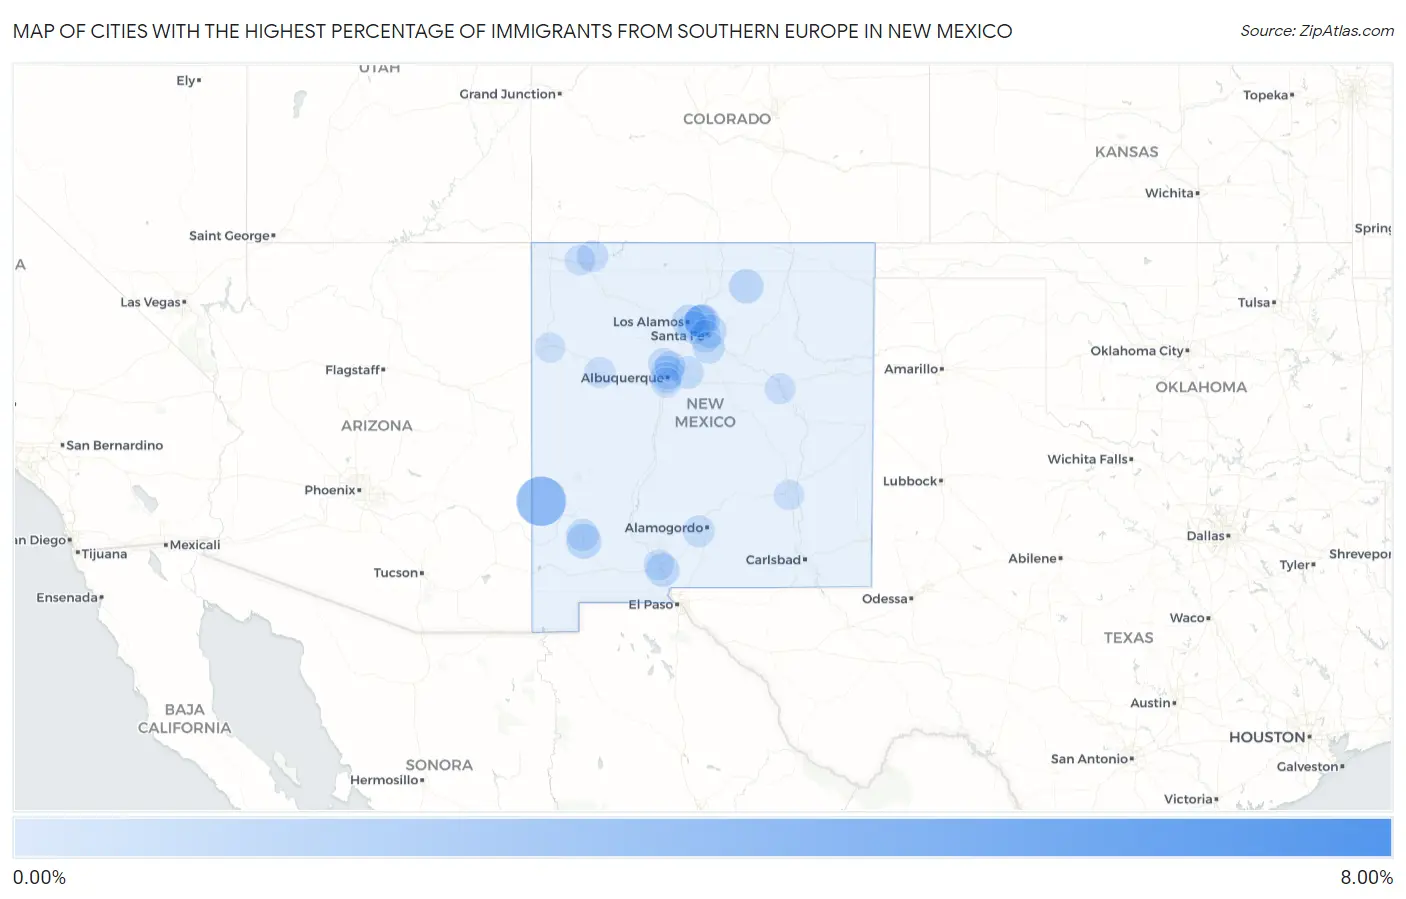
Map of Cities with the Highest Percentage of Immigrants from Southern Europe in New Mexico
0.00%
8.00%
Cities with the Highest Percentage of Immigrants from Southern Europe in New Mexico
| City | Southern Europe | vs State | vs National | |
| 1. | La Tierra | 6.06% | 0.088%(+5.97)#1 | 0.22%(+5.84)#57 |
| 2. | Pleasanton | 2.82% | 0.088%(+2.73)#2 | 0.22%(+2.60)#169 |
| 3. | Hurley | 0.70% | 0.088%(+0.616)#3 | 0.22%(+0.485)#1,177 |
| 4. | Angel Fire | 0.62% | 0.088%(+0.535)#4 | 0.22%(+0.403)#1,363 |
| 5. | Jacona | 0.56% | 0.088%(+0.467)#5 | 0.22%(+0.336)#1,526 |
| 6. | University Park | 0.51% | 0.088%(+0.422)#6 | 0.22%(+0.290)#1,650 |
| 7. | Los Ranchos De Albuquerque | 0.49% | 0.088%(+0.404)#7 | 0.22%(+0.272)#1,696 |
| 8. | Jaconita | 0.48% | 0.088%(+0.396)#8 | 0.22%(+0.264)#1,729 |
| 9. | Los Alamos | 0.47% | 0.088%(+0.380)#9 | 0.22%(+0.248)#1,778 |
| 10. | Tesuque | 0.45% | 0.088%(+0.357)#10 | 0.22%(+0.225)#1,857 |
| 11. | White Rock | 0.36% | 0.088%(+0.269)#11 | 0.22%(+0.138)#2,203 |
| 12. | Sandia Knolls | 0.35% | 0.088%(+0.266)#12 | 0.22%(+0.135)#2,221 |
| 13. | Santa Clara | 0.34% | 0.088%(+0.256)#13 | 0.22%(+0.124)#2,274 |
| 14. | Santa Fe | 0.33% | 0.088%(+0.244)#14 | 0.22%(+0.112)#2,336 |
| 15. | Tres Arroyos | 0.30% | 0.088%(+0.215)#15 | 0.22%(+0.083)#2,488 |
| 16. | Eldorado At Santa Fe | 0.27% | 0.088%(+0.186)#16 | 0.22%(+0.054)#2,644 |
| 17. | El Rancho | 0.26% | 0.088%(+0.176)#17 | 0.22%(+0.044)#2,720 |
| 18. | Holloman Afb | 0.24% | 0.088%(+0.151)#18 | 0.22%(+0.019)#2,889 |
| 19. | Placitas Cdp Sandoval County | 0.20% | 0.088%(+0.108)#19 | 0.22%(-0.023)#3,219 |
| 20. | Rio Rancho | 0.20% | 0.088%(+0.108)#20 | 0.22%(-0.024)#3,222 |
| 21. | Aztec | 0.16% | 0.088%(+0.072)#21 | 0.22%(-0.059)#3,540 |
| 22. | Albuquerque | 0.15% | 0.088%(+0.060)#22 | 0.22%(-0.071)#3,646 |
| 23. | Santa Rosa | 0.11% | 0.088%(+0.021)#23 | 0.22%(-0.111)#4,091 |
| 24. | Grants | 0.11% | 0.088%(+0.021)#24 | 0.22%(-0.111)#4,094 |
| 25. | Corrales | 0.11% | 0.088%(+0.018)#25 | 0.22%(-0.114)#4,121 |
| 26. | Las Cruces | 0.10% | 0.088%(+0.014)#26 | 0.22%(-0.118)#4,160 |
| 27. | Farmington | 0.090% | 0.088%(+0.002)#27 | 0.22%(-0.130)#4,317 |
| 28. | Roswell | 0.048% | 0.088%(-0.041)#28 | 0.22%(-0.172)#4,827 |
| 29. | Gallup | 0.042% | 0.088%(-0.047)#29 | 0.22%(-0.179)#4,906 |
| 30. | South Valley | 0.029% | 0.088%(-0.059)#30 | 0.22%(-0.191)#5,054 |
Common Questions
What are the Top 10 Cities with the Highest Percentage of Immigrants from Southern Europe in New Mexico?
Top 10 Cities with the Highest Percentage of Immigrants from Southern Europe in New Mexico are:
#1
2.82%
#2
0.70%
#3
0.62%
#4
0.56%
#5
0.51%
#6
0.49%
#7
0.48%
#8
0.47%
#9
0.45%
#10
0.36%
What city has the Highest Percentage of Immigrants from Southern Europe in New Mexico?
Pleasanton has the Highest Percentage of Immigrants from Southern Europe in New Mexico with 2.82%.
What is the Percentage of Immigrants from Southern Europe in the State of New Mexico?
Percentage of Immigrants from Southern Europe in New Mexico is 0.088%.
What is the Percentage of Immigrants from Southern Europe in the United States?
Percentage of Immigrants from Southern Europe in the United States is 0.22%.