Cities with the Highest Percentage of Immigrants from Southern Europe in Delaware
RELATED REPORTS & OPTIONS
Southern Europe
Delaware
Compare Cities
Map of Cities with the Highest Percentage of Immigrants from Southern Europe in Delaware
0.00%
3.00%
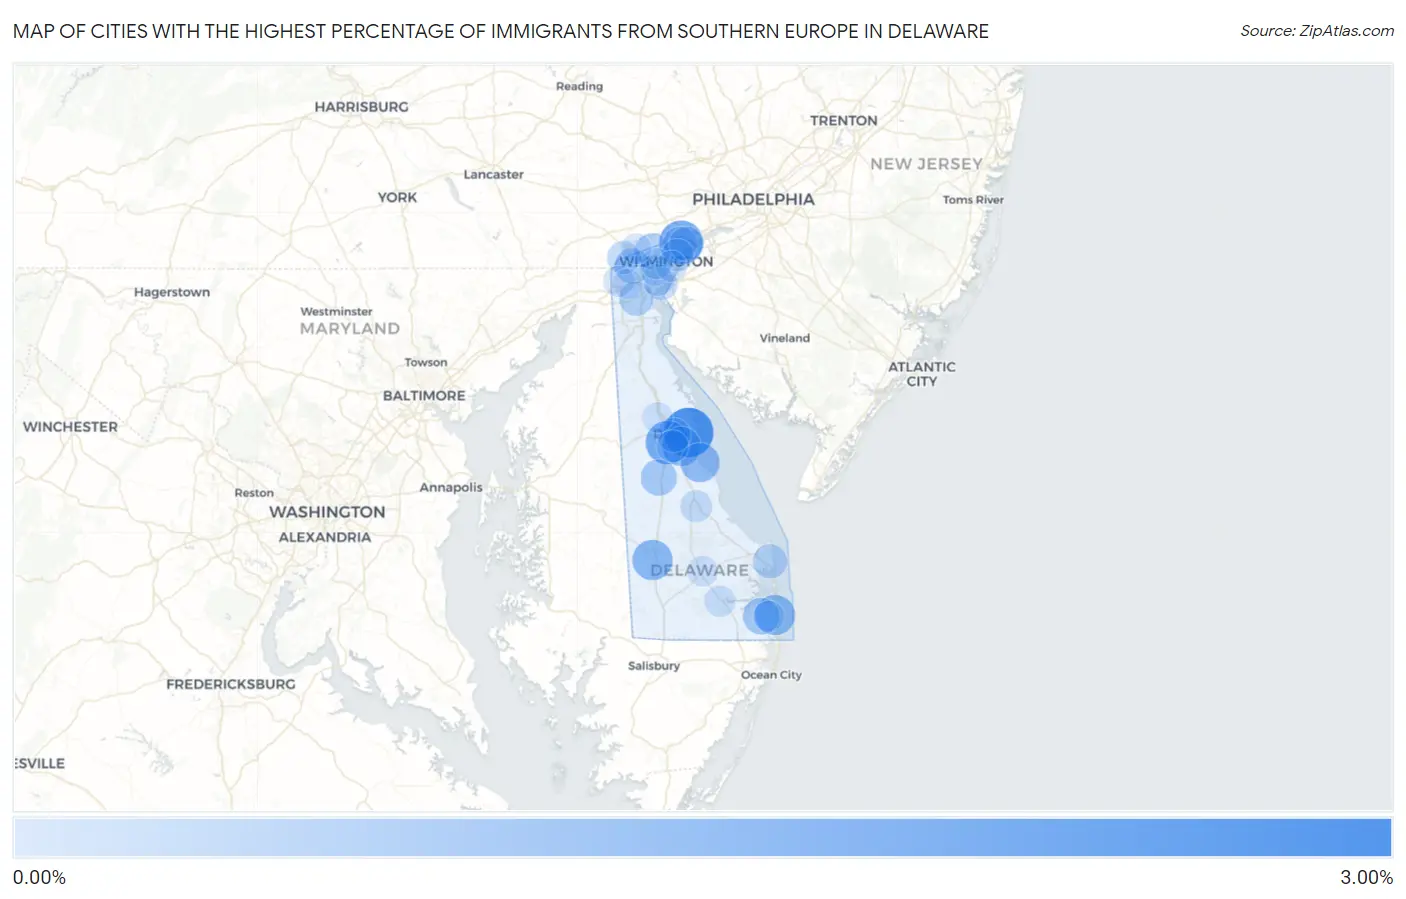
Cities with the Highest Percentage of Immigrants from Southern Europe in Delaware
| City | Southern Europe | vs State | vs National | |
| 1. | Little Creek | 2.57% | 0.18%(+2.40)#1 | 0.22%(+2.35)#200 |
| 2. | Ardentown | 1.79% | 0.18%(+1.62)#2 | 0.22%(+1.57)#338 |
| 3. | Rodney Village | 1.76% | 0.18%(+1.59)#3 | 0.22%(+1.54)#349 |
| 4. | Bethany Beach | 1.32% | 0.18%(+1.14)#4 | 0.22%(+1.10)#531 |
| 5. | Bridgeville | 1.31% | 0.18%(+1.14)#5 | 0.22%(+1.09)#534 |
| 6. | Dover Base Housing | 1.20% | 0.18%(+1.02)#6 | 0.22%(+0.976)#599 |
| 7. | Bowers | 1.19% | 0.18%(+1.02)#7 | 0.22%(+0.970)#603 |
| 8. | Millville | 0.83% | 0.18%(+0.653)#8 | 0.22%(+0.608)#956 |
| 9. | Felton | 0.79% | 0.18%(+0.617)#9 | 0.22%(+0.572)#1,017 |
| 10. | Greenville | 0.74% | 0.18%(+0.569)#10 | 0.22%(+0.524)#1,079 |
| 11. | Pike Creek Valley | 0.66% | 0.18%(+0.489)#11 | 0.22%(+0.444)#1,267 |
| 12. | Ardencroft | 0.53% | 0.18%(+0.351)#12 | 0.22%(+0.306)#1,600 |
| 13. | Claymont | 0.52% | 0.18%(+0.345)#13 | 0.22%(+0.300)#1,619 |
| 14. | Rehoboth Beach | 0.52% | 0.18%(+0.341)#14 | 0.22%(+0.296)#1,629 |
| 15. | Bear | 0.49% | 0.18%(+0.319)#15 | 0.22%(+0.274)#1,691 |
| 16. | Dover | 0.49% | 0.18%(+0.314)#16 | 0.22%(+0.269)#1,710 |
| 17. | North Star | 0.38% | 0.18%(+0.207)#17 | 0.22%(+0.162)#2,089 |
| 18. | New Castle | 0.33% | 0.18%(+0.151)#18 | 0.22%(+0.106)#2,371 |
| 19. | Bellefonte | 0.26% | 0.18%(+0.087)#19 | 0.22%(+0.042)#2,736 |
| 20. | Highland Acres | 0.23% | 0.18%(+0.056)#20 | 0.22%(+0.011)#2,955 |
| 21. | Milford | 0.23% | 0.18%(+0.055)#21 | 0.22%(+0.010)#2,962 |
| 22. | Newport | 0.17% | 0.18%(-0.000)#22 | 0.22%(-0.045)#3,423 |
| 23. | Wilmington Manor | 0.17% | 0.18%(-0.006)#23 | 0.22%(-0.051)#3,462 |
| 24. | Millsboro | 0.13% | 0.18%(-0.044)#24 | 0.22%(-0.089)#3,834 |
| 25. | Elsmere | 0.13% | 0.18%(-0.046)#25 | 0.22%(-0.091)#3,860 |
| 26. | Wilmington | 0.13% | 0.18%(-0.048)#26 | 0.22%(-0.093)#3,881 |
| 27. | Ocean View | 0.11% | 0.18%(-0.062)#27 | 0.22%(-0.107)#4,060 |
| 28. | Newark | 0.10% | 0.18%(-0.074)#28 | 0.22%(-0.119)#4,177 |
| 29. | Cheswold | 0.061% | 0.18%(-0.114)#29 | 0.22%(-0.159)#4,667 |
| 30. | Hockessin | 0.058% | 0.18%(-0.117)#30 | 0.22%(-0.162)#4,718 |
| 31. | Georgetown | 0.028% | 0.18%(-0.148)#31 | 0.22%(-0.192)#5,071 |
| 32. | Brookside | 0.0070% | 0.18%(-0.168)#32 | 0.22%(-0.213)#5,284 |
1
Common Questions
What are the Top 10 Cities with the Highest Percentage of Immigrants from Southern Europe in Delaware?
Top 10 Cities with the Highest Percentage of Immigrants from Southern Europe in Delaware are:
#1
2.57%
#2
1.79%
#3
1.76%
#4
1.32%
#5
1.31%
#6
1.20%
#7
1.19%
#8
0.83%
#9
0.79%
#10
0.74%
What city has the Highest Percentage of Immigrants from Southern Europe in Delaware?
Little Creek has the Highest Percentage of Immigrants from Southern Europe in Delaware with 2.57%.
What is the Percentage of Immigrants from Southern Europe in the State of Delaware?
Percentage of Immigrants from Southern Europe in Delaware is 0.18%.
What is the Percentage of Immigrants from Southern Europe in the United States?
Percentage of Immigrants from Southern Europe in the United States is 0.22%.