Cities with the Highest Percentage of Federal Government Employees in Massachusetts
RELATED REPORTS & OPTIONS
Federal Government Employees
Massachusetts
Compare Cities
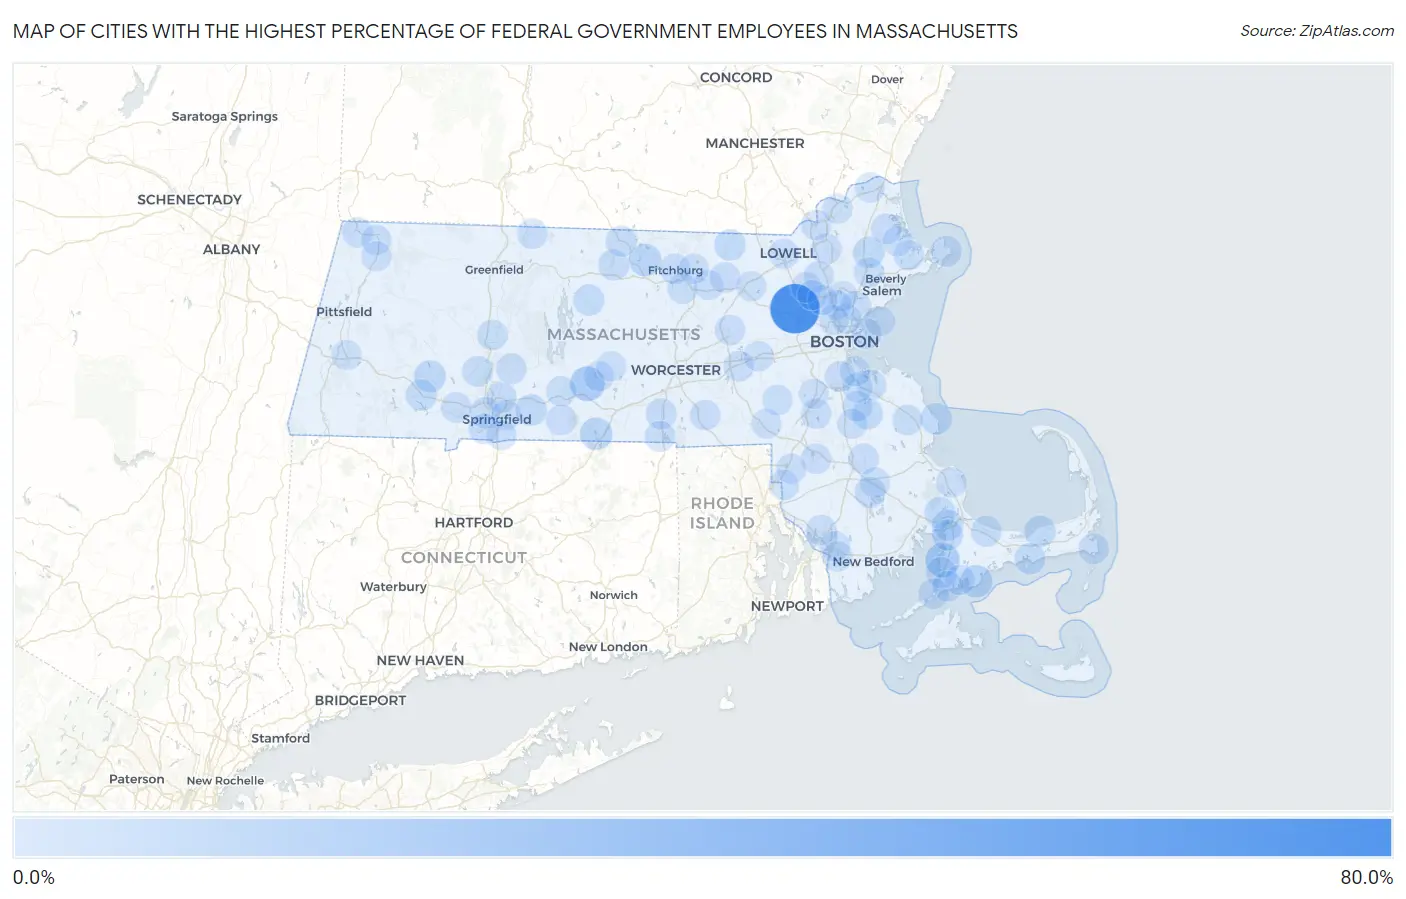
Map of Cities with the Highest Percentage of Federal Government Employees in Massachusetts
0.0%
80.0%
Cities with the Highest Percentage of Federal Government Employees in Massachusetts
| City | % Federal Government Employees | vs State | vs National | |
| 1. | Hanscom Afb | 79.1% | 1.8%(+77.3)#1 | 3.4%(+75.7)#75 |
| 2. | Warren | 19.4% | 1.8%(+17.6)#2 | 3.4%(+16.0)#880 |
| 3. | North Falmouth | 17.9% | 1.8%(+16.1)#3 | 3.4%(+14.6)#987 |
| 4. | Holland | 10.6% | 1.8%(+8.80)#4 | 3.4%(+7.23)#2,054 |
| 5. | West Warren | 10.6% | 1.8%(+8.80)#5 | 3.4%(+7.23)#2,055 |
| 6. | New Seabury | 10.5% | 1.8%(+8.72)#6 | 3.4%(+7.15)#2,071 |
| 7. | South Ashburnham | 10.5% | 1.8%(+8.65)#7 | 3.4%(+7.09)#2,087 |
| 8. | Huntington | 7.7% | 1.8%(+5.88)#8 | 3.4%(+4.31)#3,027 |
| 9. | Ocean Bluff Brant Rock | 7.2% | 1.8%(+5.40)#9 | 3.4%(+3.83)#3,276 |
| 10. | Topsfield | 7.0% | 1.8%(+5.23)#10 | 3.4%(+3.66)#3,360 |
| 11. | Dennis | 7.0% | 1.8%(+5.22)#11 | 3.4%(+3.66)#3,363 |
| 12. | Wilbraham | 6.5% | 1.8%(+4.64)#12 | 3.4%(+3.08)#3,700 |
| 13. | White Island Shores | 6.3% | 1.8%(+4.51)#13 | 3.4%(+2.94)#3,788 |
| 14. | Buzzards Bay | 6.1% | 1.8%(+4.30)#14 | 3.4%(+2.73)#3,949 |
| 15. | East Pepperell | 5.9% | 1.8%(+4.05)#15 | 3.4%(+2.48)#4,155 |
| 16. | Blandford | 5.7% | 1.8%(+3.87)#16 | 3.4%(+2.30)#4,296 |
| 17. | West Yarmouth | 5.6% | 1.8%(+3.81)#17 | 3.4%(+2.25)#4,349 |
| 18. | Petersham | 5.5% | 1.8%(+3.71)#18 | 3.4%(+2.14)#4,446 |
| 19. | Monument Beach | 5.2% | 1.8%(+3.35)#19 | 3.4%(+1.79)#4,790 |
| 20. | Abington | 5.1% | 1.8%(+3.34)#20 | 3.4%(+1.77)#4,808 |
| 21. | Baldwinville | 5.0% | 1.8%(+3.14)#21 | 3.4%(+1.57)#5,011 |
| 22. | West Springfield Town | 4.7% | 1.8%(+2.84)#22 | 3.4%(+1.27)#5,365 |
| 23. | North Lakeville | 4.6% | 1.8%(+2.82)#23 | 3.4%(+1.25)#5,398 |
| 24. | Winchendon | 4.6% | 1.8%(+2.76)#24 | 3.4%(+1.19)#5,454 |
| 25. | West Falmouth | 4.5% | 1.8%(+2.70)#25 | 3.4%(+1.13)#5,539 |
| 26. | Rockport | 4.3% | 1.8%(+2.46)#26 | 3.4%(+0.896)#5,880 |
| 27. | Oxford | 4.3% | 1.8%(+2.46)#27 | 3.4%(+0.889)#5,890 |
| 28. | East Sandwich | 4.0% | 1.8%(+2.21)#28 | 3.4%(+0.647)#6,266 |
| 29. | Easthampton Town | 3.9% | 1.8%(+2.12)#29 | 3.4%(+0.557)#6,423 |
| 30. | Winthrop Town | 3.9% | 1.8%(+2.08)#30 | 3.4%(+0.512)#6,495 |
| 31. | Chicopee | 3.8% | 1.8%(+1.98)#31 | 3.4%(+0.417)#6,656 |
| 32. | Andover | 3.7% | 1.8%(+1.90)#32 | 3.4%(+0.332)#6,781 |
| 33. | Woods Hole | 3.7% | 1.8%(+1.87)#33 | 3.4%(+0.299)#6,843 |
| 34. | Hatfield | 3.7% | 1.8%(+1.86)#34 | 3.4%(+0.291)#6,863 |
| 35. | Webster | 3.7% | 1.8%(+1.85)#35 | 3.4%(+0.281)#6,875 |
| 36. | Granby | 3.5% | 1.8%(+1.71)#36 | 3.4%(+0.138)#7,156 |
| 37. | Ayer | 3.5% | 1.8%(+1.68)#37 | 3.4%(+0.111)#7,200 |
| 38. | Chatham | 3.5% | 1.8%(+1.67)#38 | 3.4%(+0.106)#7,209 |
| 39. | Falmouth | 3.4% | 1.8%(+1.61)#39 | 3.4%(+0.039)#7,348 |
| 40. | Pinehurst | 3.3% | 1.8%(+1.49)#40 | 3.4%(-0.079)#7,587 |
| 41. | Monson Center | 3.3% | 1.8%(+1.47)#41 | 3.4%(-0.095)#7,633 |
| 42. | Westfield | 3.3% | 1.8%(+1.45)#42 | 3.4%(-0.119)#7,692 |
| 43. | Rowley | 3.2% | 1.8%(+1.43)#43 | 3.4%(-0.136)#7,729 |
| 44. | Fitchburg | 3.2% | 1.8%(+1.41)#44 | 3.4%(-0.160)#7,788 |
| 45. | Bridgewater Town | 3.2% | 1.8%(+1.36)#45 | 3.4%(-0.209)#7,910 |
| 46. | Cordaville | 3.2% | 1.8%(+1.35)#46 | 3.4%(-0.218)#7,932 |
| 47. | Northfield | 3.1% | 1.8%(+1.33)#47 | 3.4%(-0.241)#7,997 |
| 48. | Williamstown | 3.1% | 1.8%(+1.31)#48 | 3.4%(-0.256)#8,042 |
| 49. | Milton | 3.1% | 1.8%(+1.27)#49 | 3.4%(-0.301)#8,148 |
| 50. | Whitinsville | 3.1% | 1.8%(+1.26)#50 | 3.4%(-0.303)#8,160 |
| 51. | Norton Center | 3.1% | 1.8%(+1.25)#51 | 3.4%(-0.319)#8,194 |
| 52. | Methuen Town | 2.9% | 1.8%(+1.13)#52 | 3.4%(-0.434)#8,475 |
| 53. | Agawam Town | 2.9% | 1.8%(+1.07)#53 | 3.4%(-0.495)#8,629 |
| 54. | Sharon | 2.9% | 1.8%(+1.05)#54 | 3.4%(-0.513)#8,677 |
| 55. | Somerset | 2.8% | 1.8%(+1.02)#55 | 3.4%(-0.547)#8,781 |
| 56. | Palmer Town | 2.8% | 1.8%(+0.989)#56 | 3.4%(-0.579)#8,855 |
| 57. | North Pembroke | 2.8% | 1.8%(+0.969)#57 | 3.4%(-0.598)#8,902 |
| 58. | Leominster | 2.7% | 1.8%(+0.904)#58 | 3.4%(-0.664)#9,086 |
| 59. | Essex | 2.6% | 1.8%(+0.819)#59 | 3.4%(-0.749)#9,335 |
| 60. | Weymouth Town | 2.6% | 1.8%(+0.770)#60 | 3.4%(-0.797)#9,494 |
| 61. | Wilmington | 2.6% | 1.8%(+0.765)#61 | 3.4%(-0.803)#9,516 |
| 62. | Holbrook | 2.5% | 1.8%(+0.733)#62 | 3.4%(-0.835)#9,605 |
| 63. | Hudson | 2.5% | 1.8%(+0.702)#63 | 3.4%(-0.865)#9,704 |
| 64. | North Adams | 2.5% | 1.8%(+0.701)#64 | 3.4%(-0.867)#9,715 |
| 65. | Saugus | 2.5% | 1.8%(+0.690)#65 | 3.4%(-0.878)#9,776 |
| 66. | North Seekonk | 2.5% | 1.8%(+0.651)#66 | 3.4%(-0.916)#9,896 |
| 67. | Millis Clicquot | 2.5% | 1.8%(+0.649)#67 | 3.4%(-0.919)#9,901 |
| 68. | Malden | 2.5% | 1.8%(+0.645)#68 | 3.4%(-0.922)#9,914 |
| 69. | Framingham | 2.4% | 1.8%(+0.636)#69 | 3.4%(-0.932)#9,946 |
| 70. | Springfield | 2.4% | 1.8%(+0.592)#70 | 3.4%(-0.976)#10,123 |
| 71. | West Brookfield | 2.4% | 1.8%(+0.545)#71 | 3.4%(-1.02)#10,274 |
| 72. | North Brookfield | 2.3% | 1.8%(+0.514)#72 | 3.4%(-1.05)#10,382 |
| 73. | Wakefield | 2.3% | 1.8%(+0.497)#73 | 3.4%(-1.07)#10,442 |
| 74. | Haverhill | 2.3% | 1.8%(+0.462)#74 | 3.4%(-1.11)#10,568 |
| 75. | Lee | 2.3% | 1.8%(+0.460)#75 | 3.4%(-1.11)#10,573 |
| 76. | Brockton | 2.3% | 1.8%(+0.453)#76 | 3.4%(-1.11)#10,595 |
| 77. | Ipswich | 2.3% | 1.8%(+0.443)#77 | 3.4%(-1.13)#10,633 |
| 78. | Littleton Common | 2.2% | 1.8%(+0.424)#78 | 3.4%(-1.14)#10,704 |
| 79. | Franklin Town | 2.2% | 1.8%(+0.343)#79 | 3.4%(-1.22)#11,036 |
| 80. | Braintree Town | 2.1% | 1.8%(+0.333)#80 | 3.4%(-1.23)#11,070 |
| 81. | Fall River | 2.1% | 1.8%(+0.315)#81 | 3.4%(-1.25)#11,147 |
| 82. | Danvers | 2.1% | 1.8%(+0.296)#82 | 3.4%(-1.27)#11,221 |
| 83. | Attleboro | 2.1% | 1.8%(+0.294)#83 | 3.4%(-1.27)#11,233 |
| 84. | Quincy | 2.1% | 1.8%(+0.288)#84 | 3.4%(-1.28)#11,254 |
| 85. | Lowell | 2.1% | 1.8%(+0.271)#85 | 3.4%(-1.30)#11,337 |
| 86. | Stoneham | 2.1% | 1.8%(+0.253)#86 | 3.4%(-1.31)#11,399 |
| 87. | Amesbury Town | 2.0% | 1.8%(+0.226)#87 | 3.4%(-1.34)#11,502 |
| 88. | North Westport | 2.0% | 1.8%(+0.168)#88 | 3.4%(-1.40)#11,751 |
| 89. | East Falmouth | 2.0% | 1.8%(+0.160)#89 | 3.4%(-1.41)#11,778 |
| 90. | Middleborough Center | 2.0% | 1.8%(+0.153)#90 | 3.4%(-1.41)#11,795 |
| 91. | Shirley | 2.0% | 1.8%(+0.148)#91 | 3.4%(-1.42)#11,822 |
| 92. | Adams | 1.9% | 1.8%(+0.134)#92 | 3.4%(-1.43)#11,885 |
| 93. | Medford | 1.9% | 1.8%(+0.132)#93 | 3.4%(-1.44)#11,892 |
| 94. | Woburn | 1.9% | 1.8%(+0.115)#94 | 3.4%(-1.45)#11,943 |
| 95. | Burlington | 1.9% | 1.8%(+0.095)#95 | 3.4%(-1.47)#12,021 |
| 96. | The Pinehills | 1.9% | 1.8%(+0.066)#96 | 3.4%(-1.50)#12,162 |
| 97. | Norwood | 1.9% | 1.8%(+0.057)#97 | 3.4%(-1.51)#12,199 |
| 98. | Nahant | 1.9% | 1.8%(+0.056)#98 | 3.4%(-1.51)#12,204 |
| 99. | Lunenburg | 1.9% | 1.8%(+0.053)#99 | 3.4%(-1.51)#12,211 |
| 100. | Longmeadow | 1.8% | 1.8%(+0.000)#100 | 3.4%(-1.57)#12,453 |
Common Questions
What are the Top 10 Cities with the Highest Percentage of Federal Government Employees in Massachusetts?
Top 10 Cities with the Highest Percentage of Federal Government Employees in Massachusetts are:
#1
79.1%
#2
19.4%
#3
17.9%
#4
10.6%
#5
10.5%
#6
10.5%
#7
7.7%
#8
7.2%
#9
7.0%
#10
7.0%
What city has the Highest Percentage of Federal Government Employees in Massachusetts?
Hanscom AFB has the Highest Percentage of Federal Government Employees in Massachusetts with 79.1%.
What is the Percentage of Federal Government Employees in the State of Massachusetts?
Percentage of Federal Government Employees in Massachusetts is 1.8%.
What is the Percentage of Federal Government Employees in the United States?
Percentage of Federal Government Employees in the United States is 3.4%.