Cities with the Highest Percentage of Federal Government Employees in Oregon
RELATED REPORTS & OPTIONS
Federal Government Employees
Oregon
Compare Cities
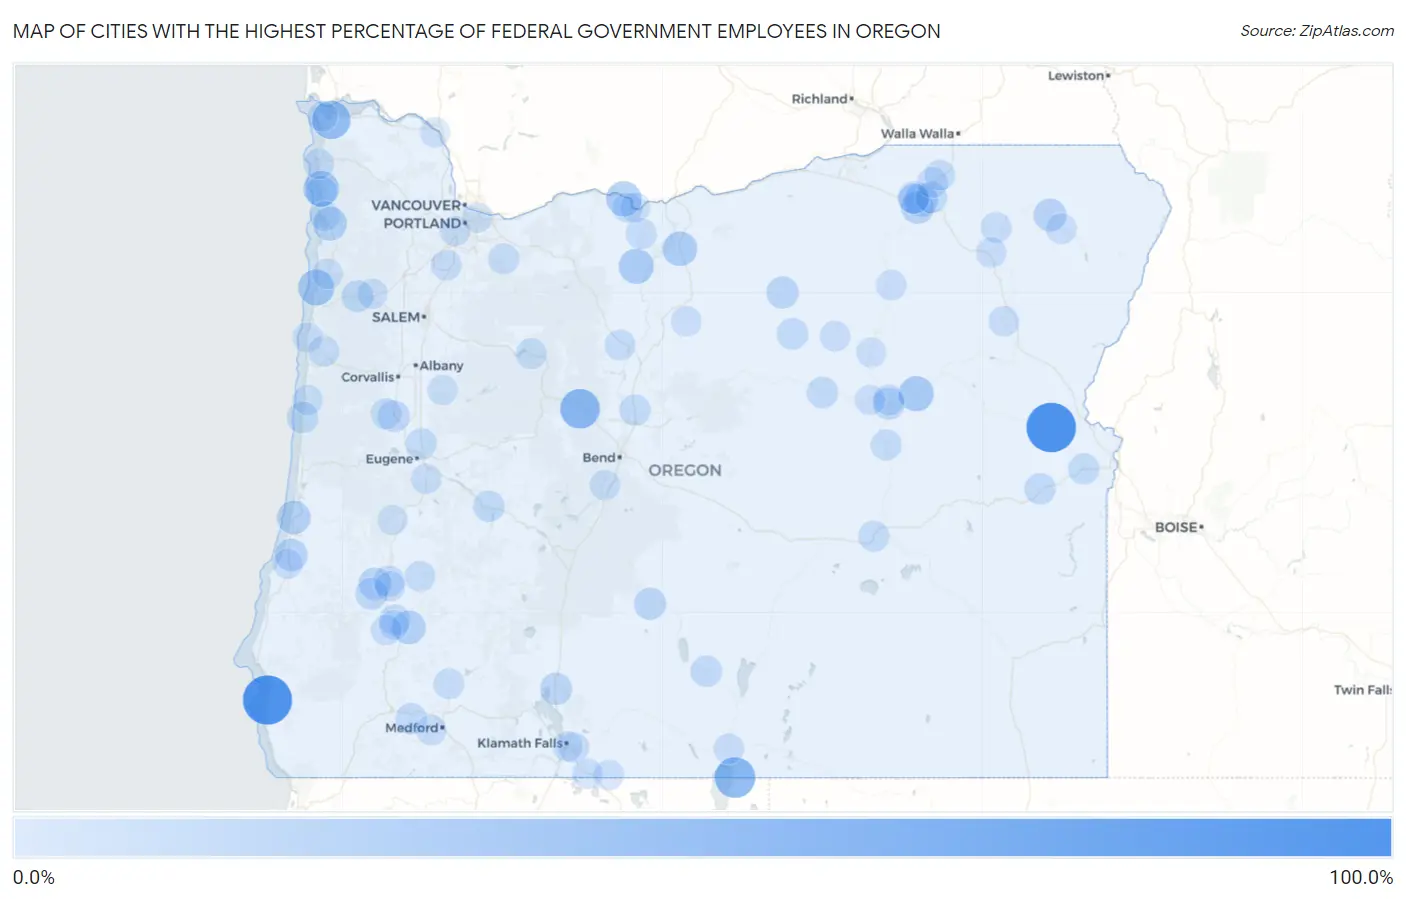
Map of Cities with the Highest Percentage of Federal Government Employees in Oregon
0.0%
100.0%
Cities with the Highest Percentage of Federal Government Employees in Oregon
| City | % Federal Government Employees | vs State | vs National | |
| 1. | Brogan | 100.0% | 2.1%(+97.9)#1 | 3.4%(+96.6)#17 |
| 2. | Nesika Beach | 98.2% | 2.1%(+96.2)#2 | 3.4%(+94.9)#22 |
| 3. | New Pine Creek | 54.3% | 2.1%(+52.2)#3 | 3.4%(+50.9)#152 |
| 4. | Black Butte Ranch | 50.0% | 2.1%(+47.9)#4 | 3.4%(+46.6)#171 |
| 5. | Jeffers Gardens | 44.0% | 2.1%(+41.9)#5 | 3.4%(+40.6)#213 |
| 6. | Fort Klamath | 43.8% | 2.1%(+41.7)#6 | 3.4%(+40.4)#217 |
| 7. | Neskowin | 32.3% | 2.1%(+30.2)#7 | 3.4%(+28.9)#358 |
| 8. | Neahkahnie | 30.8% | 2.1%(+28.8)#8 | 3.4%(+27.5)#385 |
| 9. | Prairie City | 27.5% | 2.1%(+25.5)#9 | 3.4%(+24.2)#466 |
| 10. | Rowena | 27.3% | 2.1%(+25.2)#10 | 3.4%(+23.9)#475 |
| 11. | Tygh Valley | 27.3% | 2.1%(+25.2)#11 | 3.4%(+23.9)#476 |
| 12. | Grass Valley | 24.6% | 2.1%(+22.5)#12 | 3.4%(+21.2)#587 |
| 13. | Elmira | 22.5% | 2.1%(+20.4)#13 | 3.4%(+19.1)#691 |
| 14. | Heceta Beach | 22.0% | 2.1%(+19.9)#14 | 3.4%(+18.6)#726 |
| 15. | Idaville | 21.9% | 2.1%(+19.8)#15 | 3.4%(+18.5)#734 |
| 16. | Days Creek | 21.1% | 2.1%(+19.0)#16 | 3.4%(+17.7)#773 |
| 17. | Winchester Bay | 20.9% | 2.1%(+18.9)#17 | 3.4%(+17.6)#777 |
| 18. | Mission | 18.8% | 2.1%(+16.8)#18 | 3.4%(+15.5)#929 |
| 19. | Tutuilla | 17.5% | 2.1%(+15.4)#19 | 3.4%(+14.1)#1,036 |
| 20. | Wallowa | 17.1% | 2.1%(+15.0)#20 | 3.4%(+13.7)#1,068 |
| 21. | Glasgow | 16.2% | 2.1%(+14.2)#21 | 3.4%(+12.9)#1,146 |
| 22. | Melrose | 15.1% | 2.1%(+13.0)#22 | 3.4%(+11.7)#1,284 |
| 23. | Lonerock | 14.3% | 2.1%(+12.2)#23 | 3.4%(+10.9)#1,398 |
| 24. | Silver Lake | 14.0% | 2.1%(+11.9)#24 | 3.4%(+10.6)#1,444 |
| 25. | Chiloquin | 13.8% | 2.1%(+11.7)#25 | 3.4%(+10.4)#1,471 |
| 26. | Riverside | 13.5% | 2.1%(+11.4)#26 | 3.4%(+10.1)#1,512 |
| 27. | Canyon City | 12.9% | 2.1%(+10.9)#27 | 3.4%(+9.57)#1,596 |
| 28. | Lookingglass | 12.7% | 2.1%(+10.7)#28 | 3.4%(+9.36)#1,620 |
| 29. | Monroe | 12.5% | 2.1%(+10.5)#29 | 3.4%(+9.15)#1,650 |
| 30. | Grand Ronde | 11.4% | 2.1%(+9.37)#30 | 3.4%(+8.07)#1,868 |
| 31. | Spray | 11.3% | 2.1%(+9.25)#31 | 3.4%(+7.94)#1,902 |
| 32. | Oakridge | 11.0% | 2.1%(+8.89)#32 | 3.4%(+7.58)#1,973 |
| 33. | Paisley | 10.8% | 2.1%(+8.71)#33 | 3.4%(+7.41)#2,014 |
| 34. | Foots Creek | 10.7% | 2.1%(+8.59)#34 | 3.4%(+7.29)#2,042 |
| 35. | Dayville | 10.6% | 2.1%(+8.50)#35 | 3.4%(+7.20)#2,062 |
| 36. | Cayuse | 10.5% | 2.1%(+8.45)#36 | 3.4%(+7.15)#2,076 |
| 37. | Yachats | 10.4% | 2.1%(+8.36)#37 | 3.4%(+7.05)#2,091 |
| 38. | Harper | 10.3% | 2.1%(+8.22)#38 | 3.4%(+6.92)#2,129 |
| 39. | Roseburg North | 9.7% | 2.1%(+7.64)#39 | 3.4%(+6.34)#2,275 |
| 40. | Terrebonne | 9.5% | 2.1%(+7.41)#40 | 3.4%(+6.11)#2,353 |
| 41. | Manzanita | 9.3% | 2.1%(+7.26)#41 | 3.4%(+5.96)#2,402 |
| 42. | Coburg | 9.3% | 2.1%(+7.24)#42 | 3.4%(+5.93)#2,413 |
| 43. | Vale | 9.0% | 2.1%(+6.90)#43 | 3.4%(+5.59)#2,533 |
| 44. | Myrtle Creek | 8.9% | 2.1%(+6.82)#44 | 3.4%(+5.52)#2,556 |
| 45. | Hines | 8.4% | 2.1%(+6.37)#45 | 3.4%(+5.06)#2,742 |
| 46. | Seneca | 8.2% | 2.1%(+6.16)#46 | 3.4%(+4.86)#2,826 |
| 47. | Siletz | 8.2% | 2.1%(+6.11)#47 | 3.4%(+4.81)#2,842 |
| 48. | Keno | 8.2% | 2.1%(+6.10)#48 | 3.4%(+4.80)#2,848 |
| 49. | John Day | 8.1% | 2.1%(+6.04)#49 | 3.4%(+4.74)#2,880 |
| 50. | Dufur | 8.0% | 2.1%(+5.91)#50 | 3.4%(+4.61)#2,919 |
| 51. | Estacada | 7.9% | 2.1%(+5.85)#51 | 3.4%(+4.54)#2,941 |
| 52. | Idanha | 7.8% | 2.1%(+5.77)#52 | 3.4%(+4.47)#2,972 |
| 53. | Shady Cove | 7.6% | 2.1%(+5.52)#53 | 3.4%(+4.21)#3,081 |
| 54. | Alpine | 7.5% | 2.1%(+5.47)#54 | 3.4%(+4.17)#3,100 |
| 55. | Butteville | 7.5% | 2.1%(+5.40)#55 | 3.4%(+4.10)#3,136 |
| 56. | Glide | 7.4% | 2.1%(+5.31)#56 | 3.4%(+4.01)#3,179 |
| 57. | Warm Springs | 7.4% | 2.1%(+5.29)#57 | 3.4%(+3.98)#3,195 |
| 58. | Running Y Ranch | 7.1% | 2.1%(+5.03)#58 | 3.4%(+3.73)#3,328 |
| 59. | Adams | 7.1% | 2.1%(+5.03)#59 | 3.4%(+3.72)#3,329 |
| 60. | Athena | 7.0% | 2.1%(+4.88)#60 | 3.4%(+3.58)#3,415 |
| 61. | Cannon Beach | 6.8% | 2.1%(+4.75)#61 | 3.4%(+3.45)#3,494 |
| 62. | Summerville | 6.8% | 2.1%(+4.71)#62 | 3.4%(+3.40)#3,530 |
| 63. | Monument | 6.6% | 2.1%(+4.48)#63 | 3.4%(+3.18)#3,645 |
| 64. | Ukiah | 6.5% | 2.1%(+4.45)#64 | 3.4%(+3.14)#3,669 |
| 65. | Waldport | 6.3% | 2.1%(+4.25)#65 | 3.4%(+2.95)#3,782 |
| 66. | Chenoweth | 6.3% | 2.1%(+4.18)#66 | 3.4%(+2.88)#3,823 |
| 67. | Bayshore | 6.2% | 2.1%(+4.18)#67 | 3.4%(+2.87)#3,829 |
| 68. | Riddle | 6.2% | 2.1%(+4.14)#68 | 3.4%(+2.84)#3,864 |
| 69. | Lostine | 6.2% | 2.1%(+4.13)#69 | 3.4%(+2.83)#3,868 |
| 70. | Lakeview | 6.2% | 2.1%(+4.10)#70 | 3.4%(+2.80)#3,888 |
| 71. | Mckay | 6.2% | 2.1%(+4.08)#71 | 3.4%(+2.78)#3,906 |
| 72. | Sunriver | 6.0% | 2.1%(+3.97)#72 | 3.4%(+2.66)#3,998 |
| 73. | Antelope | 6.0% | 2.1%(+3.93)#73 | 3.4%(+2.62)#4,034 |
| 74. | Haines | 6.0% | 2.1%(+3.88)#74 | 3.4%(+2.57)#4,075 |
| 75. | Cloverdale | 6.0% | 2.1%(+3.88)#75 | 3.4%(+2.57)#4,076 |
| 76. | Jacksonville | 5.9% | 2.1%(+3.81)#76 | 3.4%(+2.51)#4,120 |
| 77. | Falcon Heights | 5.8% | 2.1%(+3.68)#77 | 3.4%(+2.37)#4,240 |
| 78. | Altamont | 5.7% | 2.1%(+3.66)#78 | 3.4%(+2.35)#4,257 |
| 79. | Gopher Flats | 5.7% | 2.1%(+3.64)#79 | 3.4%(+2.34)#4,273 |
| 80. | Island City | 5.7% | 2.1%(+3.59)#80 | 3.4%(+2.28)#4,313 |
| 81. | Dunthorpe | 5.5% | 2.1%(+3.47)#81 | 3.4%(+2.17)#4,428 |
| 82. | Creswell | 5.5% | 2.1%(+3.43)#82 | 3.4%(+2.13)#4,455 |
| 83. | Mount Vernon | 5.5% | 2.1%(+3.39)#83 | 3.4%(+2.08)#4,490 |
| 84. | Roseburg | 5.5% | 2.1%(+3.38)#84 | 3.4%(+2.08)#4,499 |
| 85. | Klamath Falls | 5.4% | 2.1%(+3.31)#85 | 3.4%(+2.00)#4,572 |
| 86. | Warrenton | 5.4% | 2.1%(+3.30)#86 | 3.4%(+1.99)#4,583 |
| 87. | Garden Home Whitford | 5.3% | 2.1%(+3.22)#87 | 3.4%(+1.92)#4,659 |
| 88. | Willamina | 5.3% | 2.1%(+3.20)#88 | 3.4%(+1.90)#4,674 |
| 89. | Malin | 5.2% | 2.1%(+3.08)#89 | 3.4%(+1.77)#4,801 |
| 90. | Merrill | 5.0% | 2.1%(+2.97)#90 | 3.4%(+1.67)#4,915 |
| 91. | Sodaville | 4.9% | 2.1%(+2.86)#91 | 3.4%(+1.55)#5,038 |
| 92. | Drain | 4.8% | 2.1%(+2.75)#92 | 3.4%(+1.44)#5,162 |
| 93. | Coos Bay | 4.7% | 2.1%(+2.67)#93 | 3.4%(+1.36)#5,267 |
| 94. | Long Creek | 4.7% | 2.1%(+2.58)#94 | 3.4%(+1.27)#5,376 |
| 95. | Maywood Park | 4.6% | 2.1%(+2.55)#95 | 3.4%(+1.24)#5,409 |
| 96. | The Dalles | 4.5% | 2.1%(+2.47)#96 | 3.4%(+1.17)#5,477 |
| 97. | Garibaldi | 4.4% | 2.1%(+2.29)#97 | 3.4%(+0.985)#5,742 |
| 98. | Depoe Bay | 4.3% | 2.1%(+2.18)#98 | 3.4%(+0.873)#5,918 |
| 99. | Rainier | 4.2% | 2.1%(+2.17)#99 | 3.4%(+0.869)#5,919 |
| 100. | Tri City | 4.2% | 2.1%(+2.14)#100 | 3.4%(+0.839)#5,965 |
Common Questions
What are the Top 10 Cities with the Highest Percentage of Federal Government Employees in Oregon?
Top 10 Cities with the Highest Percentage of Federal Government Employees in Oregon are:
#1
100.0%
#2
98.2%
#3
54.3%
#4
50.0%
#5
44.0%
#6
32.3%
#7
30.8%
#8
27.5%
#9
27.3%
#10
27.3%
What city has the Highest Percentage of Federal Government Employees in Oregon?
Brogan has the Highest Percentage of Federal Government Employees in Oregon with 100.0%.
What is the Percentage of Federal Government Employees in the State of Oregon?
Percentage of Federal Government Employees in Oregon is 2.1%.
What is the Percentage of Federal Government Employees in the United States?
Percentage of Federal Government Employees in the United States is 3.4%.