Cities with the Highest Percentage of Federal Government Employees in Virginia
RELATED REPORTS & OPTIONS
Federal Government Employees
Virginia
Compare Cities
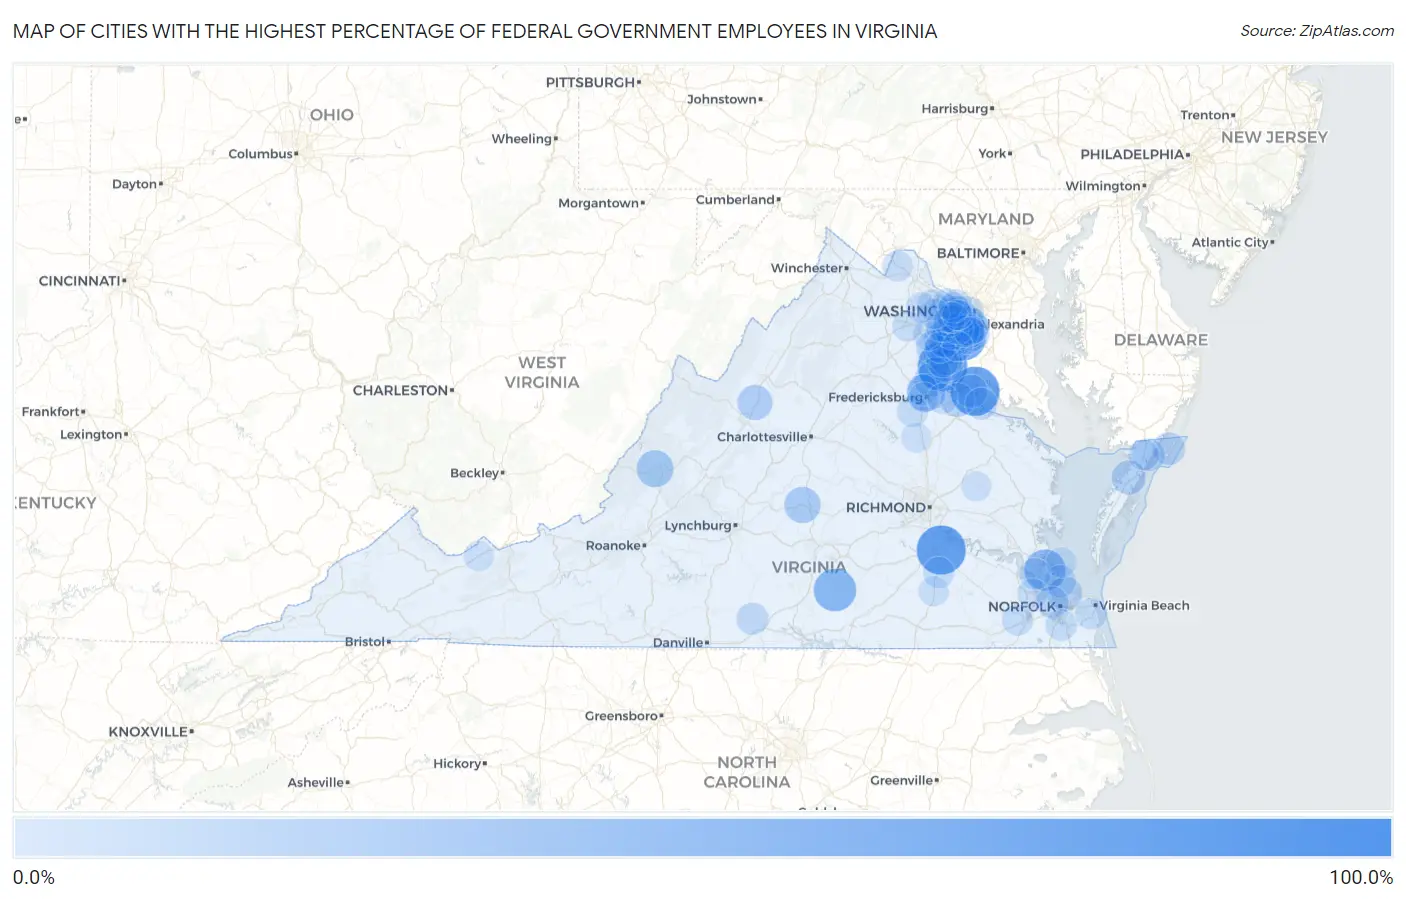
Map of Cities with the Highest Percentage of Federal Government Employees in Virginia
0.0%
100.0%
Cities with the Highest Percentage of Federal Government Employees in Virginia
| City | % Federal Government Employees | vs State | vs National | |
| 1. | Stonega | 100.0% | 11.0%(+89.0)#1 | 3.4%(+96.6)#2 |
| 2. | Rectortown | 100.0% | 11.0%(+89.0)#2 | 3.4%(+96.6)#9 |
| 3. | Camp Barrett | 95.3% | 11.0%(+84.4)#3 | 3.4%(+91.9)#24 |
| 4. | Quantico Base | 83.7% | 11.0%(+72.7)#4 | 3.4%(+80.3)#56 |
| 5. | Dahlgren Center | 82.2% | 11.0%(+71.3)#5 | 3.4%(+78.8)#60 |
| 6. | Fort Lee | 82.0% | 11.0%(+71.0)#6 | 3.4%(+78.6)#61 |
| 7. | Fort Belvoir | 73.5% | 11.0%(+62.6)#7 | 3.4%(+70.2)#95 |
| 8. | Lunenburg | 57.6% | 11.0%(+46.6)#8 | 3.4%(+54.2)#137 |
| 9. | Bethel Manor | 52.5% | 11.0%(+41.6)#9 | 3.4%(+49.2)#162 |
| 10. | Falmouth | 40.3% | 11.0%(+29.4)#10 | 3.4%(+37.0)#246 |
| 11. | Selma | 36.7% | 11.0%(+25.8)#11 | 3.4%(+33.3)#280 |
| 12. | Buckingham Courthouse | 34.2% | 11.0%(+23.3)#12 | 3.4%(+30.9)#312 |
| 13. | Dinwiddie | 33.5% | 11.0%(+22.6)#13 | 3.4%(+30.1)#328 |
| 14. | Kingstowne | 32.2% | 11.0%(+21.3)#14 | 3.4%(+28.8)#360 |
| 15. | Mount Sidney | 30.3% | 11.0%(+19.3)#15 | 3.4%(+26.9)#397 |
| 16. | Franconia | 29.3% | 11.0%(+18.3)#16 | 3.4%(+25.9)#421 |
| 17. | Huntington | 28.5% | 11.0%(+17.5)#17 | 3.4%(+25.1)#438 |
| 18. | Kincora | 27.9% | 11.0%(+17.0)#18 | 3.4%(+24.5)#451 |
| 19. | Leesylvania | 27.7% | 11.0%(+16.8)#19 | 3.4%(+24.4)#458 |
| 20. | Norfolk | 27.1% | 11.0%(+16.1)#20 | 3.4%(+23.7)#485 |
| 21. | Occoquan | 26.9% | 11.0%(+16.0)#21 | 3.4%(+23.5)#491 |
| 22. | Stafford Courthouse | 26.6% | 11.0%(+15.6)#22 | 3.4%(+23.2)#498 |
| 23. | Greenbush | 26.5% | 11.0%(+15.6)#23 | 3.4%(+23.2)#502 |
| 24. | Fort Hunt | 26.1% | 11.0%(+15.1)#24 | 3.4%(+22.7)#516 |
| 25. | King George | 26.0% | 11.0%(+15.0)#25 | 3.4%(+22.6)#521 |
| 26. | Crosspointe | 25.5% | 11.0%(+14.6)#26 | 3.4%(+22.1)#539 |
| 27. | Lorton | 25.2% | 11.0%(+14.3)#27 | 3.4%(+21.8)#551 |
| 28. | Laurel Hill | 24.9% | 11.0%(+13.9)#28 | 3.4%(+21.5)#579 |
| 29. | Montclair | 24.5% | 11.0%(+13.6)#29 | 3.4%(+21.2)#589 |
| 30. | Quantico | 24.2% | 11.0%(+13.3)#30 | 3.4%(+20.9)#599 |
| 31. | Mount Vernon | 22.6% | 11.0%(+11.6)#31 | 3.4%(+19.2)#687 |
| 32. | County Center | 22.3% | 11.0%(+11.4)#32 | 3.4%(+19.0)#703 |
| 33. | Dahlgren | 22.2% | 11.0%(+11.2)#33 | 3.4%(+18.8)#715 |
| 34. | Independent Hill | 22.1% | 11.0%(+11.1)#34 | 3.4%(+18.7)#720 |
| 35. | Rose Hill Cdp Fairfax County | 22.1% | 11.0%(+11.1)#35 | 3.4%(+18.7)#721 |
| 36. | Brandy Station | 22.0% | 11.0%(+11.0)#36 | 3.4%(+18.6)#725 |
| 37. | Cherry Hill | 21.9% | 11.0%(+10.9)#37 | 3.4%(+18.5)#733 |
| 38. | Chincoteague | 21.7% | 11.0%(+10.8)#38 | 3.4%(+18.4)#741 |
| 39. | Atlantic | 21.5% | 11.0%(+10.6)#39 | 3.4%(+18.2)#754 |
| 40. | Newington | 21.4% | 11.0%(+10.5)#40 | 3.4%(+18.1)#757 |
| 41. | Alexandria | 21.4% | 11.0%(+10.4)#41 | 3.4%(+18.0)#764 |
| 42. | West Springfield | 21.1% | 11.0%(+10.2)#42 | 3.4%(+17.7)#770 |
| 43. | Aquia Harbour | 20.8% | 11.0%(+9.84)#43 | 3.4%(+17.4)#786 |
| 44. | Arlington | 20.7% | 11.0%(+9.76)#44 | 3.4%(+17.3)#792 |
| 45. | Merrifield | 20.7% | 11.0%(+9.73)#45 | 3.4%(+17.3)#796 |
| 46. | Triangle | 20.4% | 11.0%(+9.43)#46 | 3.4%(+17.0)#813 |
| 47. | South Run | 20.1% | 11.0%(+9.20)#47 | 3.4%(+16.8)#822 |
| 48. | Mountain Road | 19.9% | 11.0%(+8.91)#48 | 3.4%(+16.5)#848 |
| 49. | Burke | 19.7% | 11.0%(+8.73)#49 | 3.4%(+16.3)#857 |
| 50. | Belle Haven | 19.6% | 11.0%(+8.67)#50 | 3.4%(+16.2)#861 |
| 51. | Hampton | 19.4% | 11.0%(+8.42)#51 | 3.4%(+16.0)#883 |
| 52. | Portsmouth | 19.3% | 11.0%(+8.37)#52 | 3.4%(+15.9)#887 |
| 53. | Colonial Beach | 18.9% | 11.0%(+7.99)#53 | 3.4%(+15.6)#919 |
| 54. | Lake Ridge | 18.9% | 11.0%(+7.98)#54 | 3.4%(+15.6)#920 |
| 55. | Newington Forest | 18.7% | 11.0%(+7.71)#55 | 3.4%(+15.3)#943 |
| 56. | Falls Church | 18.6% | 11.0%(+7.62)#56 | 3.4%(+15.2)#951 |
| 57. | Burke Centre | 17.4% | 11.0%(+6.47)#57 | 3.4%(+14.0)#1,040 |
| 58. | Hayfield | 17.2% | 11.0%(+6.26)#58 | 3.4%(+13.8)#1,057 |
| 59. | Chesapeake | 17.1% | 11.0%(+6.14)#59 | 3.4%(+13.7)#1,067 |
| 60. | Virginia Beach | 16.9% | 11.0%(+5.97)#60 | 3.4%(+13.5)#1,084 |
| 61. | Oakton | 16.6% | 11.0%(+5.63)#61 | 3.4%(+13.2)#1,114 |
| 62. | Spotsylvania Courthouse | 16.4% | 11.0%(+5.44)#62 | 3.4%(+13.0)#1,128 |
| 63. | Templeton | 16.4% | 11.0%(+5.44)#63 | 3.4%(+13.0)#1,129 |
| 64. | Lake Barcroft | 16.4% | 11.0%(+5.44)#64 | 3.4%(+13.0)#1,130 |
| 65. | Newport News | 16.3% | 11.0%(+5.31)#65 | 3.4%(+12.9)#1,142 |
| 66. | Southern Gateway | 16.2% | 11.0%(+5.23)#66 | 3.4%(+12.8)#1,153 |
| 67. | Buckhall | 16.2% | 11.0%(+5.21)#67 | 3.4%(+12.8)#1,156 |
| 68. | Mclean | 16.1% | 11.0%(+5.14)#68 | 3.4%(+12.7)#1,165 |
| 69. | Groveton | 16.0% | 11.0%(+5.09)#69 | 3.4%(+12.7)#1,173 |
| 70. | Fairfax Station | 16.0% | 11.0%(+5.07)#70 | 3.4%(+12.6)#1,177 |
| 71. | Suffolk | 16.0% | 11.0%(+5.06)#71 | 3.4%(+12.6)#1,178 |
| 72. | Long Branch | 15.7% | 11.0%(+4.79)#72 | 3.4%(+12.4)#1,207 |
| 73. | Springfield | 15.7% | 11.0%(+4.75)#73 | 3.4%(+12.3)#1,213 |
| 74. | Idylwood | 15.4% | 11.0%(+4.48)#74 | 3.4%(+12.1)#1,242 |
| 75. | Hillsboro | 14.9% | 11.0%(+3.94)#75 | 3.4%(+11.5)#1,307 |
| 76. | Mantua | 14.8% | 11.0%(+3.89)#76 | 3.4%(+11.5)#1,317 |
| 77. | Floris | 14.7% | 11.0%(+3.77)#77 | 3.4%(+11.3)#1,332 |
| 78. | Wolf Trap | 14.7% | 11.0%(+3.72)#78 | 3.4%(+11.3)#1,337 |
| 79. | Rio | 14.5% | 11.0%(+3.58)#79 | 3.4%(+11.2)#1,356 |
| 80. | Greenbriar | 14.5% | 11.0%(+3.58)#80 | 3.4%(+11.2)#1,357 |
| 81. | Union Mill | 14.4% | 11.0%(+3.49)#81 | 3.4%(+11.1)#1,363 |
| 82. | Temperanceville | 14.4% | 11.0%(+3.45)#82 | 3.4%(+11.0)#1,364 |
| 83. | Woodlawn Cdp Fairfax County | 14.1% | 11.0%(+3.15)#83 | 3.4%(+10.7)#1,421 |
| 84. | Carrollton | 13.7% | 11.0%(+2.77)#84 | 3.4%(+10.3)#1,473 |
| 85. | Poquoson | 13.6% | 11.0%(+2.64)#85 | 3.4%(+10.2)#1,495 |
| 86. | Woodburn | 13.4% | 11.0%(+2.48)#86 | 3.4%(+10.1)#1,517 |
| 87. | Dale City | 13.3% | 11.0%(+2.30)#87 | 3.4%(+9.88)#1,538 |
| 88. | Fredericksburg | 13.3% | 11.0%(+2.30)#88 | 3.4%(+9.87)#1,539 |
| 89. | Hybla Valley | 13.2% | 11.0%(+2.29)#89 | 3.4%(+9.87)#1,540 |
| 90. | South Riding | 13.2% | 11.0%(+2.27)#90 | 3.4%(+9.85)#1,544 |
| 91. | Passapatanzy | 13.2% | 11.0%(+2.21)#91 | 3.4%(+9.78)#1,554 |
| 92. | Gainesville | 13.1% | 11.0%(+2.11)#92 | 3.4%(+9.68)#1,574 |
| 93. | Stony Creek | 13.0% | 11.0%(+2.09)#93 | 3.4%(+9.67)#1,575 |
| 94. | Tysons | 13.0% | 11.0%(+2.01)#94 | 3.4%(+9.58)#1,595 |
| 95. | Springville | 12.8% | 11.0%(+1.90)#95 | 3.4%(+9.47)#1,610 |
| 96. | West Falls Church | 12.7% | 11.0%(+1.78)#96 | 3.4%(+9.35)#1,622 |
| 97. | Lake Land Or | 12.4% | 11.0%(+1.48)#97 | 3.4%(+9.05)#1,678 |
| 98. | King William | 12.3% | 11.0%(+1.39)#98 | 3.4%(+8.97)#1,689 |
| 99. | Mason Neck | 12.3% | 11.0%(+1.37)#99 | 3.4%(+8.94)#1,694 |
| 100. | Braddock | 12.3% | 11.0%(+1.34)#100 | 3.4%(+8.92)#1,700 |
Common Questions
What are the Top 10 Cities with the Highest Percentage of Federal Government Employees in Virginia?
Top 10 Cities with the Highest Percentage of Federal Government Employees in Virginia are:
#1
83.7%
#2
82.2%
#3
82.0%
#4
73.5%
#5
57.6%
#6
52.5%
#7
40.3%
#8
36.7%
#9
34.2%
#10
32.2%
What city has the Highest Percentage of Federal Government Employees in Virginia?
Quantico Base has the Highest Percentage of Federal Government Employees in Virginia with 83.7%.
What is the Percentage of Federal Government Employees in the State of Virginia?
Percentage of Federal Government Employees in Virginia is 11.0%.
What is the Percentage of Federal Government Employees in the United States?
Percentage of Federal Government Employees in the United States is 3.4%.