Cities with the Highest Percentage of Federal Government Employees in West Virginia
RELATED REPORTS & OPTIONS
Federal Government Employees
West Virginia
Compare Cities
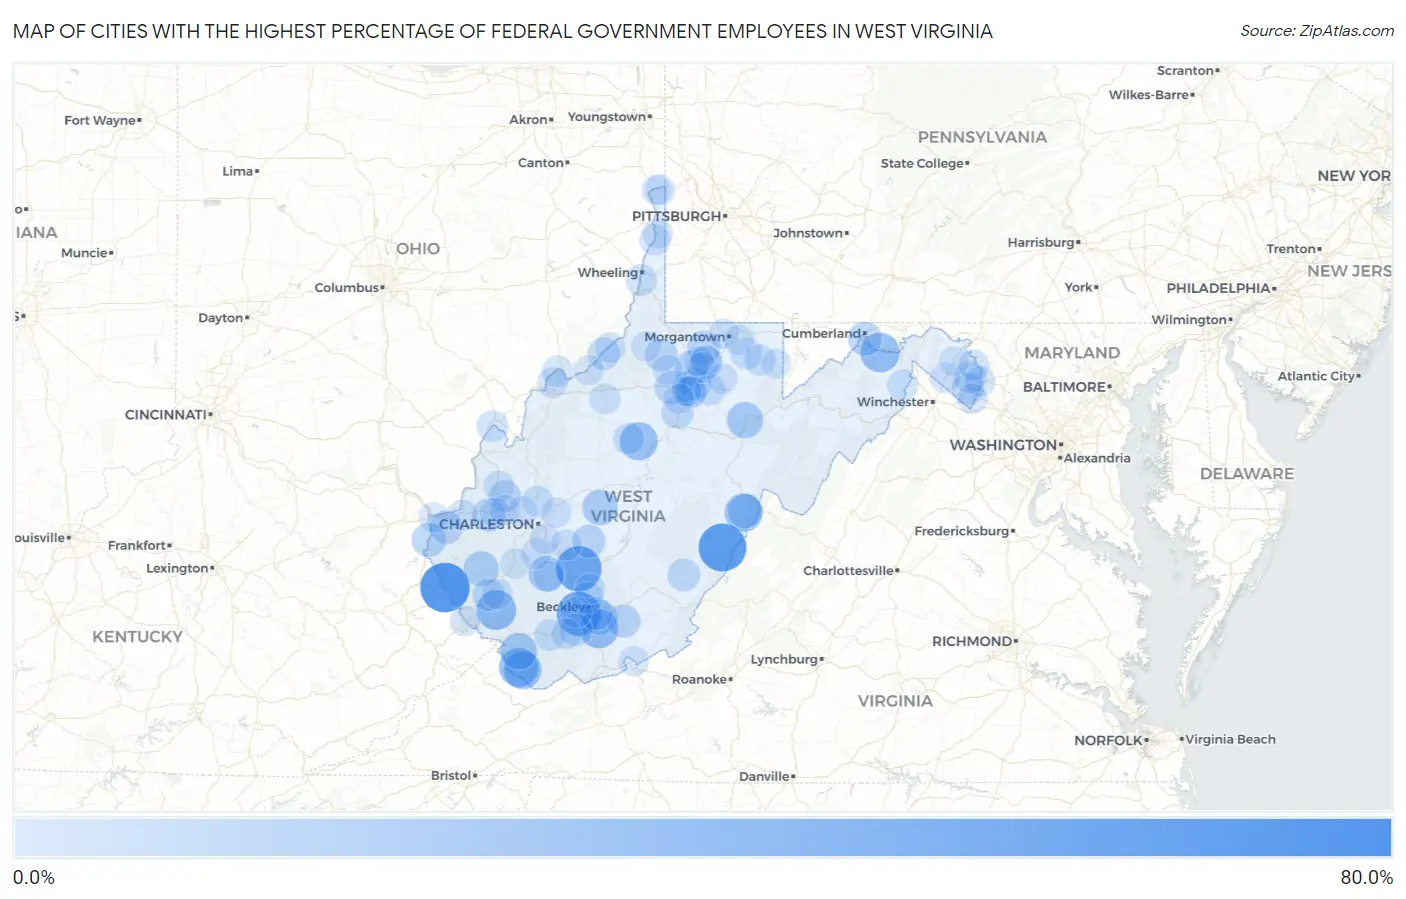
Map of Cities with the Highest Percentage of Federal Government Employees in West Virginia
0.0%
80.0%
Cities with the Highest Percentage of Federal Government Employees in West Virginia
| City | % Federal Government Employees | vs State | vs National | |
| 1. | Adrian | 73.2% | 4.4%(+68.8)#1 | 3.4%(+69.8)#96 |
| 2. | Crum | 69.6% | 4.4%(+65.1)#2 | 3.4%(+66.2)#111 |
| 3. | Huntersville | 63.6% | 4.4%(+59.2)#3 | 3.4%(+60.3)#122 |
| 4. | Kincaid | 56.5% | 4.4%(+52.1)#4 | 3.4%(+53.1)#143 |
| 5. | Glen White | 51.5% | 4.4%(+47.1)#5 | 3.4%(+48.2)#167 |
| 6. | Omar | 36.7% | 4.4%(+32.3)#6 | 3.4%(+33.4)#279 |
| 7. | Green Spring | 35.1% | 4.4%(+30.6)#7 | 3.4%(+31.7)#295 |
| 8. | Bradshaw | 34.2% | 4.4%(+29.8)#8 | 3.4%(+30.9)#311 |
| 9. | Ghent | 34.0% | 4.4%(+29.6)#9 | 3.4%(+30.7)#319 |
| 10. | Dorothy | 33.3% | 4.4%(+28.9)#10 | 3.4%(+30.0)#331 |
| 11. | Green Bank | 31.2% | 4.4%(+26.8)#11 | 3.4%(+27.9)#380 |
| 12. | Raysal | 30.8% | 4.4%(+26.4)#12 | 3.4%(+27.4)#386 |
| 13. | Sand Fork | 30.6% | 4.4%(+26.1)#13 | 3.4%(+27.2)#391 |
| 14. | Iaeger | 26.2% | 4.4%(+21.8)#14 | 3.4%(+22.9)#512 |
| 15. | Montrose | 24.4% | 4.4%(+19.9)#15 | 3.4%(+21.0)#594 |
| 16. | Reynoldsville | 23.0% | 4.4%(+18.5)#16 | 3.4%(+19.6)#661 |
| 17. | Sylvester | 22.6% | 4.4%(+18.2)#17 | 3.4%(+19.2)#685 |
| 18. | Booth | 22.1% | 4.4%(+17.7)#18 | 3.4%(+18.7)#719 |
| 19. | Clay | 22.0% | 4.4%(+17.6)#19 | 3.4%(+18.6)#724 |
| 20. | Harts | 21.1% | 4.4%(+16.6)#20 | 3.4%(+17.7)#771 |
| 21. | Shady Spring | 20.1% | 4.4%(+15.7)#21 | 3.4%(+16.8)#823 |
| 22. | Arbovale | 18.6% | 4.4%(+14.2)#22 | 3.4%(+15.2)#949 |
| 23. | Prichard | 17.6% | 4.4%(+13.2)#23 | 3.4%(+14.3)#1,015 |
| 24. | Wiley Ford | 17.1% | 4.4%(+12.7)#24 | 3.4%(+13.7)#1,066 |
| 25. | Enterprise | 16.1% | 4.4%(+11.6)#25 | 3.4%(+12.7)#1,169 |
| 26. | Grant Town | 15.4% | 4.4%(+11.0)#26 | 3.4%(+12.1)#1,239 |
| 27. | Culloden | 15.4% | 4.4%(+11.0)#27 | 3.4%(+12.1)#1,240 |
| 28. | Belva | 15.4% | 4.4%(+11.0)#28 | 3.4%(+12.0)#1,251 |
| 29. | Wolf Summit | 14.9% | 4.4%(+10.5)#29 | 3.4%(+11.5)#1,306 |
| 30. | Lavalette | 14.9% | 4.4%(+10.4)#30 | 3.4%(+11.5)#1,314 |
| 31. | Hinton | 14.6% | 4.4%(+10.1)#31 | 3.4%(+11.2)#1,352 |
| 32. | Daniels | 14.1% | 4.4%(+9.70)#32 | 3.4%(+10.7)#1,420 |
| 33. | Smithfield | 13.6% | 4.4%(+9.22)#33 | 3.4%(+10.3)#1,485 |
| 34. | Falling Spring | 13.3% | 4.4%(+8.92)#34 | 3.4%(+9.96)#1,528 |
| 35. | Verdunville | 12.4% | 4.4%(+7.95)#35 | 3.4%(+8.99)#1,687 |
| 36. | Rhodell | 12.3% | 4.4%(+7.86)#36 | 3.4%(+8.90)#1,706 |
| 37. | Bridgeport | 12.2% | 4.4%(+7.80)#37 | 3.4%(+8.84)#1,715 |
| 38. | Friendly | 12.2% | 4.4%(+7.78)#38 | 3.4%(+8.82)#1,720 |
| 39. | Jane Lew | 12.1% | 4.4%(+7.65)#39 | 3.4%(+8.69)#1,744 |
| 40. | Pleasant Valley | 11.6% | 4.4%(+7.19)#40 | 3.4%(+8.23)#1,840 |
| 41. | Eleanor | 11.4% | 4.4%(+6.99)#41 | 3.4%(+8.03)#1,879 |
| 42. | Charles Town | 11.4% | 4.4%(+6.95)#42 | 3.4%(+7.99)#1,890 |
| 43. | Shenandoah Junction | 10.8% | 4.4%(+6.37)#43 | 3.4%(+7.41)#2,011 |
| 44. | Pineville | 9.8% | 4.4%(+5.39)#44 | 3.4%(+6.43)#2,258 |
| 45. | Reedsville | 9.4% | 4.4%(+5.02)#45 | 3.4%(+6.06)#2,367 |
| 46. | Prosperity | 9.4% | 4.4%(+4.97)#46 | 3.4%(+6.01)#2,380 |
| 47. | Mason | 9.3% | 4.4%(+4.91)#47 | 3.4%(+5.94)#2,409 |
| 48. | Stonewood | 9.3% | 4.4%(+4.85)#48 | 3.4%(+5.89)#2,426 |
| 49. | Kingwood | 9.2% | 4.4%(+4.77)#49 | 3.4%(+5.81)#2,462 |
| 50. | Glenville | 8.9% | 4.4%(+4.50)#50 | 3.4%(+5.54)#2,544 |
| 51. | Benwood | 8.8% | 4.4%(+4.43)#51 | 3.4%(+5.46)#2,576 |
| 52. | Clarksburg | 8.8% | 4.4%(+4.38)#52 | 3.4%(+5.42)#2,593 |
| 53. | Wellsburg | 8.5% | 4.4%(+4.09)#53 | 3.4%(+5.13)#2,701 |
| 54. | Williamstown | 8.5% | 4.4%(+4.05)#54 | 3.4%(+5.09)#2,727 |
| 55. | Anmoore | 8.4% | 4.4%(+3.96)#55 | 3.4%(+4.99)#2,769 |
| 56. | Shepherdstown | 8.2% | 4.4%(+3.83)#56 | 3.4%(+4.86)#2,818 |
| 57. | Capon Bridge | 7.8% | 4.4%(+3.38)#57 | 3.4%(+4.42)#2,992 |
| 58. | Arthurdale | 7.8% | 4.4%(+3.35)#58 | 3.4%(+4.39)#3,009 |
| 59. | Sissonville | 7.7% | 4.4%(+3.32)#59 | 3.4%(+4.36)#3,013 |
| 60. | Flemington | 7.7% | 4.4%(+3.28)#60 | 3.4%(+4.31)#3,031 |
| 61. | Lester | 7.6% | 4.4%(+3.20)#61 | 3.4%(+4.24)#3,063 |
| 62. | Pratt | 7.6% | 4.4%(+3.18)#62 | 3.4%(+4.22)#3,078 |
| 63. | Whitesville | 7.5% | 4.4%(+3.08)#63 | 3.4%(+4.12)#3,121 |
| 64. | West Logan | 7.4% | 4.4%(+2.97)#64 | 3.4%(+4.00)#3,184 |
| 65. | Harrisville | 7.3% | 4.4%(+2.93)#65 | 3.4%(+3.97)#3,200 |
| 66. | Barboursville | 7.3% | 4.4%(+2.91)#66 | 3.4%(+3.95)#3,208 |
| 67. | Buffalo | 7.3% | 4.4%(+2.85)#67 | 3.4%(+3.89)#3,238 |
| 68. | Sistersville | 7.0% | 4.4%(+2.53)#68 | 3.4%(+3.57)#3,416 |
| 69. | Fairmont | 6.9% | 4.4%(+2.52)#69 | 3.4%(+3.56)#3,430 |
| 70. | White Hall | 6.9% | 4.4%(+2.46)#70 | 3.4%(+3.50)#3,470 |
| 71. | North Hills | 6.8% | 4.4%(+2.37)#71 | 3.4%(+3.41)#3,524 |
| 72. | Mullens | 6.7% | 4.4%(+2.30)#72 | 3.4%(+3.34)#3,551 |
| 73. | Racine | 6.5% | 4.4%(+2.03)#73 | 3.4%(+3.07)#3,702 |
| 74. | Grafton | 6.4% | 4.4%(+1.97)#74 | 3.4%(+3.01)#3,746 |
| 75. | Wallace | 6.4% | 4.4%(+1.97)#75 | 3.4%(+3.01)#3,748 |
| 76. | Marmet | 6.3% | 4.4%(+1.84)#76 | 3.4%(+2.88)#3,821 |
| 77. | Inwood | 6.3% | 4.4%(+1.84)#77 | 3.4%(+2.88)#3,824 |
| 78. | Teays Valley | 6.1% | 4.4%(+1.69)#78 | 3.4%(+2.73)#3,953 |
| 79. | Peterstown | 6.1% | 4.4%(+1.64)#79 | 3.4%(+2.68)#3,985 |
| 80. | Ceredo | 6.0% | 4.4%(+1.61)#80 | 3.4%(+2.65)#4,007 |
| 81. | Bolivar | 6.0% | 4.4%(+1.56)#81 | 3.4%(+2.60)#4,055 |
| 82. | Elkview | 6.0% | 4.4%(+1.54)#82 | 3.4%(+2.58)#4,069 |
| 83. | Chester | 5.7% | 4.4%(+1.30)#83 | 3.4%(+2.34)#4,268 |
| 84. | Mount Hope | 5.7% | 4.4%(+1.30)#84 | 3.4%(+2.34)#4,270 |
| 85. | Williamson | 5.7% | 4.4%(+1.28)#85 | 3.4%(+2.32)#4,292 |
| 86. | St Marys | 5.7% | 4.4%(+1.26)#86 | 3.4%(+2.30)#4,301 |
| 87. | Granville | 5.6% | 4.4%(+1.15)#87 | 3.4%(+2.19)#4,396 |
| 88. | Brookhaven | 5.5% | 4.4%(+1.09)#88 | 3.4%(+2.13)#4,457 |
| 89. | Shannondale | 5.4% | 4.4%(+1.01)#89 | 3.4%(+2.05)#4,539 |
| 90. | West Milford | 5.4% | 4.4%(+0.998)#90 | 3.4%(+2.04)#4,544 |
| 91. | Hurricane | 5.4% | 4.4%(+0.958)#91 | 3.4%(+2.00)#4,581 |
| 92. | Hooverson Heights | 5.3% | 4.4%(+0.857)#92 | 3.4%(+1.90)#4,673 |
| 93. | Newell | 5.3% | 4.4%(+0.846)#93 | 3.4%(+1.89)#4,682 |
| 94. | Danville | 5.3% | 4.4%(+0.846)#94 | 3.4%(+1.89)#4,685 |
| 95. | Pine Grove | 5.1% | 4.4%(+0.646)#95 | 3.4%(+1.69)#4,896 |
| 96. | Nutter Fort | 5.1% | 4.4%(+0.640)#96 | 3.4%(+1.68)#4,904 |
| 97. | Monongah | 4.8% | 4.4%(+0.422)#97 | 3.4%(+1.46)#5,138 |
| 98. | Martinsburg | 4.8% | 4.4%(+0.398)#98 | 3.4%(+1.44)#5,171 |
| 99. | Terra Alta | 4.8% | 4.4%(+0.398)#99 | 3.4%(+1.44)#5,172 |
| 100. | Cross Lanes | 4.8% | 4.4%(+0.388)#100 | 3.4%(+1.43)#5,184 |
Common Questions
What are the Top 10 Cities with the Highest Percentage of Federal Government Employees in West Virginia?
Top 10 Cities with the Highest Percentage of Federal Government Employees in West Virginia are:
#1
69.6%
#2
63.6%
#3
56.5%
#4
51.5%
#5
36.7%
#6
35.1%
#7
34.2%
#8
34.0%
#9
31.2%
#10
30.8%
What city has the Highest Percentage of Federal Government Employees in West Virginia?
Crum has the Highest Percentage of Federal Government Employees in West Virginia with 69.6%.
What is the Percentage of Federal Government Employees in the State of West Virginia?
Percentage of Federal Government Employees in West Virginia is 4.4%.
What is the Percentage of Federal Government Employees in the United States?
Percentage of Federal Government Employees in the United States is 3.4%.