Cities with the Highest Percentage of Federal Government Employees in Connecticut
RELATED REPORTS & OPTIONS
Federal Government Employees
Connecticut
Compare Cities
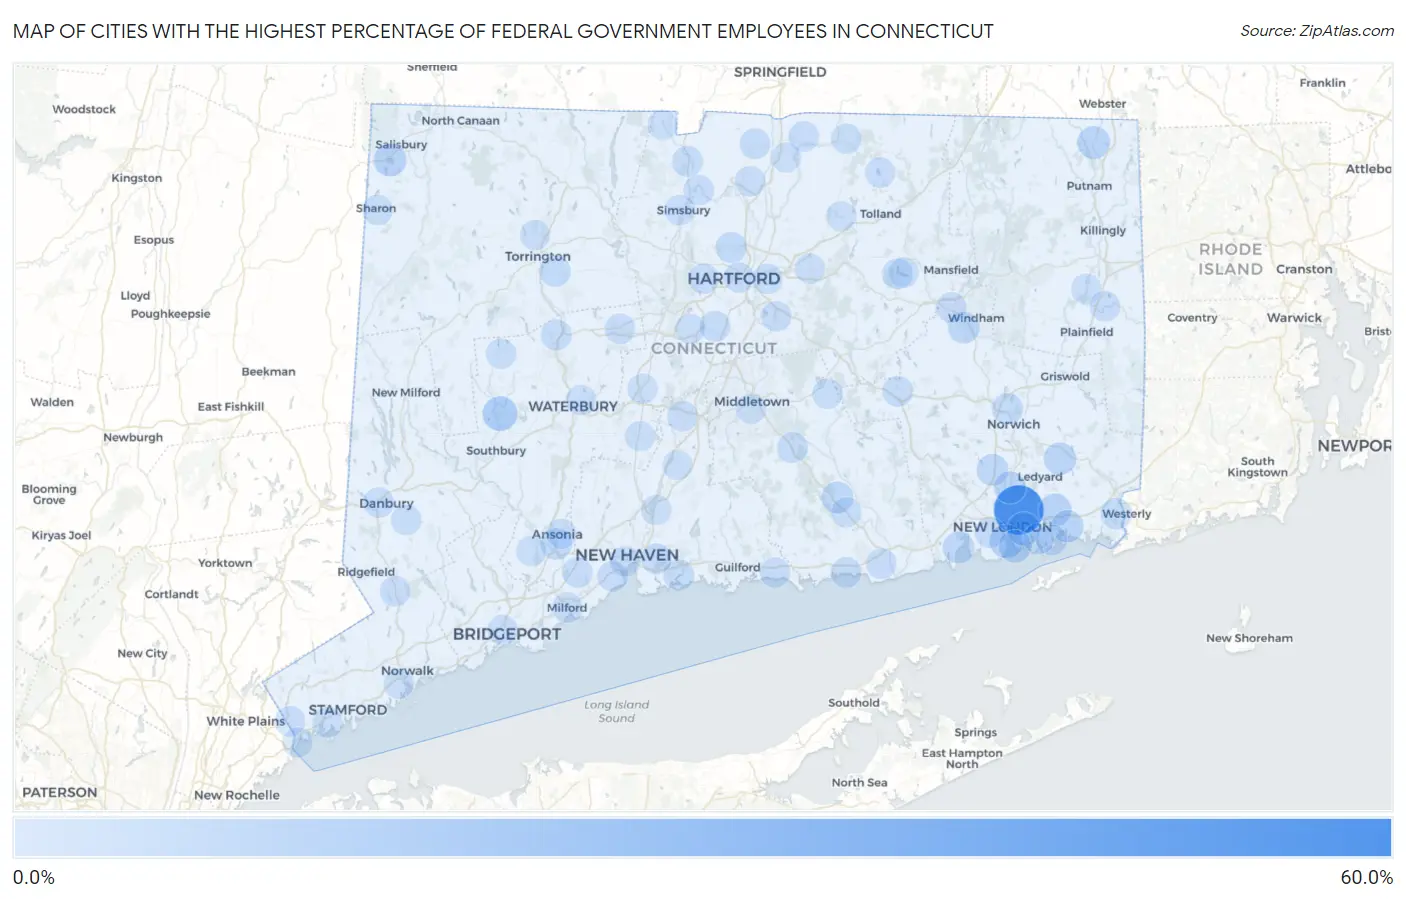
Map of Cities with the Highest Percentage of Federal Government Employees in Connecticut
0.0%
60.0%
Cities with the Highest Percentage of Federal Government Employees in Connecticut
| City | % Federal Government Employees | vs State | vs National | |
| 1. | Conning Towers Nautilus Park | 59.5% | 2.0%(+57.5)#1 | 3.4%(+56.2)#130 |
| 2. | Woodbury Center | 14.2% | 2.0%(+12.2)#2 | 3.4%(+10.8)#1,412 |
| 3. | New London | 11.1% | 2.0%(+9.15)#3 | 3.4%(+7.76)#1,925 |
| 4. | Long Hill | 9.6% | 2.0%(+7.63)#4 | 3.4%(+6.24)#2,309 |
| 5. | Lakeville | 9.0% | 2.0%(+7.01)#5 | 3.4%(+5.61)#2,526 |
| 6. | Old Mystic | 8.9% | 2.0%(+6.89)#6 | 3.4%(+5.50)#2,561 |
| 7. | North Grosvenor Dale | 8.4% | 2.0%(+6.40)#7 | 3.4%(+5.00)#2,764 |
| 8. | Groton | 8.1% | 2.0%(+6.16)#8 | 3.4%(+4.76)#2,867 |
| 9. | Candlewood Isle | 8.0% | 2.0%(+6.00)#9 | 3.4%(+4.61)#2,921 |
| 10. | Mashantucket | 7.5% | 2.0%(+5.51)#10 | 3.4%(+4.12)#3,123 |
| 11. | Mystic | 6.6% | 2.0%(+4.60)#11 | 3.4%(+3.20)#3,623 |
| 12. | Gales Ferry | 6.5% | 2.0%(+4.54)#12 | 3.4%(+3.15)#3,663 |
| 13. | Oxoboxo River | 5.8% | 2.0%(+3.81)#13 | 3.4%(+2.42)#4,207 |
| 14. | South Windham | 5.8% | 2.0%(+3.81)#14 | 3.4%(+2.41)#4,209 |
| 15. | Niantic | 5.7% | 2.0%(+3.74)#15 | 3.4%(+2.35)#4,262 |
| 16. | Mamanasco Lake | 5.6% | 2.0%(+3.63)#16 | 3.4%(+2.23)#4,359 |
| 17. | Chester Center | 5.6% | 2.0%(+3.62)#17 | 3.4%(+2.23)#4,361 |
| 18. | Derby | 5.4% | 2.0%(+3.46)#18 | 3.4%(+2.07)#4,513 |
| 19. | Stonington Borough | 5.2% | 2.0%(+3.22)#19 | 3.4%(+1.83)#4,746 |
| 20. | Lakes East | 4.5% | 2.0%(+2.55)#20 | 3.4%(+1.16)#5,512 |
| 21. | Pawcatuck | 4.4% | 2.0%(+2.46)#21 | 3.4%(+1.06)#5,631 |
| 22. | Weston | 4.3% | 2.0%(+2.27)#22 | 3.4%(+0.882)#5,896 |
| 23. | Northwest Harwinton | 4.3% | 2.0%(+2.27)#23 | 3.4%(+0.876)#5,910 |
| 24. | Norwich | 3.8% | 2.0%(+1.86)#24 | 3.4%(+0.468)#6,549 |
| 25. | Blue Hills | 3.6% | 2.0%(+1.65)#25 | 3.4%(+0.256)#6,920 |
| 26. | Thomaston | 3.3% | 2.0%(+1.27)#26 | 3.4%(-0.125)#7,706 |
| 27. | Litchfield Borough | 3.2% | 2.0%(+1.26)#27 | 3.4%(-0.137)#7,731 |
| 28. | Brookfield Center | 3.2% | 2.0%(+1.19)#28 | 3.4%(-0.203)#7,897 |
| 29. | Branford Center | 3.2% | 2.0%(+1.18)#29 | 3.4%(-0.217)#7,928 |
| 30. | Noank | 3.1% | 2.0%(+1.12)#30 | 3.4%(-0.275)#8,085 |
| 31. | Poquonock Bridge | 3.1% | 2.0%(+1.09)#31 | 3.4%(-0.303)#8,162 |
| 32. | Salmon Brook | 2.9% | 2.0%(+0.893)#32 | 3.4%(-0.500)#8,639 |
| 33. | Colchester | 2.9% | 2.0%(+0.875)#33 | 3.4%(-0.518)#8,689 |
| 34. | Westbrook Center | 2.8% | 2.0%(+0.771)#34 | 3.4%(-0.622)#8,981 |
| 35. | Newington | 2.6% | 2.0%(+0.626)#35 | 3.4%(-0.767)#9,403 |
| 36. | Suffield Depot | 2.6% | 2.0%(+0.626)#36 | 3.4%(-0.767)#9,404 |
| 37. | Higganum | 2.6% | 2.0%(+0.621)#37 | 3.4%(-0.772)#9,420 |
| 38. | East Haven | 2.5% | 2.0%(+0.564)#38 | 3.4%(-0.829)#9,591 |
| 39. | Tariffville | 2.5% | 2.0%(+0.532)#39 | 3.4%(-0.861)#9,689 |
| 40. | West Haven | 2.5% | 2.0%(+0.526)#40 | 3.4%(-0.867)#9,712 |
| 41. | Waterford | 2.5% | 2.0%(+0.521)#41 | 3.4%(-0.871)#9,728 |
| 42. | Glenville | 2.5% | 2.0%(+0.496)#42 | 3.4%(-0.897)#9,834 |
| 43. | Coventry Lake | 2.4% | 2.0%(+0.377)#43 | 3.4%(-1.02)#10,246 |
| 44. | Woodmont Borough | 2.4% | 2.0%(+0.368)#44 | 3.4%(-1.02)#10,279 |
| 45. | Hazardville | 2.3% | 2.0%(+0.319)#45 | 3.4%(-1.07)#10,454 |
| 46. | New Haven | 2.1% | 2.0%(+0.111)#46 | 3.4%(-1.28)#11,269 |
| 47. | Old Hill | 2.1% | 2.0%(+0.072)#47 | 3.4%(-1.32)#11,430 |
| 48. | Danielson Borough | 2.0% | 2.0%(+0.028)#48 | 3.4%(-1.36)#11,581 |
| 49. | Old Saybrook Center | 2.0% | 2.0%(+0.026)#49 | 3.4%(-1.37)#11,596 |
| 50. | Sharon | 2.0% | 2.0%(+0.025)#50 | 3.4%(-1.37)#11,602 |
| 51. | Meriden | 2.0% | 2.0%(+0.019)#51 | 3.4%(-1.37)#11,625 |
| 52. | West Hartford | 2.0% | 2.0%(+0.003)#52 | 3.4%(-1.39)#11,705 |
| 53. | Glastonbury Center | 2.0% | 2.0%(-0.014)#53 | 3.4%(-1.41)#11,773 |
| 54. | East Hampton | 1.9% | 2.0%(-0.046)#54 | 3.4%(-1.44)#11,904 |
| 55. | Windsor Locks | 1.8% | 2.0%(-0.153)#55 | 3.4%(-1.55)#12,348 |
| 56. | Danbury | 1.8% | 2.0%(-0.179)#56 | 3.4%(-1.57)#12,483 |
| 57. | Orange | 1.8% | 2.0%(-0.183)#57 | 3.4%(-1.58)#12,498 |
| 58. | Bethel | 1.8% | 2.0%(-0.195)#58 | 3.4%(-1.59)#12,559 |
| 59. | Moosup | 1.8% | 2.0%(-0.201)#59 | 3.4%(-1.59)#12,591 |
| 60. | Hartford | 1.8% | 2.0%(-0.211)#60 | 3.4%(-1.60)#12,637 |
| 61. | Simsbury Center | 1.8% | 2.0%(-0.232)#61 | 3.4%(-1.62)#12,741 |
| 62. | Inglenook | 1.7% | 2.0%(-0.241)#62 | 3.4%(-1.63)#12,776 |
| 63. | Georgetown | 1.7% | 2.0%(-0.249)#63 | 3.4%(-1.64)#12,816 |
| 64. | East Hartford | 1.7% | 2.0%(-0.268)#64 | 3.4%(-1.66)#12,892 |
| 65. | Madison Center | 1.7% | 2.0%(-0.270)#65 | 3.4%(-1.66)#12,904 |
| 66. | Bethlehem Village | 1.7% | 2.0%(-0.274)#66 | 3.4%(-1.67)#12,920 |
| 67. | Milford City Balance | 1.7% | 2.0%(-0.275)#67 | 3.4%(-1.67)#12,924 |
| 68. | Bristol | 1.7% | 2.0%(-0.311)#68 | 3.4%(-1.70)#13,093 |
| 69. | Somers | 1.7% | 2.0%(-0.328)#69 | 3.4%(-1.72)#13,178 |
| 70. | Crystal Lake | 1.6% | 2.0%(-0.344)#70 | 3.4%(-1.74)#13,239 |
| 71. | Willimantic | 1.6% | 2.0%(-0.352)#71 | 3.4%(-1.74)#13,289 |
| 72. | Naugatuck Borough | 1.6% | 2.0%(-0.361)#72 | 3.4%(-1.75)#13,337 |
| 73. | Waterbury | 1.6% | 2.0%(-0.372)#73 | 3.4%(-1.76)#13,396 |
| 74. | Wauregan | 1.6% | 2.0%(-0.383)#74 | 3.4%(-1.78)#13,444 |
| 75. | North Haven | 1.6% | 2.0%(-0.391)#75 | 3.4%(-1.78)#13,488 |
| 76. | Bridgeport | 1.6% | 2.0%(-0.409)#76 | 3.4%(-1.80)#13,567 |
| 77. | Torrington | 1.5% | 2.0%(-0.455)#77 | 3.4%(-1.85)#13,823 |
| 78. | Westport | 1.5% | 2.0%(-0.474)#78 | 3.4%(-1.87)#13,903 |
| 79. | Cheshire Village | 1.5% | 2.0%(-0.518)#79 | 3.4%(-1.91)#14,136 |
| 80. | Newtown Borough | 1.4% | 2.0%(-0.558)#80 | 3.4%(-1.95)#14,344 |
| 81. | Manchester | 1.4% | 2.0%(-0.575)#81 | 3.4%(-1.97)#14,421 |
| 82. | South Coventry | 1.4% | 2.0%(-0.587)#82 | 3.4%(-1.98)#14,485 |
| 83. | Plantsville | 1.4% | 2.0%(-0.590)#83 | 3.4%(-1.98)#14,511 |
| 84. | Shelton | 1.4% | 2.0%(-0.608)#84 | 3.4%(-2.00)#14,602 |
| 85. | Norwalk | 1.4% | 2.0%(-0.614)#85 | 3.4%(-2.01)#14,627 |
| 86. | Wallingford Center | 1.4% | 2.0%(-0.616)#86 | 3.4%(-2.01)#14,646 |
| 87. | Riverside | 1.3% | 2.0%(-0.653)#87 | 3.4%(-2.05)#14,841 |
| 88. | Ansonia | 1.3% | 2.0%(-0.654)#88 | 3.4%(-2.05)#14,849 |
| 89. | Jewett City Borough | 1.3% | 2.0%(-0.659)#89 | 3.4%(-2.05)#14,873 |
| 90. | Rockville | 1.3% | 2.0%(-0.701)#90 | 3.4%(-2.09)#15,098 |
| 91. | Saugatuck | 1.3% | 2.0%(-0.707)#91 | 3.4%(-2.10)#15,142 |
| 92. | Deep River Center | 1.3% | 2.0%(-0.707)#92 | 3.4%(-2.10)#15,143 |
| 93. | Ball Pond | 1.3% | 2.0%(-0.735)#93 | 3.4%(-2.13)#15,285 |
| 94. | North Granby | 1.2% | 2.0%(-0.755)#94 | 3.4%(-2.15)#15,402 |
| 95. | Byram | 1.2% | 2.0%(-0.757)#95 | 3.4%(-2.15)#15,410 |
| 96. | Southwood Acres | 1.2% | 2.0%(-0.771)#96 | 3.4%(-2.16)#15,497 |
| 97. | Middletown | 1.2% | 2.0%(-0.792)#97 | 3.4%(-2.18)#15,613 |
| 98. | Daniels Farm | 1.2% | 2.0%(-0.792)#98 | 3.4%(-2.18)#15,619 |
| 99. | New Britain | 1.2% | 2.0%(-0.823)#99 | 3.4%(-2.22)#15,760 |
| 100. | Sandy Hook | 1.1% | 2.0%(-0.841)#100 | 3.4%(-2.23)#15,850 |
Common Questions
What are the Top 10 Cities with the Highest Percentage of Federal Government Employees in Connecticut?
Top 10 Cities with the Highest Percentage of Federal Government Employees in Connecticut are:
#1
59.5%
#2
14.2%
#3
11.1%
#4
9.6%
#5
9.0%
#6
8.9%
#7
8.4%
#8
8.1%
#9
7.5%
#10
6.6%
What city has the Highest Percentage of Federal Government Employees in Connecticut?
Conning Towers Nautilus Park has the Highest Percentage of Federal Government Employees in Connecticut with 59.5%.
What is the Percentage of Federal Government Employees in the State of Connecticut?
Percentage of Federal Government Employees in Connecticut is 2.0%.
What is the Percentage of Federal Government Employees in the United States?
Percentage of Federal Government Employees in the United States is 3.4%.