Cities with the Highest Percentage of Federal Government Employees in Indiana
RELATED REPORTS & OPTIONS
Federal Government Employees
Indiana
Compare Cities
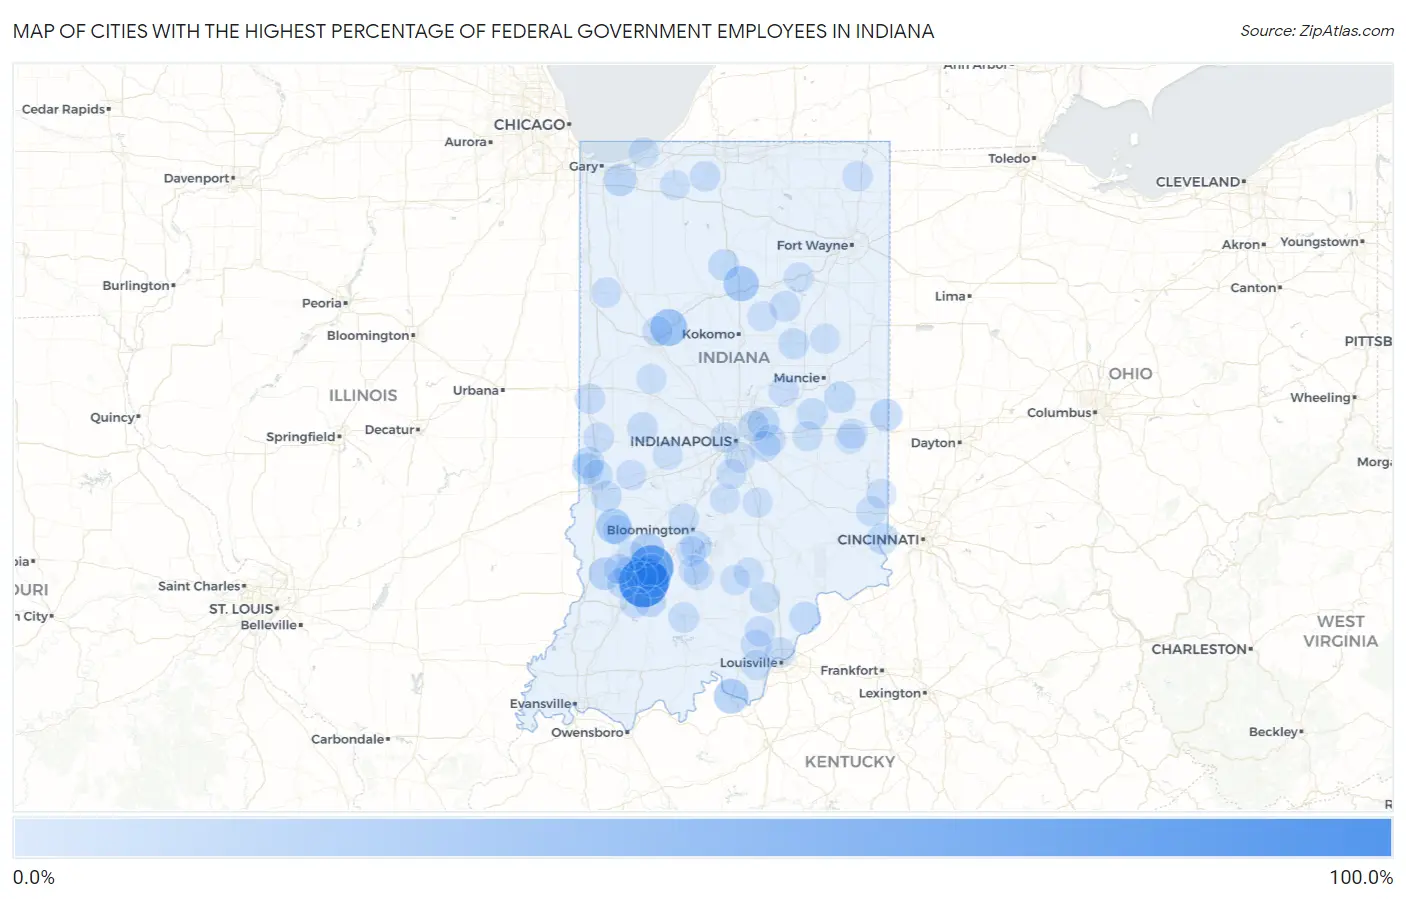
Map of Cities with the Highest Percentage of Federal Government Employees in Indiana
0.0%
100.0%
Cities with the Highest Percentage of Federal Government Employees in Indiana
| City | % Federal Government Employees | vs State | vs National | |
| 1. | Raglesville | 81.6% | 1.9%(+79.7)#1 | 3.4%(+78.2)#63 |
| 2. | Lamb | 64.0% | 1.9%(+62.1)#2 | 3.4%(+60.6)#120 |
| 3. | Scotland | 60.9% | 1.9%(+59.0)#3 | 3.4%(+57.5)#127 |
| 4. | Solsberry | 39.6% | 1.9%(+37.7)#4 | 3.4%(+36.3)#254 |
| 5. | Brimfield | 37.3% | 1.9%(+35.5)#5 | 3.4%(+34.0)#271 |
| 6. | Americus | 30.2% | 1.9%(+28.3)#6 | 3.4%(+26.8)#399 |
| 7. | Burns City | 24.4% | 1.9%(+22.6)#7 | 3.4%(+21.1)#593 |
| 8. | Cree Lake | 24.4% | 1.9%(+22.5)#8 | 3.4%(+21.0)#595 |
| 9. | Mexico | 23.3% | 1.9%(+21.4)#9 | 3.4%(+19.9)#643 |
| 10. | Coalmont | 22.6% | 1.9%(+20.7)#10 | 3.4%(+19.2)#688 |
| 11. | Mauckport | 21.4% | 1.9%(+19.5)#11 | 3.4%(+18.1)#761 |
| 12. | Sumava Resorts | 18.6% | 1.9%(+16.7)#12 | 3.4%(+15.2)#950 |
| 13. | Bloomfield | 17.4% | 1.9%(+15.5)#13 | 3.4%(+14.1)#1,039 |
| 14. | Oakville | 15.0% | 1.9%(+13.1)#14 | 3.4%(+11.6)#1,294 |
| 15. | Gilmer Park | 14.4% | 1.9%(+12.5)#15 | 3.4%(+11.0)#1,365 |
| 16. | Freelandville | 14.3% | 1.9%(+12.5)#16 | 3.4%(+11.0)#1,369 |
| 17. | Mongo | 14.0% | 1.9%(+12.1)#17 | 3.4%(+10.6)#1,438 |
| 18. | Hartz Lake | 13.8% | 1.9%(+11.9)#18 | 3.4%(+10.5)#1,460 |
| 19. | Newtonville | 13.6% | 1.9%(+11.7)#19 | 3.4%(+10.3)#1,484 |
| 20. | Wheeler | 12.3% | 1.9%(+10.5)#20 | 3.4%(+8.97)#1,690 |
| 21. | Crane | 12.1% | 1.9%(+10.2)#21 | 3.4%(+8.74)#1,736 |
| 22. | Whitewater | 12.0% | 1.9%(+10.1)#22 | 3.4%(+8.62)#1,756 |
| 23. | Elnora | 11.3% | 1.9%(+9.44)#23 | 3.4%(+7.96)#1,899 |
| 24. | Ramsey | 11.3% | 1.9%(+9.38)#24 | 3.4%(+7.89)#1,909 |
| 25. | Antioch | 11.1% | 1.9%(+9.22)#25 | 3.4%(+7.73)#1,943 |
| 26. | Cloverland | 11.1% | 1.9%(+9.16)#26 | 3.4%(+7.67)#1,961 |
| 27. | Loogootee | 10.4% | 1.9%(+8.52)#27 | 3.4%(+7.04)#2,094 |
| 28. | Paxton | 10.2% | 1.9%(+8.33)#28 | 3.4%(+6.85)#2,149 |
| 29. | Mccordsville | 9.8% | 1.9%(+7.93)#29 | 3.4%(+6.45)#2,253 |
| 30. | New Washington | 9.6% | 1.9%(+7.71)#30 | 3.4%(+6.22)#2,311 |
| 31. | New Goshen | 8.9% | 1.9%(+7.01)#31 | 3.4%(+5.52)#2,551 |
| 32. | Blountsville | 8.8% | 1.9%(+6.93)#32 | 3.4%(+5.45)#2,583 |
| 33. | Odon | 8.8% | 1.9%(+6.89)#33 | 3.4%(+5.41)#2,597 |
| 34. | Fulton | 8.7% | 1.9%(+6.80)#34 | 3.4%(+5.32)#2,633 |
| 35. | Underwood | 8.7% | 1.9%(+6.76)#35 | 3.4%(+5.28)#2,654 |
| 36. | Lawrenceburg | 8.5% | 1.9%(+6.61)#36 | 3.4%(+5.13)#2,700 |
| 37. | Universal | 8.5% | 1.9%(+6.60)#37 | 3.4%(+5.11)#2,712 |
| 38. | Plainville | 8.2% | 1.9%(+6.35)#38 | 3.4%(+4.87)#2,815 |
| 39. | Spring Lake | 8.2% | 1.9%(+6.35)#39 | 3.4%(+4.87)#2,816 |
| 40. | Smithville Sanders | 8.2% | 1.9%(+6.34)#40 | 3.4%(+4.86)#2,827 |
| 41. | Cadiz | 8.2% | 1.9%(+6.29)#41 | 3.4%(+4.80)#2,845 |
| 42. | Fairmount | 7.6% | 1.9%(+5.75)#42 | 3.4%(+4.27)#3,054 |
| 43. | Gwynneville | 7.3% | 1.9%(+5.45)#43 | 3.4%(+3.97)#3,202 |
| 44. | Riley | 7.2% | 1.9%(+5.32)#44 | 3.4%(+3.84)#3,270 |
| 45. | Nineveh | 7.0% | 1.9%(+5.15)#45 | 3.4%(+3.67)#3,353 |
| 46. | Little York | 7.0% | 1.9%(+5.08)#46 | 3.4%(+3.60)#3,402 |
| 47. | Montgomery | 6.9% | 1.9%(+4.98)#47 | 3.4%(+3.50)#3,468 |
| 48. | La Fontaine | 6.8% | 1.9%(+4.90)#48 | 3.4%(+3.41)#3,520 |
| 49. | New Palestine | 6.6% | 1.9%(+4.70)#49 | 3.4%(+3.21)#3,616 |
| 50. | Lawrence | 6.4% | 1.9%(+4.46)#50 | 3.4%(+2.98)#3,760 |
| 51. | West Baden Springs | 6.3% | 1.9%(+4.45)#51 | 3.4%(+2.96)#3,774 |
| 52. | Lake Of The Woods | 6.2% | 1.9%(+4.36)#52 | 3.4%(+2.87)#3,833 |
| 53. | Young America | 6.2% | 1.9%(+4.32)#53 | 3.4%(+2.83)#3,866 |
| 54. | North Liberty | 6.1% | 1.9%(+4.25)#54 | 3.4%(+2.77)#3,914 |
| 55. | Russellville | 6.1% | 1.9%(+4.20)#55 | 3.4%(+2.71)#3,962 |
| 56. | Anoka | 6.1% | 1.9%(+4.17)#56 | 3.4%(+2.68)#3,988 |
| 57. | Greenville | 6.0% | 1.9%(+4.10)#57 | 3.4%(+2.62)#4,035 |
| 58. | Ellettsville | 6.0% | 1.9%(+4.06)#58 | 3.4%(+2.58)#4,071 |
| 59. | Foxcliff Estates | 5.8% | 1.9%(+3.91)#59 | 3.4%(+2.42)#4,201 |
| 60. | Southport | 5.8% | 1.9%(+3.90)#60 | 3.4%(+2.41)#4,210 |
| 61. | Edgewood | 5.7% | 1.9%(+3.77)#61 | 3.4%(+2.28)#4,309 |
| 62. | Hudson | 5.5% | 1.9%(+3.61)#62 | 3.4%(+2.13)#4,454 |
| 63. | Clarksville | 5.4% | 1.9%(+3.51)#63 | 3.4%(+2.03)#4,549 |
| 64. | Perrysville | 5.3% | 1.9%(+3.39)#64 | 3.4%(+1.91)#4,665 |
| 65. | Harrodsburg | 5.2% | 1.9%(+3.29)#65 | 3.4%(+1.80)#4,772 |
| 66. | Shipshewana Lake | 5.1% | 1.9%(+3.22)#66 | 3.4%(+1.74)#4,850 |
| 67. | Fairbanks | 5.1% | 1.9%(+3.20)#67 | 3.4%(+1.72)#4,871 |
| 68. | Harmony | 5.1% | 1.9%(+3.20)#68 | 3.4%(+1.71)#4,875 |
| 69. | North Terre Haute | 5.1% | 1.9%(+3.19)#69 | 3.4%(+1.70)#4,882 |
| 70. | Goodland | 5.0% | 1.9%(+3.14)#70 | 3.4%(+1.65)#4,937 |
| 71. | Stanford | 5.0% | 1.9%(+3.08)#71 | 3.4%(+1.60)#4,992 |
| 72. | Charlottesville | 4.9% | 1.9%(+2.97)#72 | 3.4%(+1.49)#5,115 |
| 73. | Knightstown | 4.9% | 1.9%(+2.97)#73 | 3.4%(+1.49)#5,116 |
| 74. | Montezuma | 4.8% | 1.9%(+2.93)#74 | 3.4%(+1.44)#5,163 |
| 75. | Rockford | 4.7% | 1.9%(+2.85)#75 | 3.4%(+1.37)#5,259 |
| 76. | Battle Ground | 4.7% | 1.9%(+2.83)#76 | 3.4%(+1.34)#5,281 |
| 77. | Borden | 4.7% | 1.9%(+2.81)#77 | 3.4%(+1.33)#5,295 |
| 78. | St Leon | 4.7% | 1.9%(+2.79)#78 | 3.4%(+1.31)#5,316 |
| 79. | Kingsford Heights | 4.6% | 1.9%(+2.67)#79 | 3.4%(+1.18)#5,466 |
| 80. | Mount Carmel | 4.5% | 1.9%(+2.65)#80 | 3.4%(+1.17)#5,503 |
| 81. | Brownstown | 4.5% | 1.9%(+2.64)#81 | 3.4%(+1.15)#5,518 |
| 82. | Amboy | 4.5% | 1.9%(+2.62)#82 | 3.4%(+1.14)#5,531 |
| 83. | Medora | 4.5% | 1.9%(+2.59)#83 | 3.4%(+1.11)#5,564 |
| 84. | Lyons | 4.5% | 1.9%(+2.58)#84 | 3.4%(+1.10)#5,581 |
| 85. | Jasonville | 4.5% | 1.9%(+2.58)#85 | 3.4%(+1.09)#5,588 |
| 86. | Linden | 4.4% | 1.9%(+2.54)#86 | 3.4%(+1.06)#5,640 |
| 87. | Milton | 4.4% | 1.9%(+2.53)#87 | 3.4%(+1.04)#5,663 |
| 88. | Beverly Shores | 4.4% | 1.9%(+2.51)#88 | 3.4%(+1.02)#5,687 |
| 89. | Sandborn | 4.3% | 1.9%(+2.43)#89 | 3.4%(+0.947)#5,798 |
| 90. | Bedford | 4.3% | 1.9%(+2.43)#90 | 3.4%(+0.943)#5,804 |
| 91. | Andrews | 4.3% | 1.9%(+2.39)#91 | 3.4%(+0.905)#5,863 |
| 92. | Fillmore | 4.3% | 1.9%(+2.38)#92 | 3.4%(+0.900)#5,873 |
| 93. | Edinburgh | 4.3% | 1.9%(+2.36)#93 | 3.4%(+0.874)#5,916 |
| 94. | Speedway | 4.2% | 1.9%(+2.34)#94 | 3.4%(+0.861)#5,933 |
| 95. | Oolitic | 4.2% | 1.9%(+2.32)#95 | 3.4%(+0.833)#5,974 |
| 96. | Morgantown | 4.1% | 1.9%(+2.18)#96 | 3.4%(+0.700)#6,182 |
| 97. | Hartford City | 4.1% | 1.9%(+2.17)#97 | 3.4%(+0.682)#6,209 |
| 98. | Lanesville | 4.1% | 1.9%(+2.16)#98 | 3.4%(+0.673)#6,225 |
| 99. | East Germantown | 4.0% | 1.9%(+2.14)#99 | 3.4%(+0.655)#6,252 |
| 100. | Bargersville | 3.9% | 1.9%(+2.04)#100 | 3.4%(+0.558)#6,421 |
Common Questions
What are the Top 10 Cities with the Highest Percentage of Federal Government Employees in Indiana?
Top 10 Cities with the Highest Percentage of Federal Government Employees in Indiana are:
#1
81.6%
#2
60.9%
#3
30.2%
#4
24.4%
#5
23.3%
#6
22.6%
#7
21.4%
#8
17.4%
#9
14.3%
#10
12.3%
What city has the Highest Percentage of Federal Government Employees in Indiana?
Raglesville has the Highest Percentage of Federal Government Employees in Indiana with 81.6%.
What is the Percentage of Federal Government Employees in the State of Indiana?
Percentage of Federal Government Employees in Indiana is 1.9%.
What is the Percentage of Federal Government Employees in the United States?
Percentage of Federal Government Employees in the United States is 3.4%.