Cities with the Highest Percentage of Federal Government Employees in Minnesota
RELATED REPORTS & OPTIONS
Federal Government Employees
Minnesota
Compare Cities
Map of Cities with the Highest Percentage of Federal Government Employees in Minnesota
0.0%
50.0%
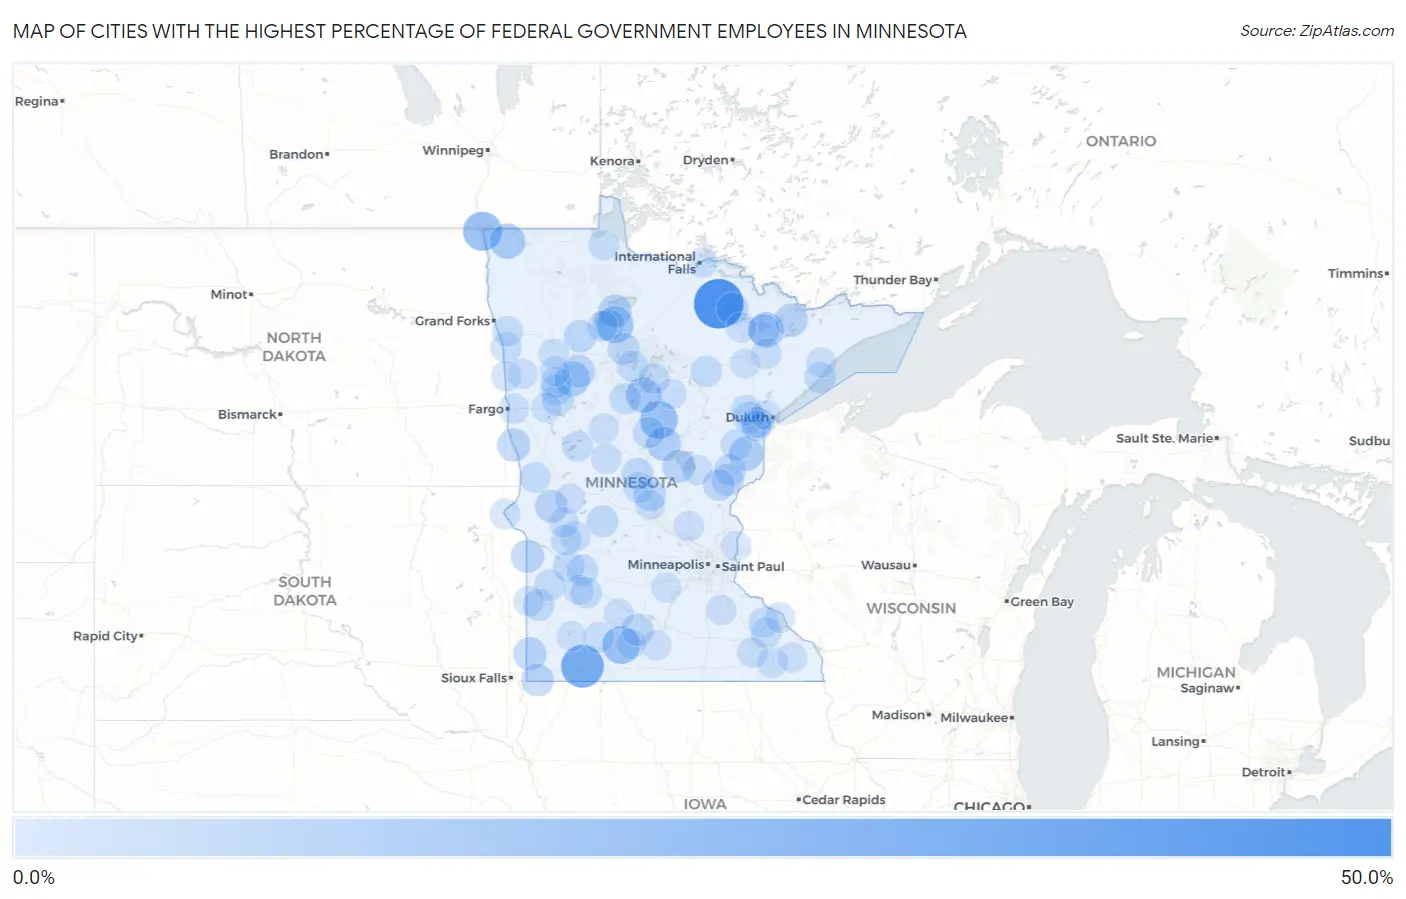
Cities with the Highest Percentage of Federal Government Employees in Minnesota
| City | % Federal Government Employees | vs State | vs National | |
| 1. | Nett Lake | 44.3% | 1.7%(+42.6)#1 | 3.4%(+40.9)#210 |
| 2. | Brewster | 30.0% | 1.7%(+28.3)#2 | 3.4%(+26.7)#402 |
| 3. | St Vincent | 22.2% | 1.7%(+20.5)#3 | 3.4%(+18.8)#710 |
| 4. | Manhattan Beach | 20.0% | 1.7%(+18.3)#4 | 3.4%(+16.6)#844 |
| 5. | Butterfield | 19.9% | 1.7%(+18.2)#5 | 3.4%(+16.5)#846 |
| 6. | Redby | 17.5% | 1.7%(+15.8)#6 | 3.4%(+14.2)#1,031 |
| 7. | Soudan | 15.2% | 1.7%(+13.5)#7 | 3.4%(+11.8)#1,277 |
| 8. | Whipholt | 15.2% | 1.7%(+13.4)#8 | 3.4%(+11.8)#1,279 |
| 9. | Lancaster | 14.7% | 1.7%(+13.0)#9 | 3.4%(+11.3)#1,329 |
| 10. | Twin Lakes | 13.5% | 1.7%(+11.8)#10 | 3.4%(+10.1)#1,503 |
| 11. | Kerrick | 12.5% | 1.7%(+10.8)#11 | 3.4%(+9.12)#1,666 |
| 12. | Riverton | 12.3% | 1.7%(+10.6)#12 | 3.4%(+8.93)#1,697 |
| 13. | Ponemah | 10.7% | 1.7%(+9.04)#13 | 3.4%(+7.37)#2,024 |
| 14. | Winton | 10.7% | 1.7%(+9.00)#14 | 3.4%(+7.34)#2,033 |
| 15. | Nassau | 10.5% | 1.7%(+8.81)#15 | 3.4%(+7.15)#2,077 |
| 16. | Kent | 10.5% | 1.7%(+8.81)#16 | 3.4%(+7.15)#2,079 |
| 17. | Jasper | 10.5% | 1.7%(+8.76)#17 | 3.4%(+7.09)#2,086 |
| 18. | Vineland | 10.0% | 1.7%(+8.29)#18 | 3.4%(+6.62)#2,201 |
| 19. | Donnelly | 10.0% | 1.7%(+8.29)#19 | 3.4%(+6.62)#2,206 |
| 20. | Roy Lake | 10.0% | 1.7%(+8.29)#20 | 3.4%(+6.62)#2,212 |
| 21. | Steen | 9.4% | 1.7%(+7.72)#21 | 3.4%(+6.06)#2,369 |
| 22. | Gonvick | 9.1% | 1.7%(+7.38)#22 | 3.4%(+5.71)#2,487 |
| 23. | Royalton | 8.9% | 1.7%(+7.20)#23 | 3.4%(+5.54)#2,545 |
| 24. | Hinckley | 8.7% | 1.7%(+7.04)#24 | 3.4%(+5.37)#2,614 |
| 25. | Orr | 8.7% | 1.7%(+6.98)#25 | 3.4%(+5.32)#2,631 |
| 26. | Hanska | 8.6% | 1.7%(+6.88)#26 | 3.4%(+5.21)#2,678 |
| 27. | Turtle River | 8.0% | 1.7%(+6.29)#27 | 3.4%(+4.62)#2,917 |
| 28. | Randall | 7.9% | 1.7%(+6.14)#28 | 3.4%(+4.48)#2,965 |
| 29. | Sandstone | 7.8% | 1.7%(+6.13)#29 | 3.4%(+4.47)#2,967 |
| 30. | Mahnomen | 7.7% | 1.7%(+5.98)#30 | 3.4%(+4.31)#3,034 |
| 31. | Brooten | 7.7% | 1.7%(+5.96)#31 | 3.4%(+4.29)#3,048 |
| 32. | Callaway | 7.5% | 1.7%(+5.79)#32 | 3.4%(+4.12)#3,119 |
| 33. | Brook Park | 7.5% | 1.7%(+5.75)#33 | 3.4%(+4.08)#3,143 |
| 34. | Tower | 7.4% | 1.7%(+5.74)#34 | 3.4%(+4.07)#3,148 |
| 35. | Ivanhoe | 7.4% | 1.7%(+5.73)#35 | 3.4%(+4.07)#3,153 |
| 36. | Marble | 7.2% | 1.7%(+5.53)#36 | 3.4%(+3.86)#3,254 |
| 37. | Pequot Lakes | 7.1% | 1.7%(+5.35)#37 | 3.4%(+3.69)#3,345 |
| 38. | Montevideo | 7.0% | 1.7%(+5.32)#38 | 3.4%(+3.65)#3,368 |
| 39. | St Leo | 7.0% | 1.7%(+5.31)#39 | 3.4%(+3.64)#3,381 |
| 40. | Cass Lake | 7.0% | 1.7%(+5.29)#40 | 3.4%(+3.63)#3,390 |
| 41. | Red Lake | 6.9% | 1.7%(+5.23)#41 | 3.4%(+3.56)#3,429 |
| 42. | Maynard | 6.9% | 1.7%(+5.19)#42 | 3.4%(+3.52)#3,456 |
| 43. | Beaver Bay | 6.9% | 1.7%(+5.19)#43 | 3.4%(+3.52)#3,461 |
| 44. | Akeley | 6.8% | 1.7%(+5.13)#44 | 3.4%(+3.46)#3,488 |
| 45. | Ogema | 6.8% | 1.7%(+5.13)#45 | 3.4%(+3.46)#3,489 |
| 46. | Echo | 6.8% | 1.7%(+5.11)#46 | 3.4%(+3.44)#3,502 |
| 47. | Waubun | 6.8% | 1.7%(+5.09)#47 | 3.4%(+3.42)#3,508 |
| 48. | Sobieski | 6.7% | 1.7%(+4.96)#48 | 3.4%(+3.29)#3,581 |
| 49. | Climax | 6.6% | 1.7%(+4.87)#49 | 3.4%(+3.20)#3,626 |
| 50. | Moose Lake | 6.6% | 1.7%(+4.85)#50 | 3.4%(+3.18)#3,637 |
| 51. | Nashua | 6.2% | 1.7%(+4.54)#51 | 3.4%(+2.87)#3,845 |
| 52. | Ottertail | 6.2% | 1.7%(+4.44)#52 | 3.4%(+2.78)#3,903 |
| 53. | Millville | 6.1% | 1.7%(+4.41)#53 | 3.4%(+2.74)#3,935 |
| 54. | Benson | 6.1% | 1.7%(+4.39)#54 | 3.4%(+2.73)#3,952 |
| 55. | Fisher | 6.0% | 1.7%(+4.31)#55 | 3.4%(+2.64)#4,014 |
| 56. | Esko | 6.0% | 1.7%(+4.29)#56 | 3.4%(+2.63)#4,024 |
| 57. | Roosevelt | 6.0% | 1.7%(+4.29)#57 | 3.4%(+2.62)#4,029 |
| 58. | Little Rock | 5.9% | 1.7%(+4.23)#58 | 3.4%(+2.56)#4,084 |
| 59. | Aurora | 5.9% | 1.7%(+4.22)#59 | 3.4%(+2.55)#4,093 |
| 60. | Elgin | 5.9% | 1.7%(+4.20)#60 | 3.4%(+2.53)#4,112 |
| 61. | Fountain | 5.9% | 1.7%(+4.17)#61 | 3.4%(+2.50)#4,126 |
| 62. | Jeffers | 5.8% | 1.7%(+4.13)#62 | 3.4%(+2.46)#4,174 |
| 63. | Scanlon | 5.8% | 1.7%(+4.09)#63 | 3.4%(+2.42)#4,203 |
| 64. | Brookston | 5.7% | 1.7%(+4.00)#64 | 3.4%(+2.34)#4,278 |
| 65. | Carlton | 5.7% | 1.7%(+3.99)#65 | 3.4%(+2.32)#4,286 |
| 66. | Danvers | 5.6% | 1.7%(+3.92)#66 | 3.4%(+2.26)#4,341 |
| 67. | Stewartville | 5.6% | 1.7%(+3.86)#67 | 3.4%(+2.19)#4,390 |
| 68. | Federal Dam | 5.6% | 1.7%(+3.84)#68 | 3.4%(+2.18)#4,418 |
| 69. | St Anthony City Stearns County | 5.6% | 1.7%(+3.84)#69 | 3.4%(+2.18)#4,426 |
| 70. | Hendricks | 5.5% | 1.7%(+3.76)#70 | 3.4%(+2.09)#4,480 |
| 71. | Bertha | 5.5% | 1.7%(+3.75)#71 | 3.4%(+2.09)#4,488 |
| 72. | Browns Valley | 5.4% | 1.7%(+3.69)#72 | 3.4%(+2.03)#4,553 |
| 73. | Dilworth | 5.4% | 1.7%(+3.64)#73 | 3.4%(+1.97)#4,605 |
| 74. | Ada | 5.3% | 1.7%(+3.60)#74 | 3.4%(+1.94)#4,641 |
| 75. | Zimmerman | 5.2% | 1.7%(+3.53)#75 | 3.4%(+1.87)#4,707 |
| 76. | Kellogg | 5.2% | 1.7%(+3.53)#76 | 3.4%(+1.87)#4,708 |
| 77. | Vernon Center | 5.2% | 1.7%(+3.53)#77 | 3.4%(+1.86)#4,712 |
| 78. | Remer | 5.2% | 1.7%(+3.52)#78 | 3.4%(+1.85)#4,722 |
| 79. | Kensington | 5.2% | 1.7%(+3.51)#79 | 3.4%(+1.84)#4,734 |
| 80. | Hancock | 5.2% | 1.7%(+3.50)#80 | 3.4%(+1.83)#4,742 |
| 81. | Dennison | 5.2% | 1.7%(+3.44)#81 | 3.4%(+1.78)#4,797 |
| 82. | Sebeka | 5.2% | 1.7%(+3.44)#82 | 3.4%(+1.77)#4,803 |
| 83. | Evan | 5.1% | 1.7%(+3.42)#83 | 3.4%(+1.75)#4,834 |
| 84. | Ranier | 5.0% | 1.7%(+3.32)#84 | 3.4%(+1.66)#4,927 |
| 85. | Cook | 5.0% | 1.7%(+3.29)#85 | 3.4%(+1.62)#4,962 |
| 86. | Hendrum | 5.0% | 1.7%(+3.29)#86 | 3.4%(+1.62)#4,969 |
| 87. | Isle | 4.9% | 1.7%(+3.23)#87 | 3.4%(+1.57)#5,022 |
| 88. | Winger | 4.9% | 1.7%(+3.23)#88 | 3.4%(+1.56)#5,029 |
| 89. | Wood Lake | 4.8% | 1.7%(+3.08)#89 | 3.4%(+1.41)#5,198 |
| 90. | Iron Junction | 4.8% | 1.7%(+3.05)#90 | 3.4%(+1.38)#5,236 |
| 91. | Finland | 4.7% | 1.7%(+2.98)#91 | 3.4%(+1.31)#5,321 |
| 92. | Hermantown | 4.7% | 1.7%(+2.97)#92 | 3.4%(+1.30)#5,333 |
| 93. | Rushford Village | 4.7% | 1.7%(+2.96)#93 | 3.4%(+1.30)#5,342 |
| 94. | St James | 4.7% | 1.7%(+2.96)#94 | 3.4%(+1.29)#5,347 |
| 95. | Green Isle | 4.6% | 1.7%(+2.93)#95 | 3.4%(+1.27)#5,388 |
| 96. | Marine On St Croix | 4.6% | 1.7%(+2.90)#96 | 3.4%(+1.23)#5,422 |
| 97. | Lake Park | 4.6% | 1.7%(+2.88)#97 | 3.4%(+1.21)#5,444 |
| 98. | Riverland | 4.5% | 1.7%(+2.83)#98 | 3.4%(+1.17)#5,486 |
| 99. | Currie | 4.5% | 1.7%(+2.77)#99 | 3.4%(+1.10)#5,578 |
| 100. | St Stephen | 4.4% | 1.7%(+2.74)#100 | 3.4%(+1.07)#5,612 |
Common Questions
What are the Top 10 Cities with the Highest Percentage of Federal Government Employees in Minnesota?
Top 10 Cities with the Highest Percentage of Federal Government Employees in Minnesota are:
#1
44.3%
#2
30.0%
#3
22.2%
#4
20.0%
#5
19.9%
#6
17.5%
#7
15.2%
#8
15.2%
#9
14.7%
#10
13.5%
What city has the Highest Percentage of Federal Government Employees in Minnesota?
Nett Lake has the Highest Percentage of Federal Government Employees in Minnesota with 44.3%.
What is the Percentage of Federal Government Employees in the State of Minnesota?
Percentage of Federal Government Employees in Minnesota is 1.7%.
What is the Percentage of Federal Government Employees in the United States?
Percentage of Federal Government Employees in the United States is 3.4%.