Cities with the Highest Percentage of Federal Government Employees in South Carolina
RELATED REPORTS & OPTIONS
Federal Government Employees
South Carolina
Compare Cities
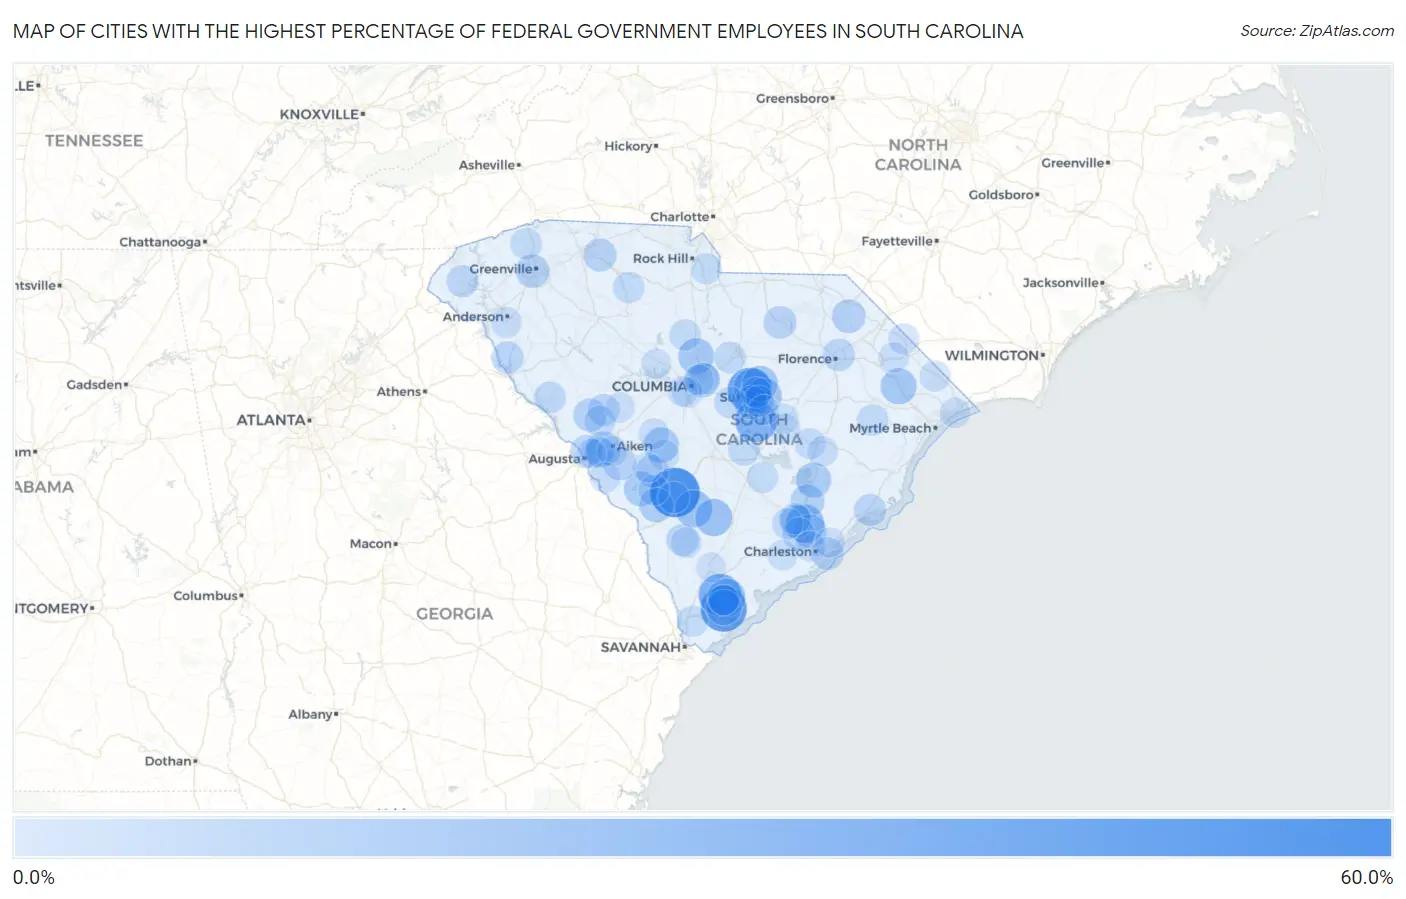
Map of Cities with the Highest Percentage of Federal Government Employees in South Carolina
0.0%
60.0%
Cities with the Highest Percentage of Federal Government Employees in South Carolina
| City | % Federal Government Employees | vs State | vs National | |
| 1. | Daufuskie Island | 51.1% | 4.2%(+46.9)#1 | 3.4%(+47.7)#168 |
| 2. | Govan | 50.0% | 4.2%(+45.8)#2 | 3.4%(+46.6)#174 |
| 3. | Port Royal | 41.7% | 4.2%(+37.6)#3 | 3.4%(+38.3)#233 |
| 4. | Stateburg | 38.3% | 4.2%(+34.1)#4 | 3.4%(+34.9)#264 |
| 5. | Laurel Bay | 32.9% | 4.2%(+28.7)#5 | 3.4%(+29.5)#350 |
| 6. | Pinewood | 31.5% | 4.2%(+27.3)#6 | 3.4%(+28.1)#376 |
| 7. | Goose Creek | 23.3% | 4.2%(+19.1)#7 | 3.4%(+19.9)#645 |
| 8. | Beaufort | 22.4% | 4.2%(+18.2)#8 | 3.4%(+19.0)#701 |
| 9. | Oakland | 21.9% | 4.2%(+17.8)#9 | 3.4%(+18.6)#730 |
| 10. | Ehrhardt | 20.5% | 4.2%(+16.3)#10 | 3.4%(+17.1)#808 |
| 11. | Williams | 20.4% | 4.2%(+16.2)#11 | 3.4%(+17.0)#814 |
| 12. | Sumter | 17.9% | 4.2%(+13.8)#12 | 3.4%(+14.6)#989 |
| 13. | Aynor | 17.6% | 4.2%(+13.5)#13 | 3.4%(+14.3)#1,013 |
| 14. | Blythewood | 17.4% | 4.2%(+13.2)#14 | 3.4%(+14.0)#1,042 |
| 15. | Dalzell | 17.1% | 4.2%(+13.0)#15 | 3.4%(+13.8)#1,065 |
| 16. | Shell Point | 16.5% | 4.2%(+12.4)#16 | 3.4%(+13.2)#1,118 |
| 17. | Salley | 16.2% | 4.2%(+12.1)#17 | 3.4%(+12.8)#1,151 |
| 18. | Adams Run | 15.6% | 4.2%(+11.5)#18 | 3.4%(+12.2)#1,224 |
| 19. | Bonneau | 15.4% | 4.2%(+11.3)#19 | 3.4%(+12.0)#1,243 |
| 20. | Snelling | 15.0% | 4.2%(+10.9)#20 | 3.4%(+11.7)#1,291 |
| 21. | Columbia | 14.7% | 4.2%(+10.6)#21 | 3.4%(+11.3)#1,331 |
| 22. | Kline | 14.3% | 4.2%(+10.1)#22 | 3.4%(+10.9)#1,380 |
| 23. | Warrenville | 14.2% | 4.2%(+10.0)#23 | 3.4%(+10.8)#1,406 |
| 24. | Moncks Corner | 12.7% | 4.2%(+8.53)#24 | 3.4%(+9.31)#1,627 |
| 25. | Wedgefield | 12.3% | 4.2%(+8.18)#25 | 3.4%(+8.95)#1,691 |
| 26. | Blenheim | 12.1% | 4.2%(+7.97)#26 | 3.4%(+8.74)#1,737 |
| 27. | Judson | 11.9% | 4.2%(+7.72)#27 | 3.4%(+8.49)#1,779 |
| 28. | Hanahan | 11.8% | 4.2%(+7.65)#28 | 3.4%(+8.42)#1,792 |
| 29. | Edgefield | 11.4% | 4.2%(+7.24)#29 | 3.4%(+8.01)#1,885 |
| 30. | New Ellenton | 11.3% | 4.2%(+7.17)#30 | 3.4%(+7.95)#1,901 |
| 31. | Dunbar | 11.0% | 4.2%(+6.89)#31 | 3.4%(+7.67)#1,964 |
| 32. | Glendale | 11.0% | 4.2%(+6.89)#32 | 3.4%(+7.67)#1,965 |
| 33. | Ladson | 10.6% | 4.2%(+6.45)#33 | 3.4%(+7.22)#2,058 |
| 34. | Mcbee | 10.5% | 4.2%(+6.38)#34 | 3.4%(+7.15)#2,069 |
| 35. | Elko | 10.4% | 4.2%(+6.27)#35 | 3.4%(+7.04)#2,098 |
| 36. | North Charleston | 9.9% | 4.2%(+5.78)#36 | 3.4%(+6.55)#2,222 |
| 37. | Sullivan S Island | 9.6% | 4.2%(+5.49)#37 | 3.4%(+6.27)#2,296 |
| 38. | Sheldon | 9.6% | 4.2%(+5.41)#38 | 3.4%(+6.19)#2,327 |
| 39. | North Augusta | 9.5% | 4.2%(+5.36)#39 | 3.4%(+6.13)#2,344 |
| 40. | Quinby | 9.5% | 4.2%(+5.35)#40 | 3.4%(+6.12)#2,349 |
| 41. | Lowndesville | 9.3% | 4.2%(+5.11)#41 | 3.4%(+5.88)#2,431 |
| 42. | Beech Island | 9.2% | 4.2%(+5.07)#42 | 3.4%(+5.84)#2,448 |
| 43. | Johnston | 8.9% | 4.2%(+4.76)#43 | 3.4%(+5.53)#2,548 |
| 44. | Mcclellanville | 8.8% | 4.2%(+4.65)#44 | 3.4%(+5.43)#2,591 |
| 45. | West Union | 8.6% | 4.2%(+4.44)#45 | 3.4%(+5.21)#2,677 |
| 46. | Hampton | 8.5% | 4.2%(+4.33)#46 | 3.4%(+5.10)#2,720 |
| 47. | Grover | 8.5% | 4.2%(+4.30)#47 | 3.4%(+5.07)#2,736 |
| 48. | Capitol View | 8.3% | 4.2%(+4.12)#48 | 3.4%(+4.89)#2,810 |
| 49. | Mccormick | 7.7% | 4.2%(+3.57)#49 | 3.4%(+4.34)#3,018 |
| 50. | Lugoff | 7.7% | 4.2%(+3.54)#50 | 3.4%(+4.31)#3,043 |
| 51. | Eastover | 7.7% | 4.2%(+3.50)#51 | 3.4%(+4.28)#3,050 |
| 52. | Slater Marietta | 7.6% | 4.2%(+3.44)#52 | 3.4%(+4.21)#3,083 |
| 53. | Keowee Key | 7.4% | 4.2%(+3.29)#53 | 3.4%(+4.06)#3,157 |
| 54. | Trenton | 7.4% | 4.2%(+3.26)#54 | 3.4%(+4.03)#3,164 |
| 55. | Olar | 7.4% | 4.2%(+3.26)#55 | 3.4%(+4.03)#3,168 |
| 56. | Monarch Mill | 7.3% | 4.2%(+3.15)#56 | 3.4%(+3.92)#3,222 |
| 57. | Winnsboro | 7.3% | 4.2%(+3.11)#57 | 3.4%(+3.88)#3,240 |
| 58. | Elloree | 7.0% | 4.2%(+2.83)#58 | 3.4%(+3.60)#3,401 |
| 59. | Cane Savannah | 6.9% | 4.2%(+2.77)#59 | 3.4%(+3.54)#3,439 |
| 60. | Hemingway | 6.9% | 4.2%(+2.77)#60 | 3.4%(+3.54)#3,440 |
| 61. | Sangaree | 6.8% | 4.2%(+2.69)#61 | 3.4%(+3.46)#3,486 |
| 62. | Hardeeville | 6.8% | 4.2%(+2.64)#62 | 3.4%(+3.41)#3,522 |
| 63. | Summerville | 6.8% | 4.2%(+2.63)#63 | 3.4%(+3.40)#3,526 |
| 64. | Catawba | 6.6% | 4.2%(+2.42)#64 | 3.4%(+3.19)#3,634 |
| 65. | Holly Hill | 6.5% | 4.2%(+2.35)#65 | 3.4%(+3.12)#3,681 |
| 66. | Burnettown | 6.3% | 4.2%(+2.18)#66 | 3.4%(+2.96)#3,777 |
| 67. | Woodfield | 6.3% | 4.2%(+2.13)#67 | 3.4%(+2.91)#3,814 |
| 68. | Greeleyville | 6.2% | 4.2%(+2.01)#68 | 3.4%(+2.79)#3,895 |
| 69. | Homeland Park | 6.0% | 4.2%(+1.87)#69 | 3.4%(+2.65)#4,008 |
| 70. | Springfield | 6.0% | 4.2%(+1.86)#70 | 3.4%(+2.64)#4,015 |
| 71. | Barnwell | 6.0% | 4.2%(+1.84)#71 | 3.4%(+2.62)#4,036 |
| 72. | Wagener | 5.7% | 4.2%(+1.59)#72 | 3.4%(+2.36)#4,254 |
| 73. | Little Rock | 5.7% | 4.2%(+1.58)#73 | 3.4%(+2.35)#4,259 |
| 74. | Seabrook | 5.7% | 4.2%(+1.56)#74 | 3.4%(+2.33)#4,281 |
| 75. | Lake View | 5.7% | 4.2%(+1.50)#75 | 3.4%(+2.27)#4,324 |
| 76. | Loris | 5.6% | 4.2%(+1.40)#76 | 3.4%(+2.18)#4,403 |
| 77. | Langley | 5.4% | 4.2%(+1.29)#77 | 3.4%(+2.06)#4,517 |
| 78. | Varnville | 5.3% | 4.2%(+1.19)#78 | 3.4%(+1.97)#4,610 |
| 79. | Aiken | 5.3% | 4.2%(+1.17)#79 | 3.4%(+1.95)#4,634 |
| 80. | Cherryvale | 5.3% | 4.2%(+1.14)#80 | 3.4%(+1.91)#4,661 |
| 81. | Manning | 5.3% | 4.2%(+1.10)#81 | 3.4%(+1.88)#4,702 |
| 82. | Atlantic Beach | 4.9% | 4.2%(+0.757)#82 | 3.4%(+1.53)#5,066 |
| 83. | Mullins | 4.9% | 4.2%(+0.727)#83 | 3.4%(+1.50)#5,095 |
| 84. | Jackson | 4.8% | 4.2%(+0.662)#84 | 3.4%(+1.44)#5,176 |
| 85. | Burton | 4.8% | 4.2%(+0.654)#85 | 3.4%(+1.43)#5,183 |
| 86. | Cayce | 4.8% | 4.2%(+0.645)#86 | 3.4%(+1.42)#5,193 |
| 87. | Charleston | 4.8% | 4.2%(+0.636)#87 | 3.4%(+1.41)#5,199 |
| 88. | Danwood | 4.8% | 4.2%(+0.632)#88 | 3.4%(+1.40)#5,207 |
| 89. | Alcolu | 4.7% | 4.2%(+0.566)#89 | 3.4%(+1.34)#5,286 |
| 90. | Hollywood | 4.7% | 4.2%(+0.545)#90 | 3.4%(+1.32)#5,308 |
| 91. | Springdale | 4.7% | 4.2%(+0.532)#91 | 3.4%(+1.31)#5,329 |
| 92. | Forest Acres | 4.6% | 4.2%(+0.487)#92 | 3.4%(+1.26)#5,393 |
| 93. | Lane | 4.6% | 4.2%(+0.485)#93 | 3.4%(+1.26)#5,396 |
| 94. | Yemassee | 4.4% | 4.2%(+0.278)#94 | 3.4%(+1.05)#5,649 |
| 95. | Privateer | 4.4% | 4.2%(+0.203)#95 | 3.4%(+0.976)#5,748 |
| 96. | Chapin | 4.3% | 4.2%(+0.133)#96 | 3.4%(+0.906)#5,860 |
| 97. | Williston | 4.3% | 4.2%(+0.132)#97 | 3.4%(+0.905)#5,862 |
| 98. | Ridge Spring | 4.3% | 4.2%(+0.104)#98 | 3.4%(+0.878)#5,902 |
| 99. | Mount Pleasant | 4.2% | 4.2%(+0.063)#99 | 3.4%(+0.836)#5,969 |
| 100. | Clearwater | 4.1% | 4.2%(-0.018)#100 | 3.4%(+0.756)#6,071 |
Common Questions
What are the Top 10 Cities with the Highest Percentage of Federal Government Employees in South Carolina?
Top 10 Cities with the Highest Percentage of Federal Government Employees in South Carolina are:
#1
50.0%
#2
41.7%
#3
38.3%
#4
32.9%
#5
31.5%
#6
23.3%
#7
22.4%
#8
21.9%
#9
20.5%
#10
20.4%
What city has the Highest Percentage of Federal Government Employees in South Carolina?
Govan has the Highest Percentage of Federal Government Employees in South Carolina with 50.0%.
What is the Percentage of Federal Government Employees in the State of South Carolina?
Percentage of Federal Government Employees in South Carolina is 4.2%.
What is the Percentage of Federal Government Employees in the United States?
Percentage of Federal Government Employees in the United States is 3.4%.