Cities with the Highest Percentage of Federal Government Employees in Tennessee
RELATED REPORTS & OPTIONS
Federal Government Employees
Tennessee
Compare Cities
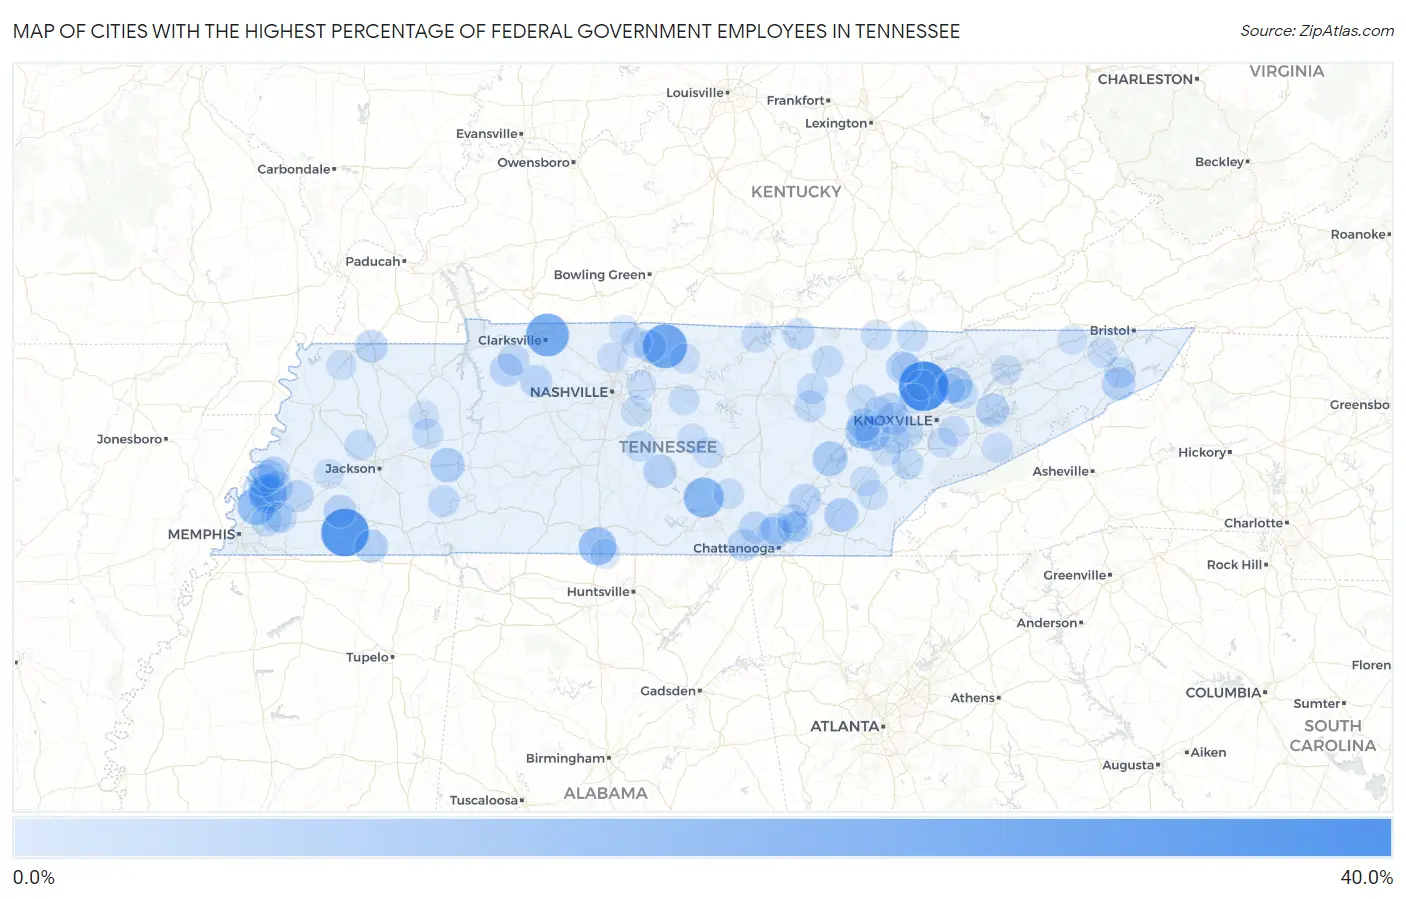
Map of Cities with the Highest Percentage of Federal Government Employees in Tennessee
0.0%
40.0%
Cities with the Highest Percentage of Federal Government Employees in Tennessee
| City | % Federal Government Employees | vs State | vs National | |
| 1. | Andersonville | 30.2% | 3.0%(+27.2)#1 | 3.4%(+26.8)#398 |
| 2. | Hickory Valley | 27.4% | 3.0%(+24.4)#2 | 3.4%(+24.0)#473 |
| 3. | Bethpage | 22.4% | 3.0%(+19.4)#3 | 3.4%(+19.1)#695 |
| 4. | Clarksville | 20.9% | 3.0%(+17.9)#4 | 3.4%(+17.5)#781 |
| 5. | Big Rock | 20.2% | 3.0%(+17.2)#5 | 3.4%(+16.8)#820 |
| 6. | Westpoint | 17.0% | 3.0%(+14.0)#6 | 3.4%(+13.7)#1,074 |
| 7. | Hillsboro | 17.0% | 3.0%(+14.0)#7 | 3.4%(+13.6)#1,078 |
| 8. | Atoka | 15.1% | 3.0%(+12.1)#8 | 3.4%(+11.7)#1,285 |
| 9. | Millington | 13.8% | 3.0%(+10.8)#9 | 3.4%(+10.4)#1,463 |
| 10. | Elkton | 13.6% | 3.0%(+10.6)#10 | 3.4%(+10.3)#1,483 |
| 11. | Briceville | 13.6% | 3.0%(+10.6)#11 | 3.4%(+10.2)#1,494 |
| 12. | Luttrell | 10.3% | 3.0%(+7.25)#12 | 3.4%(+6.89)#2,136 |
| 13. | Kingston | 10.1% | 3.0%(+7.09)#13 | 3.4%(+6.73)#2,183 |
| 14. | Spring City | 9.9% | 3.0%(+6.91)#14 | 3.4%(+6.54)#2,226 |
| 15. | Midtown | 9.8% | 3.0%(+6.82)#15 | 3.4%(+6.46)#2,248 |
| 16. | Darden | 9.3% | 3.0%(+6.32)#16 | 3.4%(+5.96)#2,403 |
| 17. | Charleston | 8.8% | 3.0%(+5.83)#17 | 3.4%(+5.47)#2,575 |
| 18. | Munford | 8.6% | 3.0%(+5.63)#18 | 3.4%(+5.26)#2,662 |
| 19. | Shiloh | 8.5% | 3.0%(+5.48)#19 | 3.4%(+5.11)#2,714 |
| 20. | Bell Buckle | 8.2% | 3.0%(+5.15)#20 | 3.4%(+4.78)#2,859 |
| 21. | Middleton | 7.8% | 3.0%(+4.83)#21 | 3.4%(+4.47)#2,968 |
| 22. | Brighton | 7.8% | 3.0%(+4.79)#22 | 3.4%(+4.43)#2,987 |
| 23. | Unicoi | 7.7% | 3.0%(+4.69)#23 | 3.4%(+4.33)#3,021 |
| 24. | Dandridge | 7.7% | 3.0%(+4.68)#24 | 3.4%(+4.31)#3,023 |
| 25. | Harriman | 7.6% | 3.0%(+4.62)#25 | 3.4%(+4.25)#3,059 |
| 26. | Signal Mountain | 7.6% | 3.0%(+4.58)#26 | 3.4%(+4.21)#3,082 |
| 27. | Whiteville | 7.5% | 3.0%(+4.47)#27 | 3.4%(+4.11)#3,132 |
| 28. | Bon Air | 7.4% | 3.0%(+4.43)#28 | 3.4%(+4.06)#3,154 |
| 29. | Burlison | 7.4% | 3.0%(+4.43)#29 | 3.4%(+4.06)#3,155 |
| 30. | Norene | 7.4% | 3.0%(+4.40)#30 | 3.4%(+4.03)#3,165 |
| 31. | Erin | 7.3% | 3.0%(+4.32)#31 | 3.4%(+3.96)#3,204 |
| 32. | South Fulton | 7.3% | 3.0%(+4.29)#32 | 3.4%(+3.93)#3,218 |
| 33. | Oak Ridge | 7.1% | 3.0%(+4.11)#33 | 3.4%(+3.75)#3,318 |
| 34. | Graball | 7.0% | 3.0%(+4.03)#34 | 3.4%(+3.66)#3,356 |
| 35. | Caryville | 7.0% | 3.0%(+4.01)#35 | 3.4%(+3.64)#3,374 |
| 36. | Sale Creek | 6.9% | 3.0%(+3.89)#36 | 3.4%(+3.53)#3,444 |
| 37. | Gilt Edge | 6.8% | 3.0%(+3.83)#37 | 3.4%(+3.47)#3,484 |
| 38. | Vanleer | 6.8% | 3.0%(+3.81)#38 | 3.4%(+3.44)#3,500 |
| 39. | Jasper | 6.7% | 3.0%(+3.69)#39 | 3.4%(+3.33)#3,559 |
| 40. | Whitwell | 6.2% | 3.0%(+3.23)#40 | 3.4%(+2.87)#3,852 |
| 41. | Mason | 6.2% | 3.0%(+3.18)#41 | 3.4%(+2.81)#3,877 |
| 42. | Garland | 6.2% | 3.0%(+3.15)#42 | 3.4%(+2.79)#3,898 |
| 43. | Oliver Springs | 6.1% | 3.0%(+3.06)#43 | 3.4%(+2.69)#3,974 |
| 44. | Saltillo | 6.0% | 3.0%(+3.03)#44 | 3.4%(+2.66)#3,999 |
| 45. | Fairmount | 5.9% | 3.0%(+2.91)#45 | 3.4%(+2.55)#4,097 |
| 46. | Finley | 5.9% | 3.0%(+2.91)#46 | 3.4%(+2.54)#4,103 |
| 47. | Byrdstown | 5.9% | 3.0%(+2.84)#47 | 3.4%(+2.47)#4,159 |
| 48. | Cumberland City | 5.8% | 3.0%(+2.76)#48 | 3.4%(+2.39)#4,224 |
| 49. | Bowman | 5.6% | 3.0%(+2.59)#49 | 3.4%(+2.23)#4,366 |
| 50. | Allardt | 5.6% | 3.0%(+2.59)#50 | 3.4%(+2.22)#4,371 |
| 51. | Mcdonald | 5.6% | 3.0%(+2.58)#51 | 3.4%(+2.21)#4,376 |
| 52. | Middle Valley | 5.6% | 3.0%(+2.56)#52 | 3.4%(+2.19)#4,387 |
| 53. | Greenback | 5.5% | 3.0%(+2.54)#53 | 3.4%(+2.17)#4,430 |
| 54. | Pine Crest | 5.5% | 3.0%(+2.45)#54 | 3.4%(+2.08)#4,491 |
| 55. | Farragut | 5.4% | 3.0%(+2.34)#55 | 3.4%(+1.98)#4,603 |
| 56. | Rockvale | 5.3% | 3.0%(+2.33)#56 | 3.4%(+1.96)#4,618 |
| 57. | Lakeland | 4.9% | 3.0%(+1.93)#57 | 3.4%(+1.56)#5,024 |
| 58. | Gadsden | 4.9% | 3.0%(+1.88)#58 | 3.4%(+1.52)#5,084 |
| 59. | Bartlett | 4.9% | 3.0%(+1.87)#59 | 3.4%(+1.51)#5,089 |
| 60. | Clarksburg | 4.8% | 3.0%(+1.80)#60 | 3.4%(+1.43)#5,180 |
| 61. | Blaine | 4.8% | 3.0%(+1.79)#61 | 3.4%(+1.42)#5,187 |
| 62. | Clarkrange | 4.8% | 3.0%(+1.79)#62 | 3.4%(+1.42)#5,192 |
| 63. | Jellico | 4.8% | 3.0%(+1.78)#63 | 3.4%(+1.41)#5,196 |
| 64. | Arlington | 4.8% | 3.0%(+1.77)#64 | 3.4%(+1.41)#5,203 |
| 65. | Lakesite | 4.8% | 3.0%(+1.75)#65 | 3.4%(+1.39)#5,218 |
| 66. | Wartburg | 4.7% | 3.0%(+1.66)#66 | 3.4%(+1.29)#5,348 |
| 67. | Watertown | 4.7% | 3.0%(+1.64)#67 | 3.4%(+1.27)#5,366 |
| 68. | New Deal | 4.6% | 3.0%(+1.62)#68 | 3.4%(+1.25)#5,402 |
| 69. | Winfield | 4.6% | 3.0%(+1.58)#69 | 3.4%(+1.21)#5,439 |
| 70. | Centertown | 4.5% | 3.0%(+1.47)#70 | 3.4%(+1.10)#5,576 |
| 71. | La Vergne | 4.4% | 3.0%(+1.44)#71 | 3.4%(+1.07)#5,615 |
| 72. | Altamont | 4.4% | 3.0%(+1.42)#72 | 3.4%(+1.05)#5,650 |
| 73. | Seymour | 4.4% | 3.0%(+1.39)#73 | 3.4%(+1.02)#5,689 |
| 74. | Celina | 4.3% | 3.0%(+1.30)#74 | 3.4%(+0.937)#5,814 |
| 75. | Spurgeon | 4.3% | 3.0%(+1.30)#75 | 3.4%(+0.934)#5,822 |
| 76. | Biltmore | 4.3% | 3.0%(+1.28)#76 | 3.4%(+0.917)#5,841 |
| 77. | Lenoir City | 4.2% | 3.0%(+1.19)#77 | 3.4%(+0.823)#5,988 |
| 78. | Norris | 4.2% | 3.0%(+1.16)#78 | 3.4%(+0.796)#6,010 |
| 79. | Jacksboro | 4.2% | 3.0%(+1.15)#79 | 3.4%(+0.785)#6,036 |
| 80. | Hartsville Trousdale County | 4.2% | 3.0%(+1.15)#80 | 3.4%(+0.782)#6,039 |
| 81. | Plainview | 4.1% | 3.0%(+1.13)#81 | 3.4%(+0.760)#6,065 |
| 82. | Wildwood | 4.1% | 3.0%(+1.12)#82 | 3.4%(+0.758)#6,067 |
| 83. | Ridgetop | 4.1% | 3.0%(+1.11)#83 | 3.4%(+0.746)#6,083 |
| 84. | Woodbury | 4.1% | 3.0%(+1.10)#84 | 3.4%(+0.730)#6,116 |
| 85. | Ardmore | 4.1% | 3.0%(+1.09)#85 | 3.4%(+0.727)#6,123 |
| 86. | Englewood | 4.0% | 3.0%(+1.02)#86 | 3.4%(+0.650)#6,261 |
| 87. | Niota | 4.0% | 3.0%(+1.01)#87 | 3.4%(+0.645)#6,270 |
| 88. | Pittman Center | 4.0% | 3.0%(+0.957)#88 | 3.4%(+0.591)#6,370 |
| 89. | Coalfield | 4.0% | 3.0%(+0.944)#89 | 3.4%(+0.578)#6,397 |
| 90. | Troy | 3.9% | 3.0%(+0.905)#90 | 3.4%(+0.539)#6,456 |
| 91. | Bean Station | 3.9% | 3.0%(+0.866)#91 | 3.4%(+0.500)#6,509 |
| 92. | Soddy Daisy | 3.9% | 3.0%(+0.854)#92 | 3.4%(+0.488)#6,525 |
| 93. | Clinton | 3.8% | 3.0%(+0.803)#93 | 3.4%(+0.437)#6,611 |
| 94. | Loudon | 3.8% | 3.0%(+0.801)#94 | 3.4%(+0.435)#6,614 |
| 95. | Church Hill | 3.8% | 3.0%(+0.767)#95 | 3.4%(+0.401)#6,674 |
| 96. | Valley Forge | 3.8% | 3.0%(+0.762)#96 | 3.4%(+0.396)#6,682 |
| 97. | Brownsville | 3.7% | 3.0%(+0.710)#97 | 3.4%(+0.344)#6,761 |
| 98. | Orlinda | 3.7% | 3.0%(+0.685)#98 | 3.4%(+0.319)#6,818 |
| 99. | Huntingdon | 3.7% | 3.0%(+0.684)#99 | 3.4%(+0.318)#6,820 |
| 100. | Mount Juliet | 3.6% | 3.0%(+0.611)#100 | 3.4%(+0.245)#6,943 |
Common Questions
What are the Top 10 Cities with the Highest Percentage of Federal Government Employees in Tennessee?
Top 10 Cities with the Highest Percentage of Federal Government Employees in Tennessee are:
#1
30.2%
#2
27.4%
#3
22.4%
#4
20.9%
#5
17.0%
#6
15.1%
#7
13.8%
#8
13.6%
#9
10.3%
#10
10.1%
What city has the Highest Percentage of Federal Government Employees in Tennessee?
Andersonville has the Highest Percentage of Federal Government Employees in Tennessee with 30.2%.
What is the Percentage of Federal Government Employees in the State of Tennessee?
Percentage of Federal Government Employees in Tennessee is 3.0%.
What is the Percentage of Federal Government Employees in the United States?
Percentage of Federal Government Employees in the United States is 3.4%.