Cities with the Highest Percentage of Federal Government Employees in New York
RELATED REPORTS & OPTIONS
Federal Government Employees
New York
Compare Cities
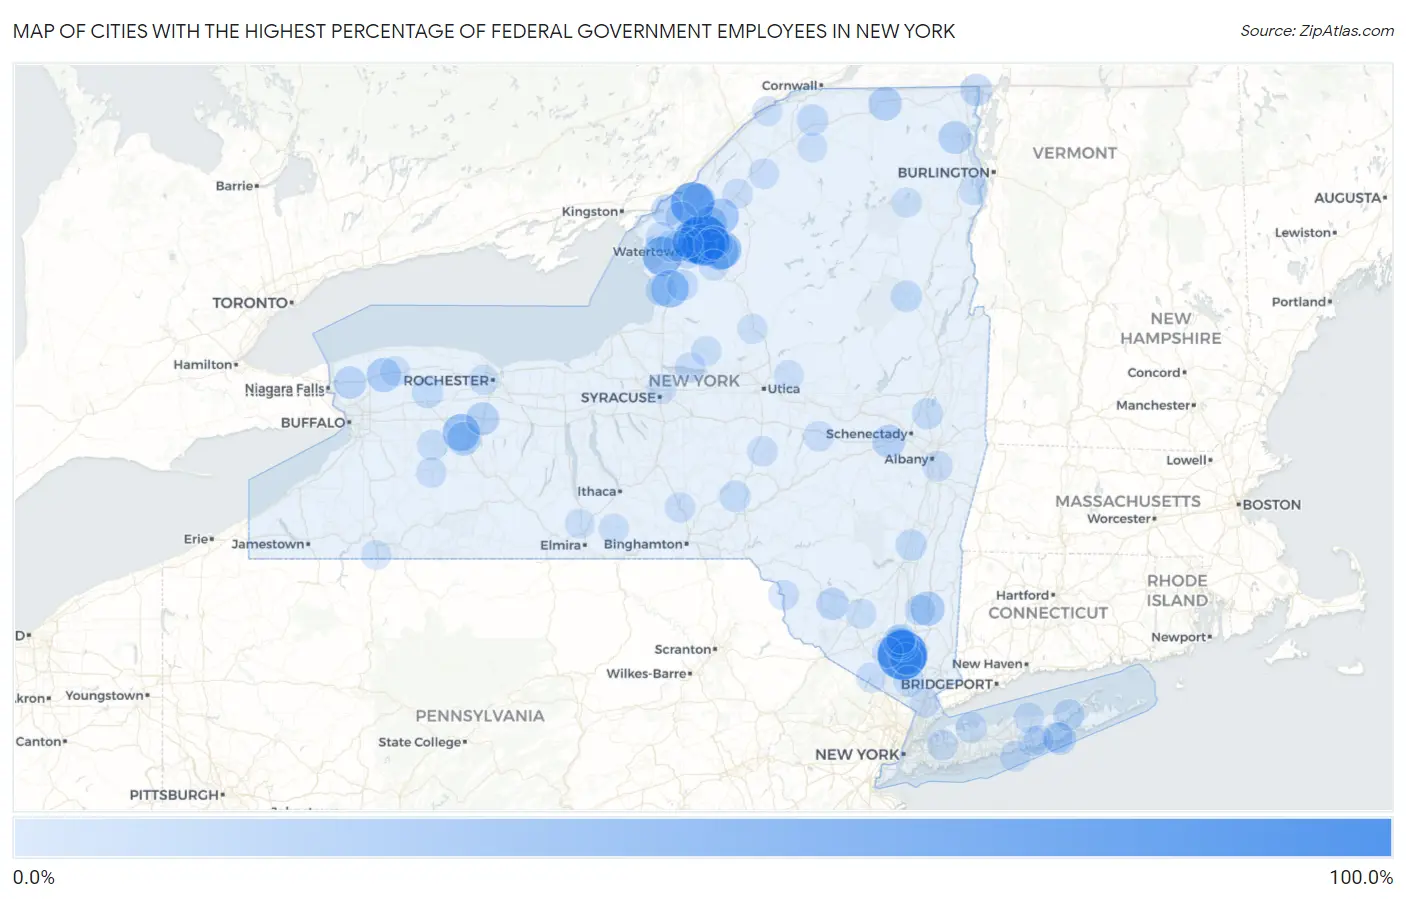
Map of Cities with the Highest Percentage of Federal Government Employees in New York
0.0%
100.0%
Cities with the Highest Percentage of Federal Government Employees in New York
| City | % Federal Government Employees | vs State | vs National | |
| 1. | West Point | 80.6% | 2.1%(+78.5)#1 | 3.4%(+77.2)#66 |
| 2. | Fort Drum | 79.3% | 2.1%(+77.1)#2 | 3.4%(+75.9)#73 |
| 3. | Calcium | 57.7% | 2.1%(+55.5)#3 | 3.4%(+54.3)#136 |
| 4. | Plessis | 55.6% | 2.1%(+53.5)#4 | 3.4%(+52.2)#147 |
| 5. | Felts Mills | 49.2% | 2.1%(+47.1)#5 | 3.4%(+45.9)#182 |
| 6. | Sackets Harbor | 40.6% | 2.1%(+38.5)#6 | 3.4%(+37.2)#245 |
| 7. | Highland Falls | 37.0% | 2.1%(+34.8)#7 | 3.4%(+33.6)#274 |
| 8. | Carthage | 33.9% | 2.1%(+31.8)#8 | 3.4%(+30.5)#320 |
| 9. | Pierrepont Manor | 33.5% | 2.1%(+31.4)#9 | 3.4%(+30.1)#327 |
| 10. | West Carthage | 32.5% | 2.1%(+30.4)#10 | 3.4%(+29.1)#356 |
| 11. | Wadsworth | 31.5% | 2.1%(+29.3)#11 | 3.4%(+28.1)#374 |
| 12. | Evans Mills | 30.7% | 2.1%(+28.6)#12 | 3.4%(+27.3)#388 |
| 13. | Black River | 25.7% | 2.1%(+23.6)#13 | 3.4%(+22.4)#529 |
| 14. | Antwerp | 25.1% | 2.1%(+23.0)#14 | 3.4%(+21.7)#559 |
| 15. | Philadelphia | 23.1% | 2.1%(+21.0)#15 | 3.4%(+19.7)#653 |
| 16. | Woodbourne | 21.9% | 2.1%(+19.8)#16 | 3.4%(+18.5)#732 |
| 17. | Freedom Plains | 21.6% | 2.1%(+19.5)#17 | 3.4%(+18.3)#748 |
| 18. | Gasport | 20.7% | 2.1%(+18.6)#18 | 3.4%(+17.4)#790 |
| 19. | Clifton Knolls-Mill Creek | 19.3% | 2.1%(+17.1)#19 | 3.4%(+15.9)#889 |
| 20. | Cuylerville | 19.1% | 2.1%(+17.0)#20 | 3.4%(+15.7)#910 |
| 21. | Burke | 18.7% | 2.1%(+16.5)#21 | 3.4%(+15.3)#942 |
| 22. | Herrings | 17.4% | 2.1%(+15.2)#22 | 3.4%(+14.0)#1,041 |
| 23. | Deferiet | 17.0% | 2.1%(+14.8)#23 | 3.4%(+13.6)#1,079 |
| 24. | Duanesburg | 16.7% | 2.1%(+14.5)#24 | 3.4%(+13.3)#1,096 |
| 25. | Redwood | 16.7% | 2.1%(+14.5)#25 | 3.4%(+13.3)#1,097 |
| 26. | Morrisonville | 16.6% | 2.1%(+14.5)#26 | 3.4%(+13.3)#1,111 |
| 27. | East Avon | 16.5% | 2.1%(+14.3)#27 | 3.4%(+13.1)#1,123 |
| 28. | Cornwall On Hudson | 14.7% | 2.1%(+12.6)#28 | 3.4%(+11.3)#1,330 |
| 29. | Sanborn | 14.7% | 2.1%(+12.5)#29 | 3.4%(+11.3)#1,335 |
| 30. | South Fallsburg | 13.8% | 2.1%(+11.7)#30 | 3.4%(+10.4)#1,464 |
| 31. | Quiogue | 13.8% | 2.1%(+11.7)#31 | 3.4%(+10.4)#1,465 |
| 32. | Watertown | 13.6% | 2.1%(+11.5)#32 | 3.4%(+10.2)#1,491 |
| 33. | Rouses Point | 13.1% | 2.1%(+10.9)#33 | 3.4%(+9.70)#1,572 |
| 34. | Great Bend | 13.0% | 2.1%(+10.9)#34 | 3.4%(+9.63)#1,587 |
| 35. | Vails Gate | 12.8% | 2.1%(+10.7)#35 | 3.4%(+9.43)#1,612 |
| 36. | Clayton | 12.5% | 2.1%(+10.4)#36 | 3.4%(+9.15)#1,651 |
| 37. | Kauneonga Lake | 12.3% | 2.1%(+10.2)#37 | 3.4%(+8.94)#1,696 |
| 38. | La Fargeville | 12.1% | 2.1%(+9.99)#38 | 3.4%(+8.76)#1,732 |
| 39. | West Danby | 11.7% | 2.1%(+9.59)#39 | 3.4%(+8.35)#1,814 |
| 40. | Winthrop | 11.2% | 2.1%(+9.06)#40 | 3.4%(+7.82)#1,919 |
| 41. | Ellisburg | 11.1% | 2.1%(+8.97)#41 | 3.4%(+7.73)#1,942 |
| 42. | Otter Lake | 11.1% | 2.1%(+8.97)#42 | 3.4%(+7.73)#1,946 |
| 43. | Westernville | 10.9% | 2.1%(+8.77)#43 | 3.4%(+7.53)#1,985 |
| 44. | Elba | 10.9% | 2.1%(+8.71)#44 | 3.4%(+7.47)#1,997 |
| 45. | Dexter | 10.8% | 2.1%(+8.70)#45 | 3.4%(+7.47)#1,998 |
| 46. | Malden On Hudson | 10.7% | 2.1%(+8.60)#46 | 3.4%(+7.37)#2,026 |
| 47. | Laurel | 10.6% | 2.1%(+8.44)#47 | 3.4%(+7.20)#2,061 |
| 48. | South Ilion | 10.4% | 2.1%(+8.25)#48 | 3.4%(+7.01)#2,104 |
| 49. | Fort Montgomery | 10.4% | 2.1%(+8.21)#49 | 3.4%(+6.98)#2,113 |
| 50. | North Creek | 10.3% | 2.1%(+8.20)#50 | 3.4%(+6.97)#2,119 |
| 51. | Firthcliffe | 10.2% | 2.1%(+8.06)#51 | 3.4%(+6.82)#2,159 |
| 52. | Guilford | 10.1% | 2.1%(+7.98)#52 | 3.4%(+6.75)#2,177 |
| 53. | Lorraine | 10.0% | 2.1%(+7.86)#53 | 3.4%(+6.62)#2,208 |
| 54. | Chaumont | 9.7% | 2.1%(+7.60)#54 | 3.4%(+6.37)#2,270 |
| 55. | Round Lake | 9.4% | 2.1%(+7.22)#55 | 3.4%(+5.99)#2,390 |
| 56. | Clifton Gardens | 9.2% | 2.1%(+7.10)#56 | 3.4%(+5.87)#2,440 |
| 57. | Haverstraw | 9.2% | 2.1%(+7.07)#57 | 3.4%(+5.83)#2,452 |
| 58. | Brownville | 9.0% | 2.1%(+6.84)#58 | 3.4%(+5.61)#2,528 |
| 59. | Grahamsville | 8.9% | 2.1%(+6.79)#59 | 3.4%(+5.55)#2,538 |
| 60. | Halesite | 8.7% | 2.1%(+6.60)#60 | 3.4%(+5.37)#2,615 |
| 61. | Copenhagen | 8.7% | 2.1%(+6.60)#61 | 3.4%(+5.37)#2,619 |
| 62. | Titusville | 8.7% | 2.1%(+6.51)#62 | 3.4%(+5.27)#2,657 |
| 63. | Searingtown | 8.4% | 2.1%(+6.22)#63 | 3.4%(+4.99)#2,773 |
| 64. | Warsaw | 8.2% | 2.1%(+6.09)#64 | 3.4%(+4.86)#2,822 |
| 65. | Fire Island | 8.1% | 2.1%(+5.98)#65 | 3.4%(+4.75)#2,876 |
| 66. | New Baltimore | 8.0% | 2.1%(+5.88)#66 | 3.4%(+4.64)#2,908 |
| 67. | Mountain Lodge Park | 7.7% | 2.1%(+5.58)#67 | 3.4%(+4.34)#3,017 |
| 68. | Pamelia Center | 7.6% | 2.1%(+5.46)#68 | 3.4%(+4.22)#3,072 |
| 69. | Cherry Valley | 7.4% | 2.1%(+5.24)#69 | 3.4%(+4.00)#3,186 |
| 70. | Westhampton | 7.4% | 2.1%(+5.24)#70 | 3.4%(+4.00)#3,188 |
| 71. | East Greenbush | 7.4% | 2.1%(+5.23)#71 | 3.4%(+4.00)#3,190 |
| 72. | Callicoon | 7.4% | 2.1%(+5.23)#72 | 3.4%(+3.99)#3,192 |
| 73. | Whitney Point | 7.1% | 2.1%(+4.97)#73 | 3.4%(+3.73)#3,326 |
| 74. | Hermon | 7.1% | 2.1%(+4.94)#74 | 3.4%(+3.70)#3,338 |
| 75. | Edmeston | 6.9% | 2.1%(+4.74)#75 | 3.4%(+3.50)#3,464 |
| 76. | Cleveland | 6.8% | 2.1%(+4.69)#76 | 3.4%(+3.45)#3,491 |
| 77. | Lake Delta | 6.8% | 2.1%(+4.62)#77 | 3.4%(+3.39)#3,534 |
| 78. | Pike | 6.7% | 2.1%(+4.52)#78 | 3.4%(+3.29)#3,578 |
| 79. | Gates | 6.6% | 2.1%(+4.51)#79 | 3.4%(+3.27)#3,594 |
| 80. | Shoreham | 6.6% | 2.1%(+4.42)#80 | 3.4%(+3.19)#3,635 |
| 81. | Gouverneur | 6.5% | 2.1%(+4.37)#81 | 3.4%(+3.13)#3,673 |
| 82. | Elmsford | 6.5% | 2.1%(+4.36)#82 | 3.4%(+3.13)#3,679 |
| 83. | Willsboro | 6.4% | 2.1%(+4.26)#83 | 3.4%(+3.02)#3,728 |
| 84. | Greenwood Lake | 6.4% | 2.1%(+4.25)#84 | 3.4%(+3.01)#3,739 |
| 85. | Walker Valley | 6.3% | 2.1%(+4.18)#85 | 3.4%(+2.95)#3,784 |
| 86. | Camden | 6.3% | 2.1%(+4.16)#86 | 3.4%(+2.92)#3,802 |
| 87. | Lake Placid | 6.1% | 2.1%(+3.96)#87 | 3.4%(+2.72)#3,956 |
| 88. | Van Etten | 6.1% | 2.1%(+3.94)#88 | 3.4%(+2.71)#3,964 |
| 89. | Newport | 6.1% | 2.1%(+3.93)#89 | 3.4%(+2.70)#3,970 |
| 90. | Hurleyville | 6.0% | 2.1%(+3.88)#90 | 3.4%(+2.65)#4,010 |
| 91. | Waddington | 6.0% | 2.1%(+3.88)#91 | 3.4%(+2.64)#4,011 |
| 92. | Parishville | 5.9% | 2.1%(+3.78)#92 | 3.4%(+2.55)#4,099 |
| 93. | Limestone | 5.9% | 2.1%(+3.77)#93 | 3.4%(+2.54)#4,107 |
| 94. | Boonville | 5.9% | 2.1%(+3.75)#94 | 3.4%(+2.51)#4,119 |
| 95. | Pine Valley | 5.9% | 2.1%(+3.72)#95 | 3.4%(+2.48)#4,153 |
| 96. | Shirley | 5.9% | 2.1%(+3.71)#96 | 3.4%(+2.48)#4,157 |
| 97. | Mattydale | 5.9% | 2.1%(+3.71)#97 | 3.4%(+2.47)#4,160 |
| 98. | Moriches | 5.8% | 2.1%(+3.67)#98 | 3.4%(+2.43)#4,192 |
| 99. | Middleport | 5.7% | 2.1%(+3.53)#99 | 3.4%(+2.29)#4,307 |
| 100. | New Windsor | 5.7% | 2.1%(+3.51)#100 | 3.4%(+2.28)#4,323 |
Common Questions
What are the Top 10 Cities with the Highest Percentage of Federal Government Employees in New York?
Top 10 Cities with the Highest Percentage of Federal Government Employees in New York are:
#1
80.6%
#2
79.3%
#3
57.7%
#4
55.6%
#5
49.2%
#6
40.6%
#7
37.0%
#8
33.9%
#9
33.5%
#10
32.5%
What city has the Highest Percentage of Federal Government Employees in New York?
West Point has the Highest Percentage of Federal Government Employees in New York with 80.6%.
What is the Percentage of Federal Government Employees in the State of New York?
Percentage of Federal Government Employees in New York is 2.1%.
What is the Percentage of Federal Government Employees in the United States?
Percentage of Federal Government Employees in the United States is 3.4%.