Cities with the Highest Percentage of Population Employed in Manufacturing in South Dakota
RELATED REPORTS & OPTIONS
Manufacturing
South Dakota
Compare Cities
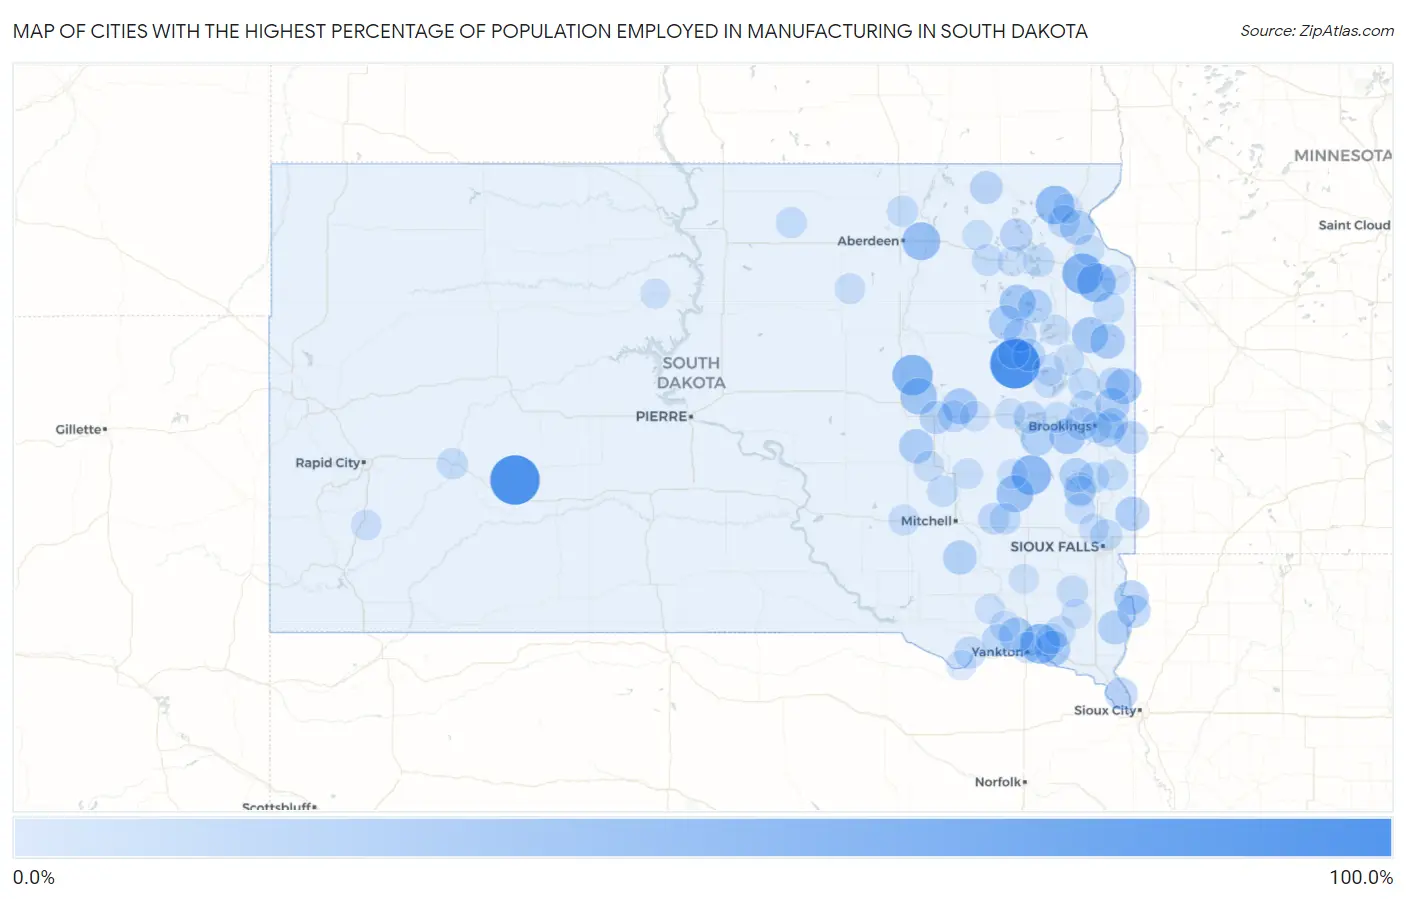
Map of Cities with the Highest Percentage of Population Employed in Manufacturing in South Dakota
0.0%
100.0%
Cities with the Highest Percentage of Population Employed in Manufacturing in South Dakota
| City | % Employed | vs State | vs National | |
| 1. | Vienna | 100.0% | 10.1%(+89.9)#1 | 10.0%(+90.0)#18 |
| 2. | Cottonwood | 100.0% | 10.1%(+89.9)#2 | 10.0%(+90.0)#28 |
| 3. | Marvin | 60.0% | 10.1%(+49.9)#3 | 10.0%(+50.0)#206 |
| 4. | Hitchcock | 59.5% | 10.1%(+49.4)#4 | 10.0%(+49.5)#211 |
| 5. | Winfred | 56.5% | 10.1%(+46.4)#5 | 10.0%(+46.5)#250 |
| 6. | Mission Hill | 56.3% | 10.1%(+46.2)#6 | 10.0%(+46.3)#254 |
| 7. | Twin Brooks | 52.6% | 10.1%(+42.6)#7 | 10.0%(+42.6)#327 |
| 8. | Long Hollow | 51.2% | 10.1%(+41.1)#8 | 10.0%(+41.2)#355 |
| 9. | Bath Corner | 48.9% | 10.1%(+38.8)#9 | 10.0%(+38.9)#425 |
| 10. | Canova | 44.6% | 10.1%(+34.6)#10 | 10.0%(+34.7)#566 |
| 11. | Broadland | 42.9% | 10.1%(+32.8)#11 | 10.0%(+32.9)#668 |
| 12. | Goodwin | 40.0% | 10.1%(+29.9)#12 | 10.0%(+30.0)#838 |
| 13. | Wallace | 39.3% | 10.1%(+29.2)#13 | 10.0%(+29.3)#880 |
| 14. | Sinai | 38.6% | 10.1%(+28.5)#14 | 10.0%(+28.6)#935 |
| 15. | Gayville | 38.5% | 10.1%(+28.4)#15 | 10.0%(+28.5)#937 |
| 16. | Yale | 38.4% | 10.1%(+28.3)#16 | 10.0%(+28.4)#951 |
| 17. | Astoria | 37.8% | 10.1%(+27.7)#17 | 10.0%(+27.8)#1,005 |
| 18. | Altamont | 35.7% | 10.1%(+25.6)#18 | 10.0%(+25.7)#1,203 |
| 19. | Utica | 35.5% | 10.1%(+25.4)#19 | 10.0%(+25.5)#1,231 |
| 20. | Burbank | 34.4% | 10.1%(+24.3)#20 | 10.0%(+24.4)#1,364 |
| 21. | Garden City | 34.1% | 10.1%(+24.0)#21 | 10.0%(+24.1)#1,408 |
| 22. | Peever | 34.0% | 10.1%(+23.9)#22 | 10.0%(+24.0)#1,418 |
| 23. | Alpena | 33.5% | 10.1%(+23.4)#23 | 10.0%(+23.5)#1,476 |
| 24. | Aurora | 32.9% | 10.1%(+22.9)#24 | 10.0%(+22.9)#1,566 |
| 25. | White | 32.5% | 10.1%(+22.5)#25 | 10.0%(+22.6)#1,615 |
| 26. | Fairview | 32.1% | 10.1%(+22.1)#26 | 10.0%(+22.2)#1,669 |
| 27. | Sherman | 32.1% | 10.1%(+22.1)#27 | 10.0%(+22.2)#1,671 |
| 28. | Dimock | 31.6% | 10.1%(+21.5)#28 | 10.0%(+21.6)#1,776 |
| 29. | Florence | 31.5% | 10.1%(+21.5)#29 | 10.0%(+21.6)#1,784 |
| 30. | Alcester | 31.3% | 10.1%(+21.2)#30 | 10.0%(+21.3)#1,821 |
| 31. | Boulder Canyon | 31.3% | 10.1%(+21.2)#31 | 10.0%(+21.3)#1,825 |
| 32. | Wentworth | 30.6% | 10.1%(+20.6)#32 | 10.0%(+20.7)#1,945 |
| 33. | Oldham | 30.5% | 10.1%(+20.4)#33 | 10.0%(+20.5)#1,979 |
| 34. | Hudson | 28.6% | 10.1%(+18.6)#34 | 10.0%(+18.6)#2,374 |
| 35. | Rowena | 28.6% | 10.1%(+18.5)#35 | 10.0%(+18.6)#2,398 |
| 36. | Elkton | 28.5% | 10.1%(+18.4)#36 | 10.0%(+18.5)#2,428 |
| 37. | Huron | 28.4% | 10.1%(+18.3)#37 | 10.0%(+18.4)#2,449 |
| 38. | Brant Lake South | 27.2% | 10.1%(+17.1)#38 | 10.0%(+17.2)#2,795 |
| 39. | Henry | 27.1% | 10.1%(+17.0)#39 | 10.0%(+17.1)#2,836 |
| 40. | Britton | 26.6% | 10.1%(+16.5)#40 | 10.0%(+16.6)#2,974 |
| 41. | Roslyn | 26.4% | 10.1%(+16.3)#41 | 10.0%(+16.4)#3,028 |
| 42. | Volga | 26.2% | 10.1%(+16.2)#42 | 10.0%(+16.2)#3,060 |
| 43. | Jefferson | 26.1% | 10.1%(+16.1)#43 | 10.0%(+16.2)#3,097 |
| 44. | Toronto | 25.9% | 10.1%(+15.8)#44 | 10.0%(+15.9)#3,178 |
| 45. | Hazel | 25.8% | 10.1%(+15.7)#45 | 10.0%(+15.8)#3,205 |
| 46. | Agency Village | 25.5% | 10.1%(+15.4)#46 | 10.0%(+15.5)#3,301 |
| 47. | Lake Preston | 25.3% | 10.1%(+15.2)#47 | 10.0%(+15.3)#3,369 |
| 48. | Bushnell | 23.3% | 10.1%(+13.3)#48 | 10.0%(+13.3)#4,099 |
| 49. | Springfield | 23.2% | 10.1%(+13.1)#49 | 10.0%(+13.2)#4,148 |
| 50. | Cavour | 23.1% | 10.1%(+13.1)#50 | 10.0%(+13.2)#4,166 |
| 51. | Naples | 23.1% | 10.1%(+13.0)#51 | 10.0%(+13.1)#4,189 |
| 52. | Clark Colony | 22.2% | 10.1%(+12.1)#52 | 10.0%(+12.2)#4,580 |
| 53. | Farmer | 22.2% | 10.1%(+12.1)#53 | 10.0%(+12.2)#4,581 |
| 54. | Tabor | 22.0% | 10.1%(+11.9)#54 | 10.0%(+12.0)#4,663 |
| 55. | Bristol | 21.5% | 10.1%(+11.4)#55 | 10.0%(+11.5)#4,933 |
| 56. | La Bolt | 21.4% | 10.1%(+11.4)#56 | 10.0%(+11.4)#4,975 |
| 57. | Yankton | 21.1% | 10.1%(+11.0)#57 | 10.0%(+11.1)#5,139 |
| 58. | Waubay | 21.0% | 10.1%(+10.9)#58 | 10.0%(+11.0)#5,190 |
| 59. | Meadow View Addition | 21.0% | 10.1%(+10.9)#59 | 10.0%(+11.0)#5,195 |
| 60. | Letcher | 20.9% | 10.1%(+10.9)#60 | 10.0%(+10.9)#5,223 |
| 61. | Davis | 20.9% | 10.1%(+10.9)#61 | 10.0%(+10.9)#5,224 |
| 62. | Egan | 20.8% | 10.1%(+10.7)#62 | 10.0%(+10.8)#5,287 |
| 63. | Estelline | 20.8% | 10.1%(+10.7)#63 | 10.0%(+10.8)#5,306 |
| 64. | Westport | 20.6% | 10.1%(+10.5)#64 | 10.0%(+10.6)#5,404 |
| 65. | Spencer | 20.5% | 10.1%(+10.4)#65 | 10.0%(+10.5)#5,446 |
| 66. | Bruce | 20.5% | 10.1%(+10.4)#66 | 10.0%(+10.5)#5,470 |
| 67. | Wakonda | 20.3% | 10.1%(+10.3)#67 | 10.0%(+10.3)#5,566 |
| 68. | Glendale Colony | 20.0% | 10.1%(+9.93)#68 | 10.0%(+10.0)#5,748 |
| 69. | Volin | 19.8% | 10.1%(+9.73)#69 | 10.0%(+9.81)#5,873 |
| 70. | Colman | 19.7% | 10.1%(+9.58)#70 | 10.0%(+9.67)#5,947 |
| 71. | Brookings | 19.5% | 10.1%(+9.39)#71 | 10.0%(+9.47)#6,077 |
| 72. | Hosmer | 19.4% | 10.1%(+9.28)#72 | 10.0%(+9.36)#6,143 |
| 73. | Wasta | 19.4% | 10.1%(+9.28)#73 | 10.0%(+9.36)#6,153 |
| 74. | Arlington | 19.2% | 10.1%(+9.18)#74 | 10.0%(+9.26)#6,235 |
| 75. | Hayti | 19.0% | 10.1%(+8.98)#75 | 10.0%(+9.06)#6,398 |
| 76. | Chester | 19.0% | 10.1%(+8.98)#76 | 10.0%(+9.06)#6,401 |
| 77. | Plankinton | 19.0% | 10.1%(+8.94)#77 | 10.0%(+9.02)#6,428 |
| 78. | Lake Norden | 19.0% | 10.1%(+8.90)#78 | 10.0%(+8.98)#6,448 |
| 79. | Castlewood | 18.6% | 10.1%(+8.56)#79 | 10.0%(+8.64)#6,669 |
| 80. | Cresbard | 18.6% | 10.1%(+8.53)#80 | 10.0%(+8.61)#6,687 |
| 81. | Colton | 18.5% | 10.1%(+8.40)#81 | 10.0%(+8.48)#6,786 |
| 82. | Woonsocket | 18.4% | 10.1%(+8.36)#82 | 10.0%(+8.44)#6,813 |
| 83. | Artesian | 18.3% | 10.1%(+8.20)#83 | 10.0%(+8.28)#6,904 |
| 84. | Lesterville | 18.2% | 10.1%(+8.11)#84 | 10.0%(+8.19)#6,974 |
| 85. | Wilmot | 17.7% | 10.1%(+7.61)#85 | 10.0%(+7.69)#7,325 |
| 86. | Watertown | 17.7% | 10.1%(+7.58)#86 | 10.0%(+7.67)#7,341 |
| 87. | Fairburn | 17.6% | 10.1%(+7.57)#87 | 10.0%(+7.66)#7,359 |
| 88. | De Smet | 17.3% | 10.1%(+7.28)#88 | 10.0%(+7.36)#7,545 |
| 89. | Iroquois | 17.0% | 10.1%(+6.91)#89 | 10.0%(+6.99)#7,824 |
| 90. | Crooks | 16.9% | 10.1%(+6.80)#90 | 10.0%(+6.89)#7,890 |
| 91. | Pierpont | 16.7% | 10.1%(+6.59)#91 | 10.0%(+6.68)#8,064 |
| 92. | Milbank | 16.5% | 10.1%(+6.38)#92 | 10.0%(+6.47)#8,237 |
| 93. | Howard | 16.1% | 10.1%(+6.05)#93 | 10.0%(+6.13)#8,507 |
| 94. | Running Water | 16.0% | 10.1%(+5.93)#94 | 10.0%(+6.01)#8,608 |
| 95. | Freeman | 16.0% | 10.1%(+5.90)#95 | 10.0%(+5.99)#8,633 |
| 96. | Scotland | 15.9% | 10.1%(+5.84)#96 | 10.0%(+5.92)#8,685 |
| 97. | La Plant | 15.9% | 10.1%(+5.84)#97 | 10.0%(+5.92)#8,691 |
| 98. | Webster | 15.9% | 10.1%(+5.81)#98 | 10.0%(+5.89)#8,713 |
| 99. | Sisseton | 15.7% | 10.1%(+5.63)#99 | 10.0%(+5.71)#8,891 |
| 100. | Centerville | 15.5% | 10.1%(+5.47)#100 | 10.0%(+5.55)#9,056 |
Common Questions
What are the Top 10 Cities with the Highest Percentage of Population Employed in Manufacturing in South Dakota?
Top 10 Cities with the Highest Percentage of Population Employed in Manufacturing in South Dakota are:
#1
100.0%
#2
100.0%
#3
60.0%
#4
59.5%
#5
56.5%
#6
56.3%
#7
52.6%
#8
51.2%
#9
48.9%
#10
44.6%
What city has the Highest Percentage of Population Employed in Manufacturing in South Dakota?
Vienna has the Highest Percentage of Population Employed in Manufacturing in South Dakota with 100.0%.
What is the Percentage of Population Employed in Manufacturing in the State of South Dakota?
Percentage of Population Employed in Manufacturing in South Dakota is 10.1%.
What is the Percentage of Population Employed in Manufacturing in the United States?
Percentage of Population Employed in Manufacturing in the United States is 10.0%.