Cities with the Highest Percentage of Population Employed in Manufacturing in Michigan
RELATED REPORTS & OPTIONS
Manufacturing
Michigan
Compare Cities
Map of Cities with the Highest Percentage of Population Employed in Manufacturing in Michigan
0.0%
80.0%
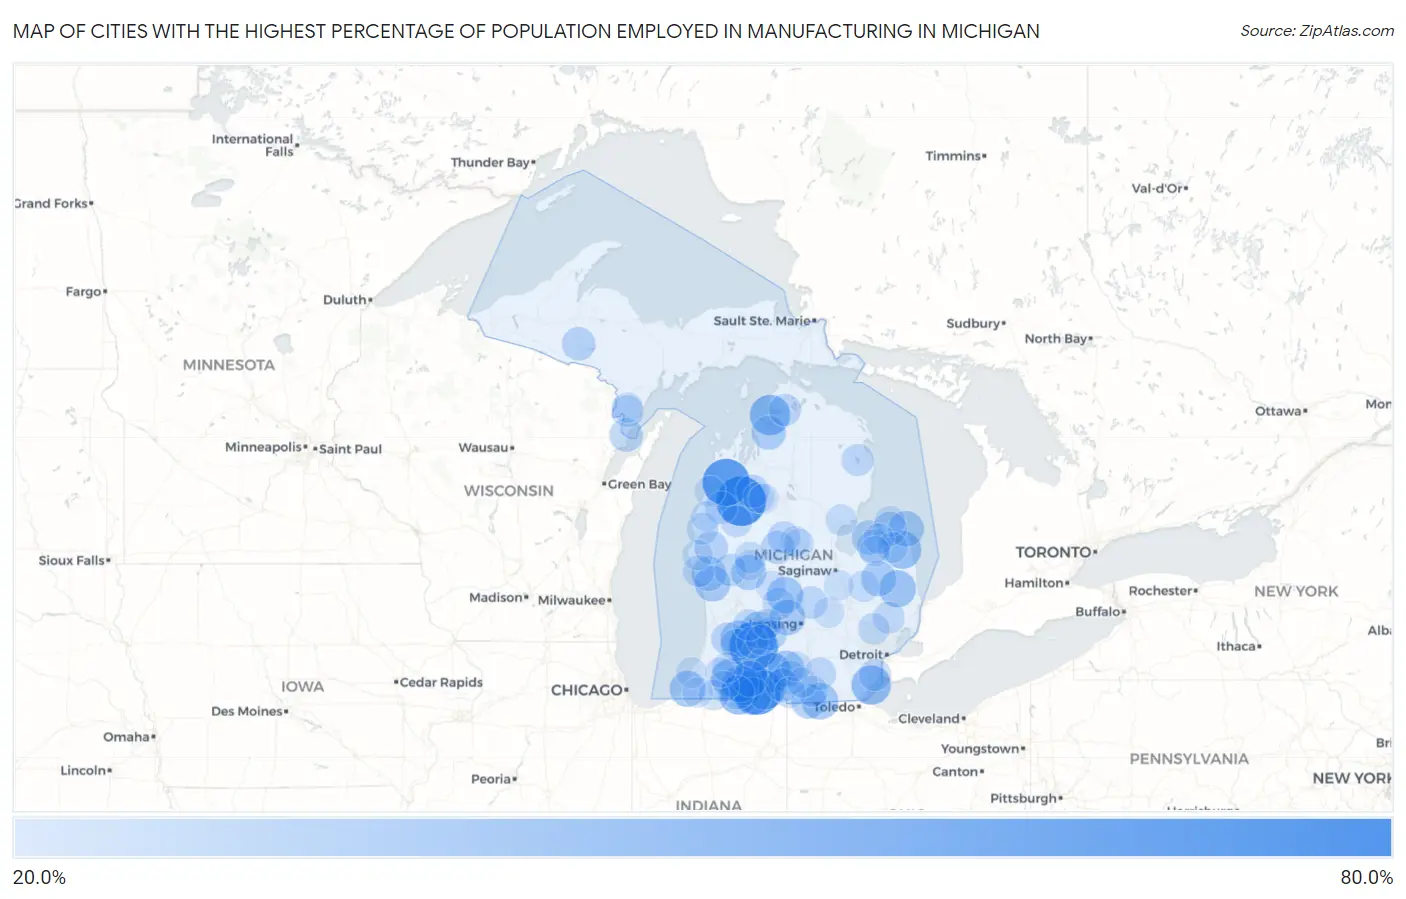
Cities with the Highest Percentage of Population Employed in Manufacturing in Michigan
| City | % Employed | vs State | vs National | |
| 1. | Boon | 60.9% | 18.6%(+42.3)#1 | 10.0%(+50.9)#194 |
| 2. | Hickory Corners | 59.1% | 18.6%(+40.6)#2 | 10.0%(+49.1)#212 |
| 3. | Nessen City | 57.1% | 18.6%(+38.6)#3 | 10.0%(+47.2)#235 |
| 4. | Burr Oak | 56.6% | 18.6%(+38.0)#4 | 10.0%(+46.6)#248 |
| 5. | Scotts | 55.1% | 18.6%(+36.5)#5 | 10.0%(+45.1)#275 |
| 6. | Bay Shore | 45.1% | 18.6%(+26.6)#6 | 10.0%(+35.1)#547 |
| 7. | Burlington | 44.4% | 18.6%(+25.9)#7 | 10.0%(+34.5)#571 |
| 8. | Detroit Beach | 43.2% | 18.6%(+24.7)#8 | 10.0%(+33.2)#644 |
| 9. | White Pigeon | 42.9% | 18.6%(+24.4)#9 | 10.0%(+32.9)#655 |
| 10. | Bronson | 42.9% | 18.6%(+24.3)#10 | 10.0%(+32.9)#656 |
| 11. | Centreville | 40.8% | 18.6%(+22.2)#11 | 10.0%(+30.8)#778 |
| 12. | Minden City | 40.6% | 18.6%(+22.1)#12 | 10.0%(+30.6)#791 |
| 13. | Marcellus | 40.3% | 18.6%(+21.7)#13 | 10.0%(+30.3)#814 |
| 14. | Sturgis | 40.1% | 18.6%(+21.5)#14 | 10.0%(+30.1)#828 |
| 15. | Three Rivers | 39.6% | 18.6%(+21.0)#15 | 10.0%(+29.6)#866 |
| 16. | Melvin | 39.5% | 18.6%(+20.9)#16 | 10.0%(+29.5)#871 |
| 17. | Hastings | 39.2% | 18.6%(+20.6)#17 | 10.0%(+29.2)#886 |
| 18. | Morenci | 38.7% | 18.6%(+20.1)#18 | 10.0%(+28.7)#926 |
| 19. | Martin | 38.5% | 18.6%(+20.0)#19 | 10.0%(+28.5)#936 |
| 20. | Hubbardston | 38.4% | 18.6%(+19.8)#20 | 10.0%(+28.4)#953 |
| 21. | Homer | 38.2% | 18.6%(+19.6)#21 | 10.0%(+28.2)#971 |
| 22. | Mendon | 37.8% | 18.6%(+19.3)#22 | 10.0%(+27.9)#998 |
| 23. | New Troy | 37.8% | 18.6%(+19.2)#23 | 10.0%(+27.8)#1,002 |
| 24. | Port Hope | 37.2% | 18.6%(+18.6)#24 | 10.0%(+27.2)#1,043 |
| 25. | Eagle | 37.1% | 18.6%(+18.5)#25 | 10.0%(+27.1)#1,054 |
| 26. | Wolf Lake | 37.0% | 18.6%(+18.5)#26 | 10.0%(+27.0)#1,061 |
| 27. | Howard City | 36.3% | 18.6%(+17.8)#27 | 10.0%(+26.4)#1,132 |
| 28. | Clifford | 36.2% | 18.6%(+17.6)#28 | 10.0%(+26.2)#1,145 |
| 29. | Waldron | 35.9% | 18.6%(+17.3)#29 | 10.0%(+25.9)#1,174 |
| 30. | Twin Lake | 35.4% | 18.6%(+16.8)#30 | 10.0%(+25.4)#1,252 |
| 31. | East Jordan | 35.0% | 18.6%(+16.4)#31 | 10.0%(+25.0)#1,289 |
| 32. | Cambria | 34.9% | 18.6%(+16.3)#32 | 10.0%(+24.9)#1,298 |
| 33. | Bay Port | 34.7% | 18.6%(+16.2)#33 | 10.0%(+24.8)#1,317 |
| 34. | Barnes Lake | 34.5% | 18.6%(+15.9)#34 | 10.0%(+24.5)#1,347 |
| 35. | Constantine | 34.3% | 18.6%(+15.7)#35 | 10.0%(+24.3)#1,381 |
| 36. | Kinde | 34.2% | 18.6%(+15.6)#36 | 10.0%(+24.2)#1,390 |
| 37. | Owendale | 33.9% | 18.6%(+15.3)#37 | 10.0%(+23.9)#1,432 |
| 38. | Litchfield | 33.8% | 18.6%(+15.2)#38 | 10.0%(+23.8)#1,448 |
| 39. | Menominee | 33.7% | 18.6%(+15.1)#39 | 10.0%(+23.7)#1,453 |
| 40. | Quincy | 33.6% | 18.6%(+15.0)#40 | 10.0%(+23.6)#1,465 |
| 41. | Palo | 33.6% | 18.6%(+15.0)#41 | 10.0%(+23.6)#1,469 |
| 42. | Amasa | 33.3% | 18.6%(+14.8)#42 | 10.0%(+23.3)#1,495 |
| 43. | Walkerville | 33.3% | 18.6%(+14.8)#43 | 10.0%(+23.3)#1,498 |
| 44. | Nashville | 33.2% | 18.6%(+14.7)#44 | 10.0%(+23.2)#1,530 |
| 45. | Pittsford | 33.2% | 18.6%(+14.6)#45 | 10.0%(+23.2)#1,539 |
| 46. | Manton | 32.9% | 18.6%(+14.3)#46 | 10.0%(+22.9)#1,567 |
| 47. | Weidman | 32.8% | 18.6%(+14.3)#47 | 10.0%(+22.8)#1,578 |
| 48. | Allegan | 32.2% | 18.6%(+13.6)#48 | 10.0%(+22.2)#1,662 |
| 49. | Wellston | 32.0% | 18.6%(+13.4)#49 | 10.0%(+22.0)#1,688 |
| 50. | Farwell | 31.8% | 18.6%(+13.2)#50 | 10.0%(+21.8)#1,732 |
| 51. | Ovid | 31.6% | 18.6%(+13.1)#51 | 10.0%(+21.7)#1,761 |
| 52. | Lyons | 31.6% | 18.6%(+13.1)#52 | 10.0%(+21.6)#1,763 |
| 53. | Vineyard Lake | 31.6% | 18.6%(+13.0)#53 | 10.0%(+21.6)#1,778 |
| 54. | Otsego | 31.6% | 18.6%(+13.0)#54 | 10.0%(+21.6)#1,779 |
| 55. | Newaygo | 31.5% | 18.6%(+12.9)#55 | 10.0%(+21.5)#1,790 |
| 56. | Oden | 31.4% | 18.6%(+12.9)#56 | 10.0%(+21.4)#1,801 |
| 57. | Hubbard Lake | 31.3% | 18.6%(+12.8)#57 | 10.0%(+21.4)#1,816 |
| 58. | South Rockwood | 31.3% | 18.6%(+12.7)#58 | 10.0%(+21.3)#1,824 |
| 59. | Stephenson | 31.1% | 18.6%(+12.6)#59 | 10.0%(+21.1)#1,858 |
| 60. | Romeo | 30.9% | 18.6%(+12.4)#60 | 10.0%(+20.9)#1,881 |
| 61. | Delton | 30.8% | 18.6%(+12.2)#61 | 10.0%(+20.8)#1,904 |
| 62. | Whitehall | 30.8% | 18.6%(+12.2)#62 | 10.0%(+20.8)#1,921 |
| 63. | Scottville | 30.7% | 18.6%(+12.2)#63 | 10.0%(+20.7)#1,928 |
| 64. | Auburn Hills | 30.6% | 18.6%(+12.0)#64 | 10.0%(+20.6)#1,962 |
| 65. | Luther | 30.6% | 18.6%(+12.0)#65 | 10.0%(+20.6)#1,968 |
| 66. | Tower | 30.4% | 18.6%(+11.8)#66 | 10.0%(+20.4)#1,998 |
| 67. | Middleville | 30.3% | 18.6%(+11.8)#67 | 10.0%(+20.4)#2,005 |
| 68. | Stanwood | 30.3% | 18.6%(+11.7)#68 | 10.0%(+20.3)#2,017 |
| 69. | Omer | 30.2% | 18.6%(+11.6)#69 | 10.0%(+20.2)#2,034 |
| 70. | Otter Lake | 29.9% | 18.6%(+11.4)#70 | 10.0%(+20.0)#2,092 |
| 71. | Falmouth | 29.7% | 18.6%(+11.1)#71 | 10.0%(+19.7)#2,130 |
| 72. | Hudson | 29.6% | 18.6%(+11.0)#72 | 10.0%(+19.6)#2,149 |
| 73. | Reading | 29.5% | 18.6%(+10.9)#73 | 10.0%(+19.5)#2,169 |
| 74. | Jennings | 29.4% | 18.6%(+10.8)#74 | 10.0%(+19.4)#2,185 |
| 75. | Bear Lake | 29.2% | 18.6%(+10.7)#75 | 10.0%(+19.3)#2,222 |
| 76. | Port Austin | 29.2% | 18.6%(+10.7)#76 | 10.0%(+19.2)#2,224 |
| 77. | Bancroft | 29.2% | 18.6%(+10.6)#77 | 10.0%(+19.2)#2,235 |
| 78. | Ubly | 29.1% | 18.6%(+10.6)#78 | 10.0%(+19.2)#2,249 |
| 79. | Elkton | 29.1% | 18.6%(+10.5)#79 | 10.0%(+19.1)#2,265 |
| 80. | Lawton | 29.0% | 18.6%(+10.4)#80 | 10.0%(+19.0)#2,288 |
| 81. | Vandalia | 29.0% | 18.6%(+10.4)#81 | 10.0%(+19.0)#2,295 |
| 82. | Edwardsburg | 28.9% | 18.6%(+10.4)#82 | 10.0%(+19.0)#2,298 |
| 83. | Loomis | 28.9% | 18.6%(+10.3)#83 | 10.0%(+18.9)#2,321 |
| 84. | St Joseph | 28.8% | 18.6%(+10.2)#84 | 10.0%(+18.8)#2,334 |
| 85. | Sheridan | 28.7% | 18.6%(+10.1)#85 | 10.0%(+18.7)#2,354 |
| 86. | Morley | 28.7% | 18.6%(+10.1)#86 | 10.0%(+18.7)#2,355 |
| 87. | Shelby | 28.7% | 18.6%(+10.1)#87 | 10.0%(+18.7)#2,356 |
| 88. | Gagetown | 28.6% | 18.6%(+10.0)#88 | 10.0%(+18.6)#2,387 |
| 89. | Daggett | 28.6% | 18.6%(+10.0)#89 | 10.0%(+18.6)#2,391 |
| 90. | Lake Gogebic | 28.6% | 18.6%(+10.0)#90 | 10.0%(+18.6)#2,396 |
| 91. | Free Soil | 28.6% | 18.6%(+10.0)#91 | 10.0%(+18.6)#2,399 |
| 92. | Burt | 28.5% | 18.6%(+9.93)#92 | 10.0%(+18.5)#2,422 |
| 93. | Dowling | 28.5% | 18.6%(+9.90)#93 | 10.0%(+18.5)#2,426 |
| 94. | Decatur | 28.4% | 18.6%(+9.79)#94 | 10.0%(+18.4)#2,451 |
| 95. | North Adams | 28.3% | 18.6%(+9.77)#95 | 10.0%(+18.3)#2,455 |
| 96. | Woodland | 28.3% | 18.6%(+9.76)#96 | 10.0%(+18.3)#2,461 |
| 97. | Buchanan | 28.3% | 18.6%(+9.72)#97 | 10.0%(+18.3)#2,470 |
| 98. | Coleman | 28.3% | 18.6%(+9.69)#98 | 10.0%(+18.3)#2,482 |
| 99. | Lake City | 28.3% | 18.6%(+9.69)#99 | 10.0%(+18.3)#2,484 |
| 100. | Concord | 28.1% | 18.6%(+9.52)#100 | 10.0%(+18.1)#2,537 |
Common Questions
What are the Top 10 Cities with the Highest Percentage of Population Employed in Manufacturing in Michigan?
Top 10 Cities with the Highest Percentage of Population Employed in Manufacturing in Michigan are:
#1
60.9%
#2
59.1%
#3
57.1%
#4
56.6%
#5
45.1%
#6
44.4%
#7
43.2%
#8
42.9%
#9
42.9%
#10
40.8%
What city has the Highest Percentage of Population Employed in Manufacturing in Michigan?
Boon has the Highest Percentage of Population Employed in Manufacturing in Michigan with 60.9%.
What is the Percentage of Population Employed in Manufacturing in the State of Michigan?
Percentage of Population Employed in Manufacturing in Michigan is 18.6%.
What is the Percentage of Population Employed in Manufacturing in the United States?
Percentage of Population Employed in Manufacturing in the United States is 10.0%.