Cities with the Highest Percentage of Population Employed in Manufacturing in South Carolina
RELATED REPORTS & OPTIONS
Manufacturing
South Carolina
Compare Cities
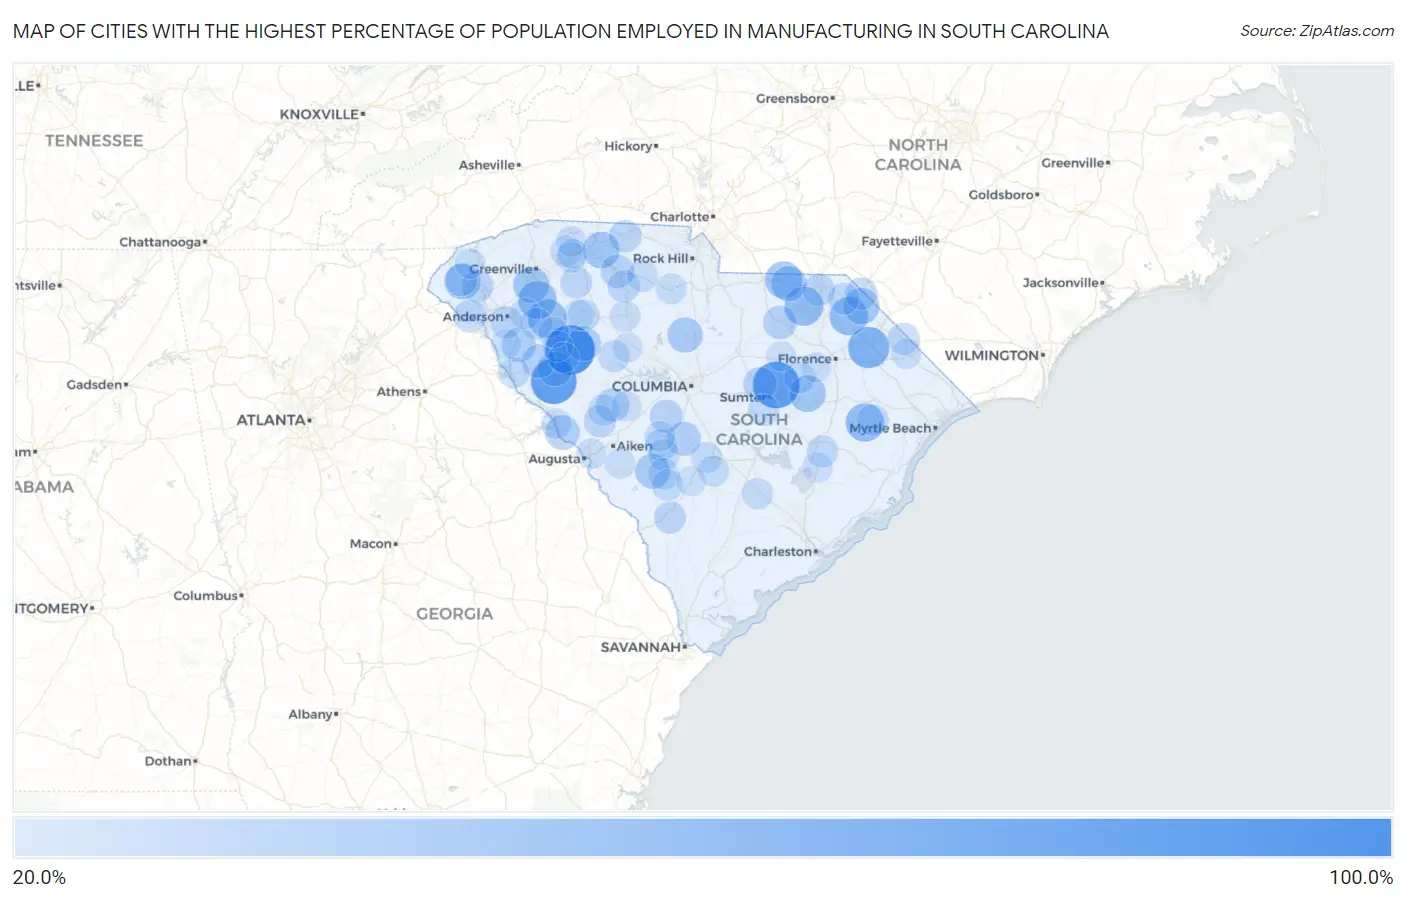
Map of Cities with the Highest Percentage of Population Employed in Manufacturing in South Carolina
0.0%
100.0%
Cities with the Highest Percentage of Population Employed in Manufacturing in South Carolina
| City | % Employed | vs State | vs National | |
| 1. | Coronaca | 100.0% | 13.4%(+86.6)#1 | 10.0%(+90.0)#55 |
| 2. | Oswego | 88.1% | 13.4%(+74.8)#2 | 10.0%(+78.1)#77 |
| 3. | Bradley | 84.4% | 13.4%(+71.0)#3 | 10.0%(+74.4)#85 |
| 4. | Sellers | 66.7% | 13.4%(+53.3)#4 | 10.0%(+56.7)#150 |
| 5. | Elliott | 58.3% | 13.4%(+44.9)#5 | 10.0%(+48.3)#223 |
| 6. | Helena | 57.4% | 13.4%(+44.0)#6 | 10.0%(+47.4)#232 |
| 7. | Patrick | 57.0% | 13.4%(+43.6)#7 | 10.0%(+47.0)#240 |
| 8. | Beech Island | 56.7% | 13.4%(+43.3)#8 | 10.0%(+46.7)#245 |
| 9. | Stuckey | 55.7% | 13.4%(+42.3)#9 | 10.0%(+45.7)#261 |
| 10. | Princeton | 55.6% | 13.4%(+42.2)#10 | 10.0%(+45.6)#263 |
| 11. | Blenheim | 55.2% | 13.4%(+41.8)#11 | 10.0%(+45.2)#273 |
| 12. | Ashwood | 53.3% | 13.4%(+40.0)#12 | 10.0%(+43.3)#312 |
| 13. | Ware Place | 53.1% | 13.4%(+39.7)#13 | 10.0%(+43.1)#321 |
| 14. | Mount Croghan | 50.0% | 13.4%(+36.6)#14 | 10.0%(+40.0)#372 |
| 15. | Clifton | 48.0% | 13.4%(+34.6)#15 | 10.0%(+38.0)#446 |
| 16. | Shiloh | 47.6% | 13.4%(+34.3)#16 | 10.0%(+37.6)#456 |
| 17. | West Union | 46.6% | 13.4%(+33.3)#17 | 10.0%(+36.6)#494 |
| 18. | South Union | 46.6% | 13.4%(+33.3)#18 | 10.0%(+36.6)#495 |
| 19. | Clio | 46.5% | 13.4%(+33.1)#19 | 10.0%(+36.5)#498 |
| 20. | Tradesville | 45.8% | 13.4%(+32.5)#20 | 10.0%(+35.8)#522 |
| 21. | Golden Grove | 45.7% | 13.4%(+32.4)#21 | 10.0%(+35.7)#531 |
| 22. | Ruby | 43.3% | 13.4%(+29.9)#22 | 10.0%(+33.3)#642 |
| 23. | Winnsboro | 42.5% | 13.4%(+29.1)#23 | 10.0%(+32.5)#680 |
| 24. | Elko | 41.7% | 13.4%(+28.3)#24 | 10.0%(+31.7)#722 |
| 25. | Promised Land | 40.8% | 13.4%(+27.4)#25 | 10.0%(+30.8)#776 |
| 26. | Clarks Hill | 40.0% | 13.4%(+26.6)#26 | 10.0%(+30.0)#840 |
| 27. | Cross Hill | 39.2% | 13.4%(+25.8)#27 | 10.0%(+29.2)#889 |
| 28. | Cateechee | 38.5% | 13.4%(+25.1)#28 | 10.0%(+28.5)#941 |
| 29. | North | 38.5% | 13.4%(+25.1)#29 | 10.0%(+28.5)#942 |
| 30. | Antreville | 38.2% | 13.4%(+24.8)#30 | 10.0%(+28.2)#974 |
| 31. | Abbeville | 36.6% | 13.4%(+23.3)#31 | 10.0%(+26.6)#1,099 |
| 32. | Mcbee | 36.2% | 13.4%(+22.9)#32 | 10.0%(+26.3)#1,141 |
| 33. | Dalzell | 35.7% | 13.4%(+22.4)#33 | 10.0%(+25.7)#1,193 |
| 34. | Jonesville | 35.7% | 13.4%(+22.3)#34 | 10.0%(+25.7)#1,204 |
| 35. | Ward | 35.5% | 13.4%(+22.1)#35 | 10.0%(+25.5)#1,234 |
| 36. | Pelion | 34.1% | 13.4%(+20.7)#36 | 10.0%(+24.1)#1,404 |
| 37. | St. Charles | 33.3% | 13.4%(+20.0)#37 | 10.0%(+23.3)#1,511 |
| 38. | Danwood | 32.8% | 13.4%(+19.4)#38 | 10.0%(+22.8)#1,582 |
| 39. | Wisacky | 32.8% | 13.4%(+19.4)#39 | 10.0%(+22.8)#1,584 |
| 40. | Fair Play | 32.7% | 13.4%(+19.4)#40 | 10.0%(+22.8)#1,588 |
| 41. | East Gaffney | 31.7% | 13.4%(+18.4)#41 | 10.0%(+21.7)#1,736 |
| 42. | Cheraw | 31.6% | 13.4%(+18.3)#42 | 10.0%(+21.7)#1,762 |
| 43. | Mccoll | 31.4% | 13.4%(+18.0)#43 | 10.0%(+21.4)#1,814 |
| 44. | Newry | 31.2% | 13.4%(+17.9)#44 | 10.0%(+21.3)#1,831 |
| 45. | Homeland Park | 31.1% | 13.4%(+17.8)#45 | 10.0%(+21.2)#1,853 |
| 46. | Union | 31.1% | 13.4%(+17.7)#46 | 10.0%(+21.1)#1,865 |
| 47. | Trenton | 31.0% | 13.4%(+17.6)#47 | 10.0%(+21.0)#1,877 |
| 48. | Little Rock | 30.7% | 13.4%(+17.4)#48 | 10.0%(+20.7)#1,925 |
| 49. | Walhalla | 30.7% | 13.4%(+17.4)#49 | 10.0%(+20.7)#1,934 |
| 50. | Sycamore | 30.4% | 13.4%(+17.1)#50 | 10.0%(+20.4)#1,996 |
| 51. | Unity | 30.1% | 13.4%(+16.8)#51 | 10.0%(+20.2)#2,045 |
| 52. | Woodruff | 30.0% | 13.4%(+16.6)#52 | 10.0%(+20.0)#2,087 |
| 53. | Lake View | 29.9% | 13.4%(+16.6)#53 | 10.0%(+19.9)#2,094 |
| 54. | Salley | 29.7% | 13.4%(+16.4)#54 | 10.0%(+19.7)#2,124 |
| 55. | Honea Path | 29.2% | 13.4%(+15.9)#55 | 10.0%(+19.2)#2,225 |
| 56. | Lane | 29.0% | 13.4%(+15.6)#56 | 10.0%(+19.0)#2,285 |
| 57. | Lynchburg | 28.9% | 13.4%(+15.6)#57 | 10.0%(+19.0)#2,300 |
| 58. | Silverstreet | 28.8% | 13.4%(+15.5)#58 | 10.0%(+18.8)#2,331 |
| 59. | Bennettsville | 28.7% | 13.4%(+15.3)#59 | 10.0%(+18.7)#2,371 |
| 60. | Calhoun Falls | 28.6% | 13.4%(+15.3)#60 | 10.0%(+18.7)#2,372 |
| 61. | Johnston | 28.5% | 13.4%(+15.2)#61 | 10.0%(+18.5)#2,417 |
| 62. | Watts Mills | 28.3% | 13.4%(+15.0)#62 | 10.0%(+18.3)#2,457 |
| 63. | Lyman | 28.3% | 13.4%(+14.9)#63 | 10.0%(+18.3)#2,474 |
| 64. | Privateer | 28.2% | 13.4%(+14.8)#64 | 10.0%(+18.2)#2,493 |
| 65. | Springfield | 28.1% | 13.4%(+14.8)#65 | 10.0%(+18.2)#2,517 |
| 66. | Hemingway | 27.9% | 13.4%(+14.6)#66 | 10.0%(+17.9)#2,571 |
| 67. | Blackville | 27.7% | 13.4%(+14.4)#67 | 10.0%(+17.7)#2,619 |
| 68. | Lockhart | 27.7% | 13.4%(+14.3)#68 | 10.0%(+17.7)#2,642 |
| 69. | Hilda | 27.5% | 13.4%(+14.2)#69 | 10.0%(+17.5)#2,681 |
| 70. | Camp Croft | 27.4% | 13.4%(+14.1)#70 | 10.0%(+17.5)#2,702 |
| 71. | Harleyville | 27.3% | 13.4%(+14.0)#71 | 10.0%(+17.3)#2,753 |
| 72. | Belton | 27.3% | 13.4%(+13.9)#72 | 10.0%(+17.3)#2,756 |
| 73. | Cash | 27.1% | 13.4%(+13.7)#73 | 10.0%(+17.1)#2,839 |
| 74. | Ben Avon | 27.0% | 13.4%(+13.6)#74 | 10.0%(+17.0)#2,864 |
| 75. | Edisto | 26.8% | 13.4%(+13.4)#75 | 10.0%(+16.8)#2,917 |
| 76. | Hamer | 26.8% | 13.4%(+13.4)#76 | 10.0%(+16.8)#2,919 |
| 77. | Grover | 26.8% | 13.4%(+13.4)#77 | 10.0%(+16.8)#2,920 |
| 78. | Rowesville | 26.4% | 13.4%(+13.0)#78 | 10.0%(+16.4)#3,033 |
| 79. | Chester | 26.2% | 13.4%(+12.8)#79 | 10.0%(+16.2)#3,088 |
| 80. | Laurens | 25.5% | 13.4%(+12.2)#80 | 10.0%(+15.5)#3,281 |
| 81. | Whitmire | 25.2% | 13.4%(+11.8)#81 | 10.0%(+15.2)#3,399 |
| 82. | Cokesbury | 25.2% | 13.4%(+11.8)#82 | 10.0%(+15.2)#3,410 |
| 83. | Startex | 24.9% | 13.4%(+11.5)#83 | 10.0%(+14.9)#3,536 |
| 84. | Perry | 24.8% | 13.4%(+11.4)#84 | 10.0%(+14.8)#3,566 |
| 85. | Ware Shoals | 24.7% | 13.4%(+11.4)#85 | 10.0%(+14.8)#3,576 |
| 86. | Clearwater | 24.6% | 13.4%(+11.3)#86 | 10.0%(+14.6)#3,625 |
| 87. | Modoc | 24.6% | 13.4%(+11.2)#87 | 10.0%(+14.6)#3,635 |
| 88. | Inman | 24.5% | 13.4%(+11.2)#88 | 10.0%(+14.5)#3,656 |
| 89. | Greenwood | 24.5% | 13.4%(+11.1)#89 | 10.0%(+14.5)#3,661 |
| 90. | Nichols | 24.3% | 13.4%(+10.9)#90 | 10.0%(+14.3)#3,733 |
| 91. | St Stephen | 24.3% | 13.4%(+10.9)#91 | 10.0%(+14.3)#3,740 |
| 92. | New Ellenton | 24.1% | 13.4%(+10.7)#92 | 10.0%(+14.1)#3,826 |
| 93. | Monetta | 23.9% | 13.4%(+10.5)#93 | 10.0%(+13.9)#3,899 |
| 94. | Timmonsville | 23.7% | 13.4%(+10.4)#94 | 10.0%(+13.7)#3,950 |
| 95. | Salem | 23.5% | 13.4%(+10.2)#95 | 10.0%(+13.5)#4,028 |
| 96. | Iva | 23.3% | 13.4%(+9.91)#96 | 10.0%(+13.3)#4,126 |
| 97. | Wellford | 23.1% | 13.4%(+9.71)#97 | 10.0%(+13.1)#4,195 |
| 98. | Newberry | 23.0% | 13.4%(+9.63)#98 | 10.0%(+13.0)#4,226 |
| 99. | Bamberg | 22.8% | 13.4%(+9.46)#99 | 10.0%(+12.8)#4,300 |
| 100. | Bishopville | 22.8% | 13.4%(+9.46)#100 | 10.0%(+12.8)#4,302 |
Common Questions
What are the Top 10 Cities with the Highest Percentage of Population Employed in Manufacturing in South Carolina?
Top 10 Cities with the Highest Percentage of Population Employed in Manufacturing in South Carolina are:
#1
100.0%
#2
88.1%
#3
84.4%
#4
66.7%
#5
57.0%
#6
55.7%
#7
55.6%
#8
55.2%
#9
53.1%
#10
50.0%
What city has the Highest Percentage of Population Employed in Manufacturing in South Carolina?
Coronaca has the Highest Percentage of Population Employed in Manufacturing in South Carolina with 100.0%.
What is the Percentage of Population Employed in Manufacturing in the State of South Carolina?
Percentage of Population Employed in Manufacturing in South Carolina is 13.4%.
What is the Percentage of Population Employed in Manufacturing in the United States?
Percentage of Population Employed in Manufacturing in the United States is 10.0%.