Cities with the Highest Percentage of Population Employed in Manufacturing in New York
RELATED REPORTS & OPTIONS
Manufacturing
New York
Compare Cities
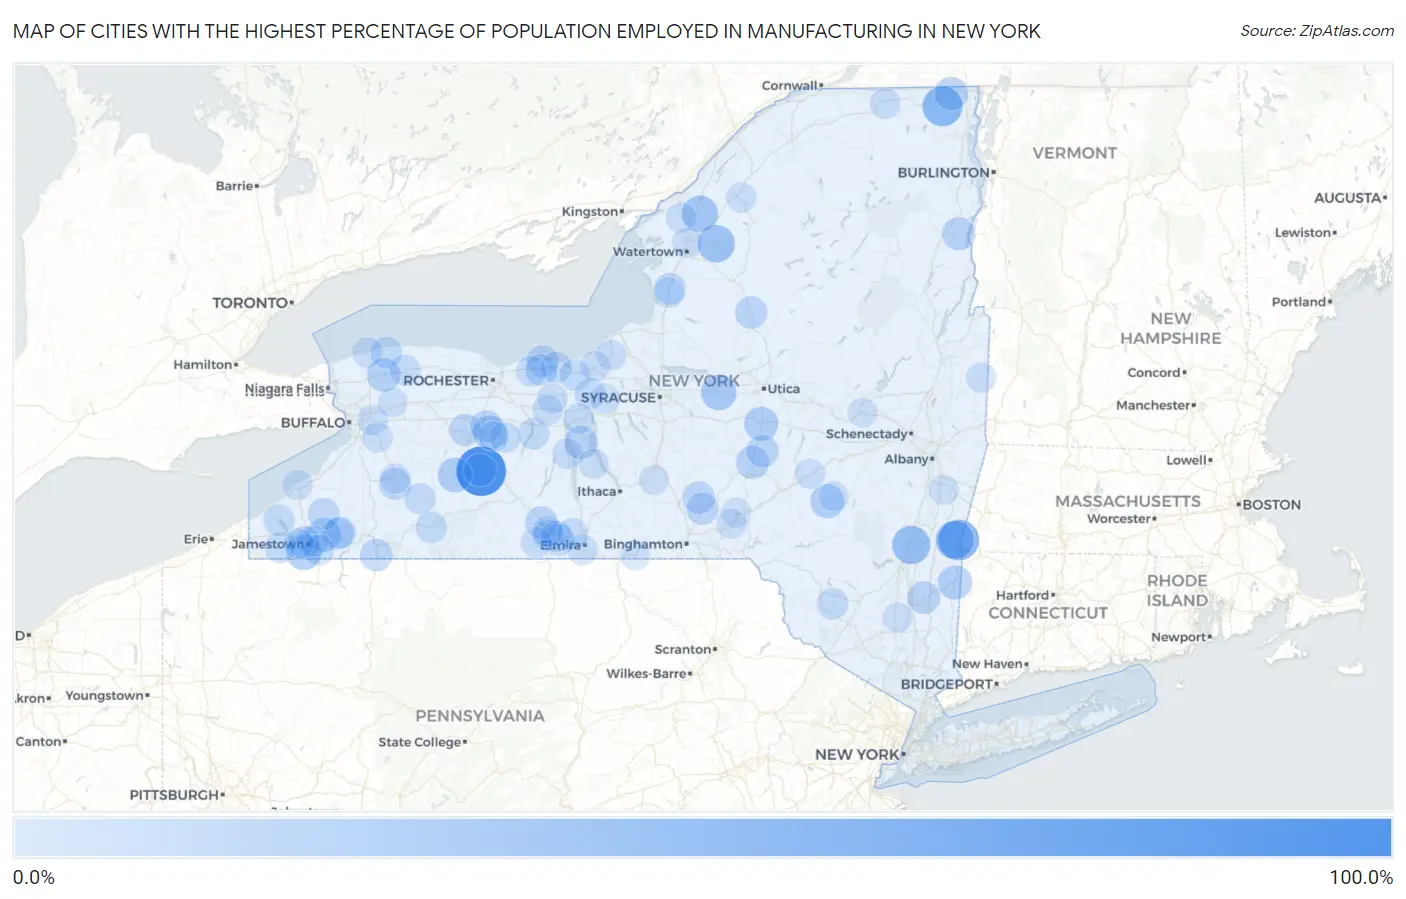
Map of Cities with the Highest Percentage of Population Employed in Manufacturing in New York
0.0%
100.0%
Cities with the Highest Percentage of Population Employed in Manufacturing in New York
| City | % Employed | vs State | vs National | |
| 1. | Cumminsville | 100.0% | 5.8%(+94.2)#1 | 10.0%(+90.0)#26 |
| 2. | Copake Falls | 62.1% | 5.8%(+56.3)#2 | 10.0%(+52.1)#183 |
| 3. | North Blenheim | 59.5% | 5.8%(+53.8)#3 | 10.0%(+49.5)#210 |
| 4. | Altona | 58.9% | 5.8%(+53.1)#4 | 10.0%(+48.9)#216 |
| 5. | Malden On Hudson | 51.2% | 5.8%(+45.5)#5 | 10.0%(+41.2)#354 |
| 6. | Taconic Shores | 50.8% | 5.8%(+45.0)#6 | 10.0%(+40.8)#362 |
| 7. | Herrings | 47.4% | 5.8%(+41.6)#7 | 10.0%(+37.4)#470 |
| 8. | Theresa | 43.3% | 5.8%(+37.5)#8 | 10.0%(+33.3)#641 |
| 9. | Oneida Castle | 40.2% | 5.8%(+34.4)#9 | 10.0%(+30.2)#820 |
| 10. | Busti | 38.3% | 5.8%(+32.5)#10 | 10.0%(+28.3)#958 |
| 11. | Dalton | 36.6% | 5.8%(+30.8)#11 | 10.0%(+26.6)#1,102 |
| 12. | East Frankfort | 35.5% | 5.8%(+29.7)#12 | 10.0%(+25.5)#1,225 |
| 13. | West Kill | 35.5% | 5.8%(+29.7)#13 | 10.0%(+25.5)#1,232 |
| 14. | Livonia Center | 34.7% | 5.8%(+28.9)#14 | 10.0%(+24.7)#1,332 |
| 15. | Hobart | 34.5% | 5.8%(+28.8)#15 | 10.0%(+24.5)#1,345 |
| 16. | Amenia | 34.3% | 5.8%(+28.5)#16 | 10.0%(+24.3)#1,374 |
| 17. | Bridgewater | 34.1% | 5.8%(+28.4)#17 | 10.0%(+24.2)#1,395 |
| 18. | Kennedy | 33.7% | 5.8%(+27.9)#18 | 10.0%(+23.7)#1,461 |
| 19. | Mooers | 32.1% | 5.8%(+26.3)#19 | 10.0%(+22.1)#1,679 |
| 20. | Gasport | 32.0% | 5.8%(+26.3)#20 | 10.0%(+22.1)#1,684 |
| 21. | New Berlin | 30.8% | 5.8%(+25.0)#21 | 10.0%(+20.8)#1,908 |
| 22. | Romulus | 30.7% | 5.8%(+24.9)#22 | 10.0%(+20.7)#1,932 |
| 23. | Mineville | 30.3% | 5.8%(+24.5)#23 | 10.0%(+20.3)#2,013 |
| 24. | Pleasant Valley | 28.6% | 5.8%(+22.9)#24 | 10.0%(+18.6)#2,373 |
| 25. | Limestone | 28.5% | 5.8%(+22.7)#25 | 10.0%(+18.5)#2,424 |
| 26. | Edmeston | 28.0% | 5.8%(+22.2)#26 | 10.0%(+18.0)#2,550 |
| 27. | Smithville Flats | 27.9% | 5.8%(+22.1)#27 | 10.0%(+17.9)#2,575 |
| 28. | Port Leyden | 27.8% | 5.8%(+22.0)#28 | 10.0%(+17.8)#2,603 |
| 29. | Campbell | 27.7% | 5.8%(+22.0)#29 | 10.0%(+17.8)#2,616 |
| 30. | Woodsville | 27.6% | 5.8%(+21.8)#30 | 10.0%(+17.6)#2,664 |
| 31. | Randolph | 26.9% | 5.8%(+21.2)#31 | 10.0%(+16.9)#2,871 |
| 32. | Piffard | 26.9% | 5.8%(+21.1)#32 | 10.0%(+16.9)#2,890 |
| 33. | Celoron | 26.4% | 5.8%(+20.6)#33 | 10.0%(+16.4)#3,031 |
| 34. | Greene | 26.3% | 5.8%(+20.5)#34 | 10.0%(+16.3)#3,051 |
| 35. | Wingdale | 26.1% | 5.8%(+20.3)#35 | 10.0%(+16.1)#3,106 |
| 36. | Pultneyville | 26.1% | 5.8%(+20.3)#36 | 10.0%(+16.1)#3,119 |
| 37. | South Lima | 26.0% | 5.8%(+20.3)#37 | 10.0%(+16.1)#3,126 |
| 38. | Delevan | 25.9% | 5.8%(+20.2)#38 | 10.0%(+16.0)#3,155 |
| 39. | Cherry Creek | 25.0% | 5.8%(+19.2)#39 | 10.0%(+15.0)#3,470 |
| 40. | Pierrepont Manor | 24.9% | 5.8%(+19.1)#40 | 10.0%(+14.9)#3,541 |
| 41. | South Corning | 24.8% | 5.8%(+19.1)#41 | 10.0%(+14.8)#3,550 |
| 42. | Williamson | 24.7% | 5.8%(+19.0)#42 | 10.0%(+14.7)#3,582 |
| 43. | East Randolph | 24.6% | 5.8%(+18.8)#43 | 10.0%(+14.6)#3,629 |
| 44. | South Fallsburg | 24.4% | 5.8%(+18.6)#44 | 10.0%(+14.4)#3,700 |
| 45. | Crystal Beach | 24.3% | 5.8%(+18.6)#45 | 10.0%(+14.3)#3,715 |
| 46. | Barker | 23.9% | 5.8%(+18.2)#46 | 10.0%(+13.9)#3,868 |
| 47. | Sodus | 23.8% | 5.8%(+18.0)#47 | 10.0%(+13.8)#3,926 |
| 48. | Mayville | 23.7% | 5.8%(+17.9)#48 | 10.0%(+13.7)#3,961 |
| 49. | Falconer | 23.7% | 5.8%(+17.9)#49 | 10.0%(+13.7)#3,967 |
| 50. | Gang Mills | 23.6% | 5.8%(+17.8)#50 | 10.0%(+13.6)#4,006 |
| 51. | Friendship | 23.4% | 5.8%(+17.6)#51 | 10.0%(+13.4)#4,080 |
| 52. | Rushford | 23.3% | 5.8%(+17.5)#52 | 10.0%(+13.3)#4,132 |
| 53. | North Rose | 22.9% | 5.8%(+17.2)#53 | 10.0%(+12.9)#4,250 |
| 54. | Panama | 22.9% | 5.8%(+17.1)#54 | 10.0%(+12.9)#4,277 |
| 55. | Corning | 22.7% | 5.8%(+16.9)#55 | 10.0%(+12.7)#4,351 |
| 56. | Big Flats | 22.6% | 5.8%(+16.9)#56 | 10.0%(+12.6)#4,371 |
| 57. | Savannah | 22.2% | 5.8%(+16.5)#57 | 10.0%(+12.2)#4,570 |
| 58. | Honeoye | 21.9% | 5.8%(+16.1)#58 | 10.0%(+11.9)#4,730 |
| 59. | Waterloo | 21.8% | 5.8%(+16.0)#59 | 10.0%(+11.8)#4,768 |
| 60. | Medina | 21.8% | 5.8%(+16.0)#60 | 10.0%(+11.8)#4,774 |
| 61. | Frewsburg | 21.3% | 5.8%(+15.6)#61 | 10.0%(+11.4)#5,007 |
| 62. | Burke | 20.8% | 5.8%(+15.0)#62 | 10.0%(+10.8)#5,295 |
| 63. | Addison | 20.7% | 5.8%(+15.0)#63 | 10.0%(+10.7)#5,320 |
| 64. | Dresden | 20.7% | 5.8%(+14.9)#64 | 10.0%(+10.7)#5,335 |
| 65. | Clifton Springs | 20.6% | 5.8%(+14.8)#65 | 10.0%(+10.6)#5,394 |
| 66. | Westford | 20.5% | 5.8%(+14.7)#66 | 10.0%(+10.5)#5,483 |
| 67. | Coopers Plains | 20.4% | 5.8%(+14.6)#67 | 10.0%(+10.4)#5,517 |
| 68. | Ontario | 20.4% | 5.8%(+14.6)#68 | 10.0%(+10.4)#5,542 |
| 69. | Red Creek | 20.1% | 5.8%(+14.4)#69 | 10.0%(+10.2)#5,654 |
| 70. | Schenevus | 20.1% | 5.8%(+14.3)#70 | 10.0%(+10.1)#5,683 |
| 71. | Copake | 20.0% | 5.8%(+14.2)#71 | 10.0%(+10.0)#5,744 |
| 72. | Southport | 19.9% | 5.8%(+14.2)#72 | 10.0%(+9.94)#5,795 |
| 73. | Mannsville | 19.9% | 5.8%(+14.1)#73 | 10.0%(+9.88)#5,829 |
| 74. | Hailesboro | 19.8% | 5.8%(+14.0)#74 | 10.0%(+9.79)#5,891 |
| 75. | La Fargeville | 19.7% | 5.8%(+13.9)#75 | 10.0%(+9.70)#5,927 |
| 76. | Lancaster | 19.6% | 5.8%(+13.8)#76 | 10.0%(+9.56)#6,015 |
| 77. | North Granville | 19.5% | 5.8%(+13.7)#77 | 10.0%(+9.48)#6,062 |
| 78. | Yorkshire | 19.5% | 5.8%(+13.7)#78 | 10.0%(+9.47)#6,071 |
| 79. | Hannibal | 19.4% | 5.8%(+13.6)#79 | 10.0%(+9.43)#6,105 |
| 80. | Dunkirk | 19.4% | 5.8%(+13.6)#80 | 10.0%(+9.42)#6,110 |
| 81. | Olcott | 19.4% | 5.8%(+13.6)#81 | 10.0%(+9.41)#6,115 |
| 82. | Newark | 19.3% | 5.8%(+13.6)#82 | 10.0%(+9.34)#6,171 |
| 83. | Hemlock | 19.2% | 5.8%(+13.4)#83 | 10.0%(+9.22)#6,273 |
| 84. | Billington Heights | 19.2% | 5.8%(+13.4)#84 | 10.0%(+9.20)#6,284 |
| 85. | Greenville Cdp Greene County | 19.2% | 5.8%(+13.4)#85 | 10.0%(+9.19)#6,290 |
| 86. | Pamelia Center | 19.0% | 5.8%(+13.3)#86 | 10.0%(+9.06)#6,392 |
| 87. | Interlaken | 19.0% | 5.8%(+13.3)#87 | 10.0%(+9.06)#6,395 |
| 88. | Salem | 19.0% | 5.8%(+13.3)#88 | 10.0%(+9.05)#6,411 |
| 89. | Plattekill | 18.9% | 5.8%(+13.1)#89 | 10.0%(+8.91)#6,485 |
| 90. | Bainbridge | 18.9% | 5.8%(+13.1)#90 | 10.0%(+8.88)#6,501 |
| 91. | Niverville | 18.8% | 5.8%(+13.0)#91 | 10.0%(+8.82)#6,549 |
| 92. | Port Byron | 18.7% | 5.8%(+13.0)#92 | 10.0%(+8.73)#6,613 |
| 93. | Virgil | 18.7% | 5.8%(+12.9)#93 | 10.0%(+8.71)#6,621 |
| 94. | Conesus | 18.6% | 5.8%(+12.9)#94 | 10.0%(+8.65)#6,663 |
| 95. | Lakewood | 18.5% | 5.8%(+12.7)#95 | 10.0%(+8.53)#6,743 |
| 96. | Nichols | 18.5% | 5.8%(+12.7)#96 | 10.0%(+8.49)#6,777 |
| 97. | Stamford | 18.4% | 5.8%(+12.7)#97 | 10.0%(+8.46)#6,799 |
| 98. | Akron | 18.4% | 5.8%(+12.6)#98 | 10.0%(+8.40)#6,837 |
| 99. | Fultonville | 18.4% | 5.8%(+12.6)#99 | 10.0%(+8.40)#6,840 |
| 100. | Afton | 18.3% | 5.8%(+12.5)#100 | 10.0%(+8.30)#6,891 |
Common Questions
What are the Top 10 Cities with the Highest Percentage of Population Employed in Manufacturing in New York?
Top 10 Cities with the Highest Percentage of Population Employed in Manufacturing in New York are:
#1
100.0%
#2
62.1%
#3
58.9%
#4
51.2%
#5
50.8%
#6
47.4%
#7
43.3%
#8
40.2%
#9
38.3%
#10
36.6%
What city has the Highest Percentage of Population Employed in Manufacturing in New York?
Cumminsville has the Highest Percentage of Population Employed in Manufacturing in New York with 100.0%.
What is the Percentage of Population Employed in Manufacturing in the State of New York?
Percentage of Population Employed in Manufacturing in New York is 5.8%.
What is the Percentage of Population Employed in Manufacturing in the United States?
Percentage of Population Employed in Manufacturing in the United States is 10.0%.