Cities with the Highest Percentage of Population Employed in Manufacturing in Vermont
RELATED REPORTS & OPTIONS
Manufacturing
Vermont
Compare Cities
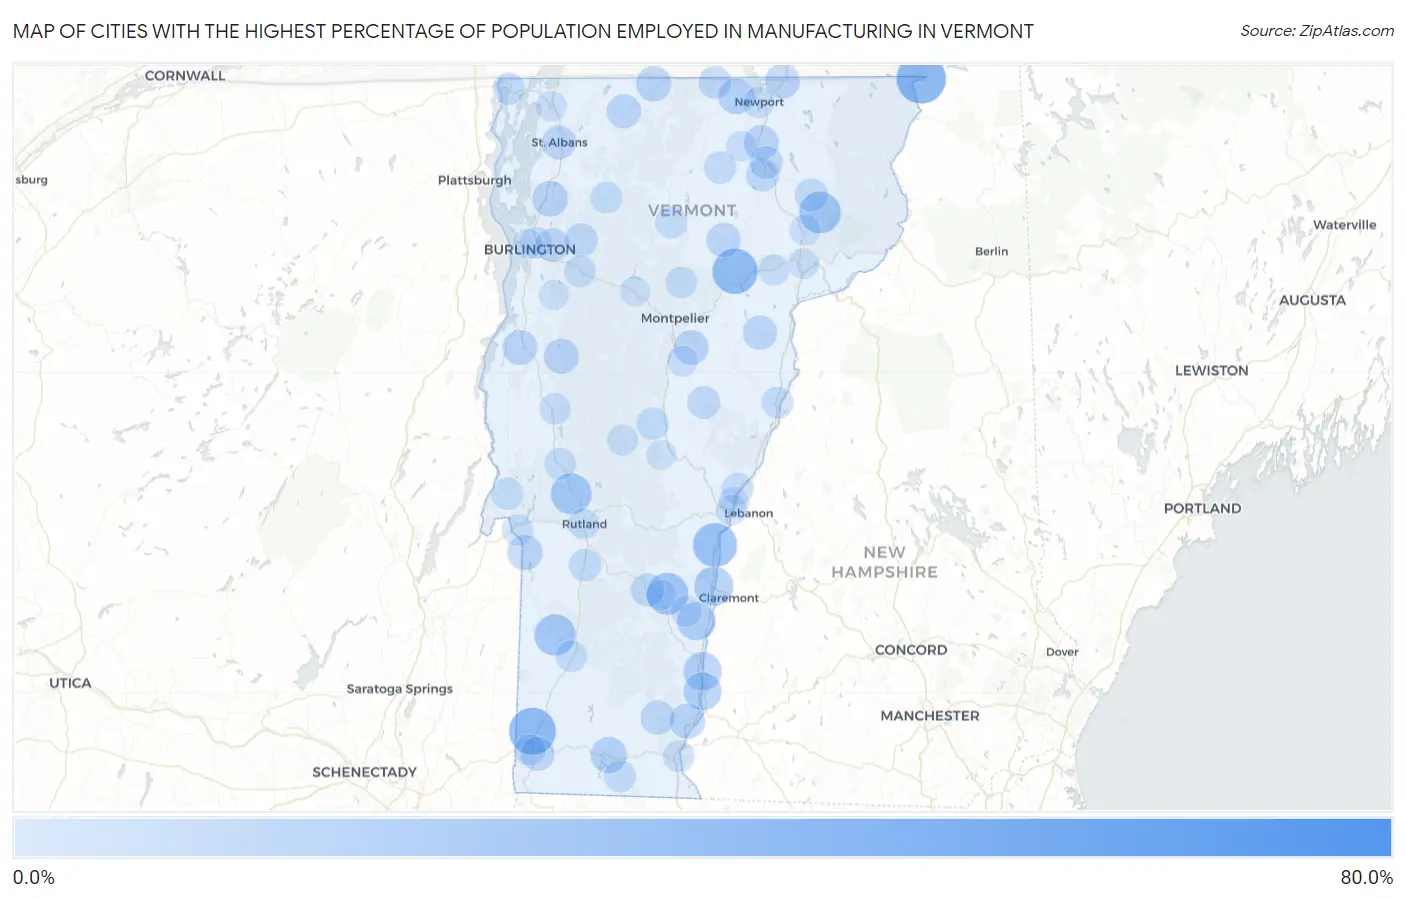
Map of Cities with the Highest Percentage of Population Employed in Manufacturing in Vermont
0.0%
80.0%
Cities with the Highest Percentage of Population Employed in Manufacturing in Vermont
| City | % Employed | vs State | vs National | |
| 1. | Lyndon | 73.5% | 10.1%(+63.3)#1 | 10.0%(+63.5)#115 |
| 2. | Beecher Falls | 43.6% | 10.1%(+33.4)#2 | 10.0%(+33.6)#626 |
| 3. | South Shaftsbury | 38.8% | 10.1%(+28.6)#3 | 10.0%(+28.8)#915 |
| 4. | Waterbury Center | 36.9% | 10.1%(+26.8)#4 | 10.0%(+27.0)#1,065 |
| 5. | Cabot | 35.8% | 10.1%(+25.6)#5 | 10.0%(+25.8)#1,189 |
| 6. | Hartland | 33.3% | 10.1%(+23.2)#6 | 10.0%(+23.3)#1,488 |
| 7. | Sheffield | 33.3% | 10.1%(+23.2)#7 | 10.0%(+23.3)#1,499 |
| 8. | Underhill Flats | 29.8% | 10.1%(+19.6)#8 | 10.0%(+19.8)#2,116 |
| 9. | Cavendish | 29.3% | 10.1%(+19.1)#9 | 10.0%(+19.3)#2,214 |
| 10. | East Burke | 28.9% | 10.1%(+18.8)#10 | 10.0%(+18.9)#2,305 |
| 11. | Dorset | 28.1% | 10.1%(+17.9)#11 | 10.0%(+18.1)#2,542 |
| 12. | East Dorset | 27.8% | 10.1%(+17.7)#12 | 10.0%(+17.8)#2,595 |
| 13. | Pittsford | 27.3% | 10.1%(+17.1)#13 | 10.0%(+17.3)#2,764 |
| 14. | Highgate Center | 26.3% | 10.1%(+16.1)#14 | 10.0%(+16.3)#3,057 |
| 15. | Ascutney | 24.3% | 10.1%(+14.2)#15 | 10.0%(+14.3)#3,726 |
| 16. | North Pownal | 23.7% | 10.1%(+13.6)#16 | 10.0%(+13.8)#3,945 |
| 17. | Bellows Falls | 22.6% | 10.1%(+12.5)#17 | 10.0%(+12.6)#4,372 |
| 18. | Springfield | 22.3% | 10.1%(+12.1)#18 | 10.0%(+12.3)#4,550 |
| 19. | Westminster | 21.9% | 10.1%(+11.8)#19 | 10.0%(+11.9)#4,708 |
| 20. | New Haven | 19.1% | 10.1%(+8.94)#20 | 10.0%(+9.09)#6,369 |
| 21. | Wilmington | 18.8% | 10.1%(+8.70)#21 | 10.0%(+8.85)#6,529 |
| 22. | South Lincoln | 18.7% | 10.1%(+8.55)#22 | 10.0%(+8.70)#6,631 |
| 23. | Newport Center | 18.5% | 10.1%(+8.33)#23 | 10.0%(+8.49)#6,780 |
| 24. | Pownal | 18.3% | 10.1%(+8.16)#24 | 10.0%(+8.31)#6,888 |
| 25. | Milton | 18.1% | 10.1%(+7.97)#25 | 10.0%(+8.13)#7,022 |
| 26. | Putney | 17.3% | 10.1%(+7.18)#26 | 10.0%(+7.33)#7,578 |
| 27. | Richford | 17.3% | 10.1%(+7.16)#27 | 10.0%(+7.31)#7,601 |
| 28. | Poultney | 17.2% | 10.1%(+7.02)#28 | 10.0%(+7.18)#7,698 |
| 29. | Bristol | 17.1% | 10.1%(+7.00)#29 | 10.0%(+7.15)#7,713 |
| 30. | Algiers | 17.0% | 10.1%(+6.88)#30 | 10.0%(+7.03)#7,798 |
| 31. | South Barre | 16.6% | 10.1%(+6.44)#31 | 10.0%(+6.59)#8,140 |
| 32. | Orleans | 16.6% | 10.1%(+6.42)#32 | 10.0%(+6.57)#8,154 |
| 33. | Derby Line | 16.5% | 10.1%(+6.35)#33 | 10.0%(+6.50)#8,203 |
| 34. | Vergennes | 16.3% | 10.1%(+6.11)#34 | 10.0%(+6.26)#8,397 |
| 35. | Hartford | 16.2% | 10.1%(+6.03)#35 | 10.0%(+6.18)#8,466 |
| 36. | Danby | 16.2% | 10.1%(+6.02)#36 | 10.0%(+6.17)#8,473 |
| 37. | Newfane | 15.8% | 10.1%(+5.64)#37 | 10.0%(+5.80)#8,806 |
| 38. | Hardwick | 15.6% | 10.1%(+5.46)#38 | 10.0%(+5.61)#8,988 |
| 39. | Enosburg Falls | 15.6% | 10.1%(+5.42)#39 | 10.0%(+5.58)#9,031 |
| 40. | Groton | 15.5% | 10.1%(+5.39)#40 | 10.0%(+5.55)#9,060 |
| 41. | Lincoln | 15.4% | 10.1%(+5.30)#41 | 10.0%(+5.46)#9,140 |
| 42. | St Albans | 14.9% | 10.1%(+4.74)#42 | 10.0%(+4.89)#9,662 |
| 43. | Bennington | 14.8% | 10.1%(+4.63)#43 | 10.0%(+4.78)#9,774 |
| 44. | West Pawlet | 14.5% | 10.1%(+4.31)#44 | 10.0%(+4.47)#10,085 |
| 45. | Essex Junction | 14.3% | 10.1%(+4.18)#45 | 10.0%(+4.34)#10,214 |
| 46. | Glover | 13.8% | 10.1%(+3.70)#46 | 10.0%(+3.86)#10,675 |
| 47. | Ludlow | 13.8% | 10.1%(+3.69)#47 | 10.0%(+3.85)#10,683 |
| 48. | Killington | 13.5% | 10.1%(+3.38)#48 | 10.0%(+3.53)#11,039 |
| 49. | Jericho | 13.5% | 10.1%(+3.34)#49 | 10.0%(+3.49)#11,084 |
| 50. | Barton | 13.4% | 10.1%(+3.24)#50 | 10.0%(+3.40)#11,189 |
| 51. | Lunenburg | 13.4% | 10.1%(+3.24)#51 | 10.0%(+3.39)#11,196 |
| 52. | West Burke | 13.2% | 10.1%(+3.09)#52 | 10.0%(+3.24)#11,359 |
| 53. | North Troy | 13.1% | 10.1%(+2.91)#53 | 10.0%(+3.07)#11,549 |
| 54. | Westford | 12.9% | 10.1%(+2.76)#54 | 10.0%(+2.91)#11,709 |
| 55. | Sutton | 12.9% | 10.1%(+2.76)#55 | 10.0%(+2.91)#11,712 |
| 56. | Chelsea | 12.8% | 10.1%(+2.69)#56 | 10.0%(+2.84)#11,784 |
| 57. | Wallingford | 12.5% | 10.1%(+2.32)#57 | 10.0%(+2.48)#12,195 |
| 58. | Albany | 12.2% | 10.1%(+2.10)#58 | 10.0%(+2.25)#12,421 |
| 59. | Randolph | 12.2% | 10.1%(+2.06)#59 | 10.0%(+2.22)#12,465 |
| 60. | Jacksonville | 11.8% | 10.1%(+1.68)#60 | 10.0%(+1.84)#12,932 |
| 61. | Proctor | 11.7% | 10.1%(+1.56)#61 | 10.0%(+1.72)#13,084 |
| 62. | Alburgh | 11.5% | 10.1%(+1.32)#62 | 10.0%(+1.48)#13,369 |
| 63. | Stamford | 11.4% | 10.1%(+1.30)#63 | 10.0%(+1.45)#13,399 |
| 64. | Benson | 11.4% | 10.1%(+1.22)#64 | 10.0%(+1.37)#13,488 |
| 65. | Morrisville | 11.3% | 10.1%(+1.19)#65 | 10.0%(+1.35)#13,512 |
| 66. | Bradford | 11.3% | 10.1%(+1.18)#66 | 10.0%(+1.34)#13,524 |
| 67. | Norwich | 11.3% | 10.1%(+1.14)#67 | 10.0%(+1.30)#13,581 |
| 68. | Cambridge | 11.1% | 10.1%(+0.966)#68 | 10.0%(+1.12)#13,802 |
| 69. | Brandon | 11.0% | 10.1%(+0.859)#69 | 10.0%(+1.01)#13,946 |
| 70. | Richmond | 10.8% | 10.1%(+0.677)#70 | 10.0%(+0.832)#14,195 |
| 71. | Worcester | 10.8% | 10.1%(+0.665)#71 | 10.0%(+0.820)#14,221 |
| 72. | Manchester Center | 10.7% | 10.1%(+0.508)#72 | 10.0%(+0.663)#14,411 |
| 73. | Winooski | 10.5% | 10.1%(+0.386)#73 | 10.0%(+0.540)#14,544 |
| 74. | Fair Haven | 10.5% | 10.1%(+0.381)#74 | 10.0%(+0.535)#14,549 |
| 75. | Newport | 10.3% | 10.1%(+0.175)#75 | 10.0%(+0.330)#14,799 |
| 76. | Chittenden | 10.3% | 10.1%(+0.164)#76 | 10.0%(+0.318)#14,816 |
| 77. | Brattleboro | 10.3% | 10.1%(+0.134)#77 | 10.0%(+0.289)#14,842 |
| 78. | East Middlebury | 10.1% | 10.1%(-0.006)#78 | 10.0%(+0.149)#15,018 |
| 79. | North Springfield | 9.8% | 10.1%(-0.330)#79 | 10.0%(-0.175)#15,465 |
| 80. | Danville | 9.8% | 10.1%(-0.380)#80 | 10.0%(-0.225)#15,533 |
| 81. | Rochester | 9.7% | 10.1%(-0.437)#81 | 10.0%(-0.282)#15,619 |
| 82. | Old Bennington | 9.6% | 10.1%(-0.507)#82 | 10.0%(-0.352)#15,717 |
| 83. | Rutland | 9.6% | 10.1%(-0.576)#83 | 10.0%(-0.421)#15,801 |
| 84. | Lyndonville | 9.3% | 10.1%(-0.833)#84 | 10.0%(-0.678)#16,134 |
| 85. | Williamstown | 9.2% | 10.1%(-0.905)#85 | 10.0%(-0.750)#16,235 |
| 86. | White River Junction | 9.2% | 10.1%(-0.955)#86 | 10.0%(-0.801)#16,294 |
| 87. | Swanton | 9.1% | 10.1%(-1.08)#87 | 10.0%(-0.926)#16,484 |
| 88. | Bakersfield | 9.1% | 10.1%(-1.09)#88 | 10.0%(-0.939)#16,505 |
| 89. | Harmonyville | 8.9% | 10.1%(-1.23)#89 | 10.0%(-1.07)#16,656 |
| 90. | Irasburg | 8.7% | 10.1%(-1.40)#90 | 10.0%(-1.24)#16,896 |
| 91. | St Johnsbury | 8.7% | 10.1%(-1.46)#91 | 10.0%(-1.31)#17,024 |
| 92. | Pawlet | 8.4% | 10.1%(-1.74)#92 | 10.0%(-1.59)#17,400 |
| 93. | Wolcott | 8.3% | 10.1%(-1.81)#93 | 10.0%(-1.66)#17,515 |
| 94. | Proctorsville | 8.3% | 10.1%(-1.89)#94 | 10.0%(-1.74)#17,621 |
| 95. | Gilman | 8.1% | 10.1%(-2.01)#95 | 10.0%(-1.85)#17,794 |
| 96. | Wilder | 8.1% | 10.1%(-2.03)#96 | 10.0%(-1.87)#17,829 |
| 97. | Hinesburg | 8.1% | 10.1%(-2.06)#97 | 10.0%(-1.91)#17,878 |
| 98. | Burlington | 8.1% | 10.1%(-2.08)#98 | 10.0%(-1.92)#17,890 |
| 99. | Bethel | 8.0% | 10.1%(-2.16)#99 | 10.0%(-2.00)#18,006 |
| 100. | Waterbury | 7.9% | 10.1%(-2.25)#100 | 10.0%(-2.09)#18,131 |
1
2Common Questions
What are the Top 10 Cities with the Highest Percentage of Population Employed in Manufacturing in Vermont?
Top 10 Cities with the Highest Percentage of Population Employed in Manufacturing in Vermont are:
#1
43.6%
#2
38.8%
#3
35.8%
#4
33.3%
#5
29.3%
#6
28.9%
#7
28.1%
#8
27.3%
#9
24.3%
#10
22.6%
What city has the Highest Percentage of Population Employed in Manufacturing in Vermont?
Beecher Falls has the Highest Percentage of Population Employed in Manufacturing in Vermont with 43.6%.
What is the Percentage of Population Employed in Manufacturing in the State of Vermont?
Percentage of Population Employed in Manufacturing in Vermont is 10.1%.
What is the Percentage of Population Employed in Manufacturing in the United States?
Percentage of Population Employed in Manufacturing in the United States is 10.0%.