Cities with the Highest Percentage of Population Employed in Manufacturing in Indiana
RELATED REPORTS & OPTIONS
Manufacturing
Indiana
Compare Cities
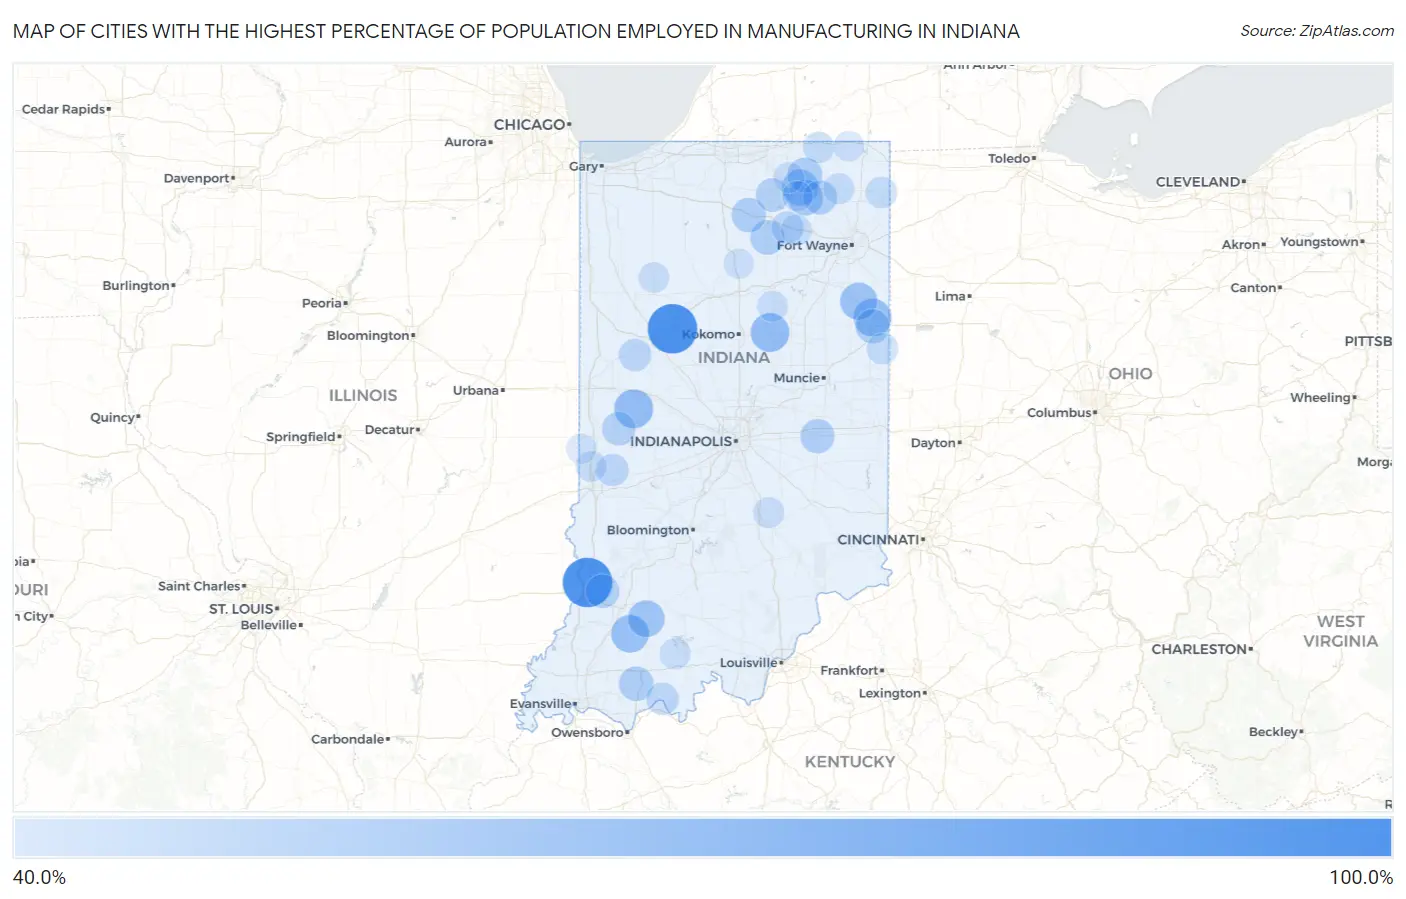
Map of Cities with the Highest Percentage of Population Employed in Manufacturing in Indiana
0.0%
100.0%
Cities with the Highest Percentage of Population Employed in Manufacturing in Indiana
| City | % Employed | vs State | vs National | |
| 1. | Boggstown | 100.0% | 18.6%(+81.4)#1 | 10.0%(+90.0)#2 |
| 2. | Forest | 100.0% | 18.6%(+81.4)#2 | 10.0%(+90.0)#5 |
| 3. | Cates | 100.0% | 18.6%(+81.4)#3 | 10.0%(+90.0)#10 |
| 4. | Urbana | 100.0% | 18.6%(+81.4)#4 | 10.0%(+90.0)#12 |
| 5. | Bear Lake | 100.0% | 18.6%(+81.4)#5 | 10.0%(+90.0)#13 |
| 6. | Heltonville | 100.0% | 18.6%(+81.4)#6 | 10.0%(+90.0)#16 |
| 7. | Boxley | 100.0% | 18.6%(+81.4)#7 | 10.0%(+90.0)#20 |
| 8. | Burrows | 100.0% | 18.6%(+81.4)#8 | 10.0%(+90.0)#21 |
| 9. | Cortland | 100.0% | 18.6%(+81.4)#9 | 10.0%(+90.0)#22 |
| 10. | Colburn | 100.0% | 18.6%(+81.4)#10 | 10.0%(+90.0)#34 |
| 11. | Tunnelton | 100.0% | 18.6%(+81.4)#11 | 10.0%(+90.0)#37 |
| 12. | Vistula | 100.0% | 18.6%(+81.4)#12 | 10.0%(+90.0)#47 |
| 13. | Spartanburg | 100.0% | 18.6%(+81.4)#13 | 10.0%(+90.0)#48 |
| 14. | Emison | 100.0% | 18.6%(+81.4)#14 | 10.0%(+90.0)#53 |
| 15. | Helmer | 100.0% | 18.6%(+81.4)#15 | 10.0%(+90.0)#54 |
| 16. | Linnsburg | 100.0% | 18.6%(+81.4)#16 | 10.0%(+90.0)#59 |
| 17. | Saline | 100.0% | 18.6%(+81.4)#17 | 10.0%(+90.0)#64 |
| 18. | Elrod | 100.0% | 18.6%(+81.4)#18 | 10.0%(+90.0)#65 |
| 19. | Blooming Grove | 88.9% | 18.6%(+70.3)#19 | 10.0%(+78.9)#75 |
| 20. | Ireland | 85.7% | 18.6%(+67.1)#20 | 10.0%(+75.7)#80 |
| 21. | Linn Grove | 84.4% | 18.6%(+65.8)#21 | 10.0%(+74.5)#84 |
| 22. | Wolflake | 80.6% | 18.6%(+62.0)#22 | 10.0%(+70.7)#92 |
| 23. | Wildwood | 79.4% | 18.6%(+60.8)#23 | 10.0%(+69.4)#96 |
| 24. | Wall Lake | 79.0% | 18.6%(+60.4)#24 | 10.0%(+69.0)#98 |
| 25. | Sardinia | 78.2% | 18.6%(+59.6)#25 | 10.0%(+68.2)#101 |
| 26. | Holiday Woods | 74.1% | 18.6%(+55.5)#26 | 10.0%(+64.1)#112 |
| 27. | Goldsmith | 71.4% | 18.6%(+52.8)#27 | 10.0%(+61.4)#123 |
| 28. | Alamo | 69.6% | 18.6%(+51.0)#28 | 10.0%(+59.6)#135 |
| 29. | Sims | 69.0% | 18.6%(+50.4)#29 | 10.0%(+59.0)#139 |
| 30. | Pulaski | 68.8% | 18.6%(+50.1)#30 | 10.0%(+58.8)#141 |
| 31. | Lake Cicott | 67.6% | 18.6%(+49.0)#31 | 10.0%(+57.7)#144 |
| 32. | Center | 67.4% | 18.6%(+48.8)#32 | 10.0%(+57.4)#146 |
| 33. | Cassville | 67.3% | 18.6%(+48.7)#33 | 10.0%(+57.3)#147 |
| 34. | Geneva | 66.9% | 18.6%(+48.3)#34 | 10.0%(+56.9)#148 |
| 35. | Schaefer Lake | 66.7% | 18.6%(+48.1)#35 | 10.0%(+56.7)#149 |
| 36. | Otwell | 66.1% | 18.6%(+47.5)#36 | 10.0%(+56.2)#153 |
| 37. | Vera Cruz | 64.7% | 18.6%(+46.1)#37 | 10.0%(+54.7)#159 |
| 38. | Alfordsville | 63.6% | 18.6%(+45.0)#38 | 10.0%(+53.6)#170 |
| 39. | Leopold | 63.6% | 18.6%(+45.0)#39 | 10.0%(+53.6)#171 |
| 40. | Graysville | 63.2% | 18.6%(+44.5)#40 | 10.0%(+53.2)#174 |
| 41. | Tyner | 62.7% | 18.6%(+44.1)#41 | 10.0%(+52.7)#176 |
| 42. | Ligonier | 62.3% | 18.6%(+43.7)#42 | 10.0%(+52.3)#182 |
| 43. | Kimmell | 61.4% | 18.6%(+42.7)#43 | 10.0%(+51.4)#189 |
| 44. | Burnett | 61.3% | 18.6%(+42.7)#44 | 10.0%(+51.3)#190 |
| 45. | Bringhurst | 60.5% | 18.6%(+41.9)#45 | 10.0%(+50.5)#199 |
| 46. | Green Hill | 59.7% | 18.6%(+41.1)#46 | 10.0%(+49.7)#208 |
| 47. | Coal | 59.1% | 18.6%(+40.5)#47 | 10.0%(+49.1)#214 |
| 48. | Topeka | 58.4% | 18.6%(+39.8)#48 | 10.0%(+48.4)#218 |
| 49. | Morris | 58.4% | 18.6%(+39.8)#49 | 10.0%(+48.4)#219 |
| 50. | Jefferson | 58.2% | 18.6%(+39.6)#50 | 10.0%(+48.2)#225 |
| 51. | Claypool | 57.6% | 18.6%(+39.0)#51 | 10.0%(+47.6)#228 |
| 52. | Etna Green | 57.6% | 18.6%(+39.0)#52 | 10.0%(+47.6)#229 |
| 53. | Gentryville | 57.4% | 18.6%(+38.8)#53 | 10.0%(+47.5)#231 |
| 54. | Grantsburg | 57.1% | 18.6%(+38.5)#54 | 10.0%(+47.2)#234 |
| 55. | Dunreith | 56.8% | 18.6%(+38.2)#55 | 10.0%(+46.8)#242 |
| 56. | Bryant | 56.5% | 18.6%(+37.9)#56 | 10.0%(+46.5)#249 |
| 57. | Bippus | 56.4% | 18.6%(+37.7)#57 | 10.0%(+46.4)#252 |
| 58. | Albion | 56.3% | 18.6%(+37.6)#58 | 10.0%(+46.3)#255 |
| 59. | Eugene | 55.8% | 18.6%(+37.2)#59 | 10.0%(+45.8)#259 |
| 60. | Ragsdale | 55.6% | 18.6%(+36.9)#60 | 10.0%(+45.6)#265 |
| 61. | Elizaville | 55.6% | 18.6%(+36.9)#61 | 10.0%(+45.6)#266 |
| 62. | Ontario | 55.2% | 18.6%(+36.6)#62 | 10.0%(+45.2)#271 |
| 63. | South Center | 55.1% | 18.6%(+36.5)#63 | 10.0%(+45.1)#274 |
| 64. | Milford | 55.1% | 18.6%(+36.5)#64 | 10.0%(+45.1)#276 |
| 65. | Marshall | 54.9% | 18.6%(+36.3)#65 | 10.0%(+44.9)#280 |
| 66. | Bridgeton | 54.3% | 18.6%(+35.7)#66 | 10.0%(+44.3)#291 |
| 67. | Cross Plains | 54.1% | 18.6%(+35.4)#67 | 10.0%(+44.1)#296 |
| 68. | Jimmerson Lake | 53.8% | 18.6%(+35.2)#68 | 10.0%(+43.9)#299 |
| 69. | Coesse | 53.6% | 18.6%(+35.0)#69 | 10.0%(+43.6)#309 |
| 70. | Peppertown | 53.3% | 18.6%(+34.7)#70 | 10.0%(+43.3)#314 |
| 71. | Laud | 52.9% | 18.6%(+34.3)#71 | 10.0%(+43.0)#322 |
| 72. | Enchanted Hills | 52.5% | 18.6%(+33.9)#72 | 10.0%(+42.5)#329 |
| 73. | Leiters Ford | 52.1% | 18.6%(+33.5)#73 | 10.0%(+42.1)#337 |
| 74. | West Point | 52.1% | 18.6%(+33.5)#74 | 10.0%(+42.1)#338 |
| 75. | Fontanet | 51.9% | 18.6%(+33.3)#75 | 10.0%(+42.0)#342 |
| 76. | Troy | 51.8% | 18.6%(+33.1)#76 | 10.0%(+41.8)#345 |
| 77. | Cloverland | 51.6% | 18.6%(+33.0)#77 | 10.0%(+41.6)#347 |
| 78. | Pierceton | 51.3% | 18.6%(+32.7)#78 | 10.0%(+41.3)#352 |
| 79. | Liberty Mills | 49.6% | 18.6%(+31.0)#79 | 10.0%(+39.6)#411 |
| 80. | Butler | 49.4% | 18.6%(+30.8)#80 | 10.0%(+39.4)#416 |
| 81. | Howe | 49.0% | 18.6%(+30.4)#81 | 10.0%(+39.0)#422 |
| 82. | Salamonia | 48.9% | 18.6%(+30.3)#82 | 10.0%(+38.9)#423 |
| 83. | Lewis | 48.7% | 18.6%(+30.1)#83 | 10.0%(+38.7)#427 |
| 84. | Larwill | 48.3% | 18.6%(+29.7)#84 | 10.0%(+38.4)#437 |
| 85. | Kendallville | 48.2% | 18.6%(+29.6)#85 | 10.0%(+38.2)#441 |
| 86. | Clifford | 47.9% | 18.6%(+29.3)#86 | 10.0%(+37.9)#448 |
| 87. | Shepardsville | 47.8% | 18.6%(+29.2)#87 | 10.0%(+37.8)#451 |
| 88. | Spencerville | 47.8% | 18.6%(+29.2)#88 | 10.0%(+37.8)#452 |
| 89. | Somerset | 47.7% | 18.6%(+29.0)#89 | 10.0%(+37.7)#454 |
| 90. | Birdseye | 47.6% | 18.6%(+29.0)#90 | 10.0%(+37.6)#459 |
| 91. | Millersburg | 47.6% | 18.6%(+28.9)#91 | 10.0%(+37.6)#460 |
| 92. | Hoffman Lake | 47.5% | 18.6%(+28.9)#92 | 10.0%(+37.5)#464 |
| 93. | Monon | 47.2% | 18.6%(+28.6)#93 | 10.0%(+37.2)#476 |
| 94. | Nyona Lake | 47.0% | 18.6%(+28.4)#94 | 10.0%(+37.0)#481 |
| 95. | Cromwell | 46.6% | 18.6%(+28.0)#95 | 10.0%(+36.6)#493 |
| 96. | Orland | 46.6% | 18.6%(+27.9)#96 | 10.0%(+36.6)#496 |
| 97. | St Bernice | 46.0% | 18.6%(+27.4)#97 | 10.0%(+36.0)#517 |
| 98. | Macy | 45.8% | 18.6%(+27.2)#98 | 10.0%(+35.8)#520 |
| 99. | Rockfield | 45.7% | 18.6%(+27.1)#99 | 10.0%(+35.8)#528 |
| 100. | Palestine | 45.7% | 18.6%(+27.1)#100 | 10.0%(+35.7)#530 |
Common Questions
What are the Top 10 Cities with the Highest Percentage of Population Employed in Manufacturing in Indiana?
Top 10 Cities with the Highest Percentage of Population Employed in Manufacturing in Indiana are:
What city has the Highest Percentage of Population Employed in Manufacturing in Indiana?
Colburn has the Highest Percentage of Population Employed in Manufacturing in Indiana with 100.0%.
What is the Percentage of Population Employed in Manufacturing in the State of Indiana?
Percentage of Population Employed in Manufacturing in Indiana is 18.6%.
What is the Percentage of Population Employed in Manufacturing in the United States?
Percentage of Population Employed in Manufacturing in the United States is 10.0%.