Cities with the Highest Percentage of Population Employed in Manufacturing in North Carolina
RELATED REPORTS & OPTIONS
Manufacturing
North Carolina
Compare Cities
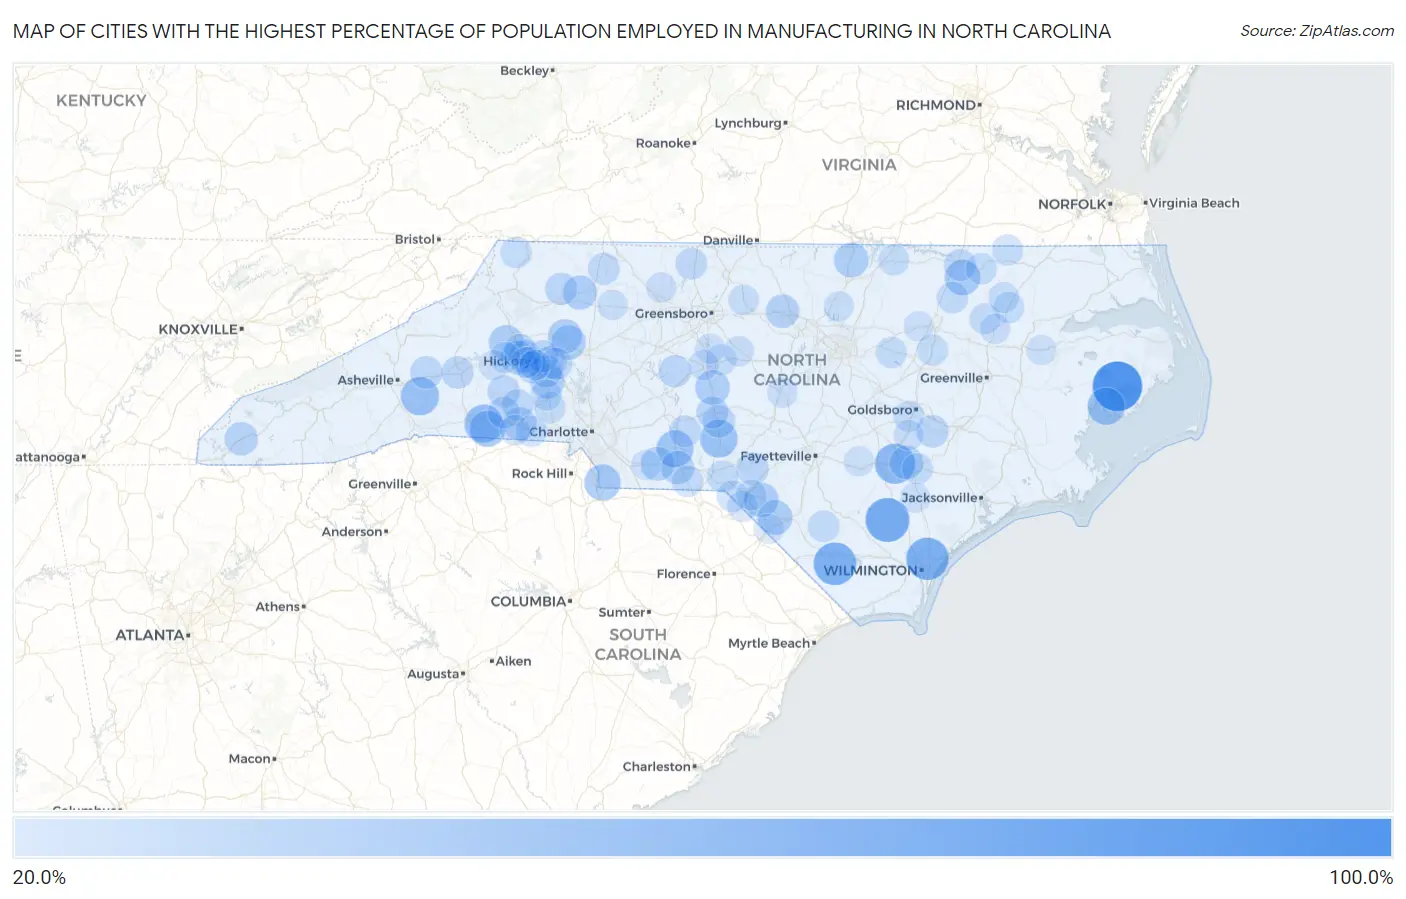
Map of Cities with the Highest Percentage of Population Employed in Manufacturing in North Carolina
0.0%
100.0%
Cities with the Highest Percentage of Population Employed in Manufacturing in North Carolina
| City | % Employed | vs State | vs National | |
| 1. | Long Creek | 100.0% | 11.9%(+88.1)#1 | 10.0%(+90.0)#30 |
| 2. | Fairfield | 97.2% | 11.9%(+85.3)#2 | 10.0%(+87.2)#68 |
| 3. | Ivanhoe | 75.5% | 11.9%(+63.6)#3 | 10.0%(+65.5)#110 |
| 4. | Brunswick | 70.4% | 11.9%(+58.5)#4 | 10.0%(+60.4)#132 |
| 5. | Blue Clay Farms | 69.4% | 11.9%(+57.5)#5 | 10.0%(+59.4)#137 |
| 6. | Turkey | 61.5% | 11.9%(+49.6)#6 | 10.0%(+51.5)#188 |
| 7. | Caroleen | 54.6% | 11.9%(+42.8)#7 | 10.0%(+44.7)#284 |
| 8. | Gerton | 53.8% | 11.9%(+42.0)#8 | 10.0%(+43.9)#300 |
| 9. | Norman | 51.9% | 11.9%(+40.0)#9 | 10.0%(+41.9)#343 |
| 10. | Swan Quarter | 51.1% | 11.9%(+39.2)#10 | 10.0%(+41.1)#356 |
| 11. | Ansonville | 49.3% | 11.9%(+37.4)#11 | 10.0%(+39.3)#418 |
| 12. | Cliffside | 47.1% | 11.9%(+35.3)#12 | 10.0%(+37.1)#477 |
| 13. | Nebo | 47.1% | 11.9%(+35.2)#13 | 10.0%(+37.1)#479 |
| 14. | Jaars | 46.7% | 11.9%(+34.8)#14 | 10.0%(+36.7)#491 |
| 15. | Halifax | 44.8% | 11.9%(+32.9)#15 | 10.0%(+34.8)#557 |
| 16. | Elrod | 42.0% | 11.9%(+30.1)#16 | 10.0%(+32.0)#701 |
| 17. | Maxton | 41.6% | 11.9%(+29.7)#17 | 10.0%(+31.6)#730 |
| 18. | Gamewell | 41.4% | 11.9%(+29.5)#18 | 10.0%(+31.4)#740 |
| 19. | Stovall | 41.1% | 11.9%(+29.2)#19 | 10.0%(+31.1)#752 |
| 20. | Seagrove | 41.0% | 11.9%(+29.1)#20 | 10.0%(+31.0)#760 |
| 21. | Stony Point | 39.9% | 11.9%(+28.0)#21 | 10.0%(+29.9)#849 |
| 22. | Maiden | 39.4% | 11.9%(+27.6)#22 | 10.0%(+29.5)#874 |
| 23. | Hiddenite | 39.4% | 11.9%(+27.6)#23 | 10.0%(+29.4)#875 |
| 24. | Ronda | 39.2% | 11.9%(+27.4)#24 | 10.0%(+29.2)#882 |
| 25. | Peachland | 38.2% | 11.9%(+26.3)#25 | 10.0%(+28.2)#966 |
| 26. | Connelly Springs | 37.9% | 11.9%(+26.0)#26 | 10.0%(+27.9)#986 |
| 27. | Wadesboro | 36.9% | 11.9%(+25.1)#27 | 10.0%(+26.9)#1,067 |
| 28. | Warsaw | 36.7% | 11.9%(+24.8)#28 | 10.0%(+26.7)#1,088 |
| 29. | Efland | 36.7% | 11.9%(+24.8)#29 | 10.0%(+26.7)#1,089 |
| 30. | Marble | 36.4% | 11.9%(+24.5)#30 | 10.0%(+26.4)#1,121 |
| 31. | Light Oak | 36.0% | 11.9%(+24.1)#31 | 10.0%(+26.0)#1,170 |
| 32. | Glenwood | 35.1% | 11.9%(+23.2)#32 | 10.0%(+25.1)#1,279 |
| 33. | Rhodhiss | 35.0% | 11.9%(+23.1)#33 | 10.0%(+25.0)#1,287 |
| 34. | Candor | 34.0% | 11.9%(+22.2)#34 | 10.0%(+24.0)#1,415 |
| 35. | Conover | 33.9% | 11.9%(+22.0)#35 | 10.0%(+23.9)#1,437 |
| 36. | Deercroft | 33.8% | 11.9%(+21.9)#36 | 10.0%(+23.8)#1,445 |
| 37. | Seven Springs | 33.3% | 11.9%(+21.5)#37 | 10.0%(+23.3)#1,521 |
| 38. | Newton | 33.0% | 11.9%(+21.1)#38 | 10.0%(+23.0)#1,559 |
| 39. | Montreat | 32.8% | 11.9%(+21.0)#39 | 10.0%(+22.9)#1,577 |
| 40. | West Marion | 32.8% | 11.9%(+20.9)#40 | 10.0%(+22.8)#1,586 |
| 41. | Casar | 32.6% | 11.9%(+20.7)#41 | 10.0%(+22.6)#1,608 |
| 42. | Denton | 32.5% | 11.9%(+20.6)#42 | 10.0%(+22.5)#1,628 |
| 43. | Biscoe | 32.1% | 11.9%(+20.3)#43 | 10.0%(+22.1)#1,673 |
| 44. | Hays | 32.0% | 11.9%(+20.1)#44 | 10.0%(+22.0)#1,699 |
| 45. | St Stephens | 32.0% | 11.9%(+20.1)#45 | 10.0%(+22.0)#1,701 |
| 46. | Kingstown | 31.7% | 11.9%(+19.8)#46 | 10.0%(+21.7)#1,750 |
| 47. | South Weldon | 31.5% | 11.9%(+19.6)#47 | 10.0%(+21.5)#1,798 |
| 48. | Dobson | 31.1% | 11.9%(+19.2)#48 | 10.0%(+21.1)#1,861 |
| 49. | Sawmills | 30.8% | 11.9%(+18.9)#49 | 10.0%(+20.8)#1,899 |
| 50. | Mayodan | 30.8% | 11.9%(+18.9)#50 | 10.0%(+20.8)#1,903 |
| 51. | Mountain View | 30.7% | 11.9%(+18.8)#51 | 10.0%(+20.7)#1,929 |
| 52. | Long View | 30.7% | 11.9%(+18.8)#52 | 10.0%(+20.7)#1,940 |
| 53. | Mount Gilead | 30.7% | 11.9%(+18.8)#53 | 10.0%(+20.7)#1,941 |
| 54. | Claremont | 30.6% | 11.9%(+18.7)#54 | 10.0%(+20.6)#1,949 |
| 55. | Fallston | 30.5% | 11.9%(+18.6)#55 | 10.0%(+20.5)#1,990 |
| 56. | Milwaukee | 30.3% | 11.9%(+18.4)#56 | 10.0%(+20.3)#2,016 |
| 57. | Bladenboro | 30.1% | 11.9%(+18.2)#57 | 10.0%(+20.1)#2,064 |
| 58. | Kings Mountain | 30.0% | 11.9%(+18.1)#58 | 10.0%(+20.0)#2,069 |
| 59. | Dobbins Heights | 29.8% | 11.9%(+17.9)#59 | 10.0%(+19.8)#2,118 |
| 60. | Enfield | 29.7% | 11.9%(+17.8)#60 | 10.0%(+19.7)#2,127 |
| 61. | Gibson | 29.1% | 11.9%(+17.3)#61 | 10.0%(+19.2)#2,247 |
| 62. | Morven | 29.0% | 11.9%(+17.2)#62 | 10.0%(+19.0)#2,273 |
| 63. | Lansing | 29.0% | 11.9%(+17.1)#63 | 10.0%(+19.0)#2,283 |
| 64. | High Shoals | 29.0% | 11.9%(+17.1)#64 | 10.0%(+19.0)#2,296 |
| 65. | Jackson | 28.9% | 11.9%(+17.0)#65 | 10.0%(+18.9)#2,320 |
| 66. | Middlesex | 28.8% | 11.9%(+16.9)#66 | 10.0%(+18.8)#2,342 |
| 67. | Lewiston Woodville | 28.8% | 11.9%(+16.9)#67 | 10.0%(+18.8)#2,345 |
| 68. | Lincolnton | 28.6% | 11.9%(+16.7)#68 | 10.0%(+18.6)#2,411 |
| 69. | Mar Mac | 28.4% | 11.9%(+16.5)#69 | 10.0%(+18.4)#2,439 |
| 70. | Severn | 28.3% | 11.9%(+16.4)#70 | 10.0%(+18.3)#2,478 |
| 71. | Elm City | 28.2% | 11.9%(+16.4)#71 | 10.0%(+18.2)#2,490 |
| 72. | Hobgood | 28.1% | 11.9%(+16.3)#72 | 10.0%(+18.1)#2,524 |
| 73. | Norlina | 28.0% | 11.9%(+16.1)#73 | 10.0%(+18.0)#2,549 |
| 74. | Drexel | 28.0% | 11.9%(+16.1)#74 | 10.0%(+18.0)#2,561 |
| 75. | Kenansville | 28.0% | 11.9%(+16.1)#75 | 10.0%(+18.0)#2,562 |
| 76. | Franklinville | 27.7% | 11.9%(+15.8)#76 | 10.0%(+17.7)#2,638 |
| 77. | Kelford | 27.6% | 11.9%(+15.7)#77 | 10.0%(+17.6)#2,661 |
| 78. | Brookford | 27.5% | 11.9%(+15.6)#78 | 10.0%(+17.5)#2,691 |
| 79. | Scotch Meadows | 27.4% | 11.9%(+15.5)#79 | 10.0%(+17.4)#2,709 |
| 80. | Hildebran | 27.4% | 11.9%(+15.5)#80 | 10.0%(+17.4)#2,729 |
| 81. | Ossipee | 27.3% | 11.9%(+15.5)#81 | 10.0%(+17.3)#2,747 |
| 82. | East Laurinburg | 26.9% | 11.9%(+15.0)#82 | 10.0%(+16.9)#2,889 |
| 83. | Sanford | 26.2% | 11.9%(+14.3)#83 | 10.0%(+16.2)#3,073 |
| 84. | Asheboro | 26.0% | 11.9%(+14.1)#84 | 10.0%(+16.0)#3,133 |
| 85. | Mount Olive | 25.8% | 11.9%(+13.9)#85 | 10.0%(+15.8)#3,210 |
| 86. | Oak City | 25.7% | 11.9%(+13.9)#86 | 10.0%(+15.7)#3,224 |
| 87. | Germanton | 25.7% | 11.9%(+13.8)#87 | 10.0%(+15.7)#3,245 |
| 88. | Staley | 25.6% | 11.9%(+13.7)#88 | 10.0%(+15.6)#3,264 |
| 89. | Yadkinville | 25.6% | 11.9%(+13.7)#89 | 10.0%(+15.6)#3,271 |
| 90. | Patterson Springs | 25.5% | 11.9%(+13.6)#90 | 10.0%(+15.5)#3,308 |
| 91. | Creedmoor | 25.4% | 11.9%(+13.5)#91 | 10.0%(+15.4)#3,344 |
| 92. | Alexis | 25.3% | 11.9%(+13.5)#92 | 10.0%(+15.3)#3,352 |
| 93. | Salemburg | 25.3% | 11.9%(+13.4)#93 | 10.0%(+15.3)#3,356 |
| 94. | Nashville | 25.2% | 11.9%(+13.4)#94 | 10.0%(+15.2)#3,392 |
| 95. | Rowland | 25.1% | 11.9%(+13.2)#95 | 10.0%(+15.1)#3,426 |
| 96. | Salem | 25.1% | 11.9%(+13.2)#96 | 10.0%(+15.1)#3,440 |
| 97. | Randleman | 25.0% | 11.9%(+13.1)#97 | 10.0%(+15.0)#3,514 |
| 98. | Marshville | 24.8% | 11.9%(+13.0)#98 | 10.0%(+14.8)#3,551 |
| 99. | Jamesville | 24.8% | 11.9%(+12.9)#99 | 10.0%(+14.8)#3,557 |
| 100. | Wallace | 24.7% | 11.9%(+12.8)#100 | 10.0%(+14.7)#3,590 |
Common Questions
What are the Top 10 Cities with the Highest Percentage of Population Employed in Manufacturing in North Carolina?
Top 10 Cities with the Highest Percentage of Population Employed in Manufacturing in North Carolina are:
#1
97.2%
#2
75.5%
#3
70.4%
#4
69.4%
#5
61.5%
#6
54.6%
#7
53.8%
#8
51.9%
#9
51.1%
#10
49.3%
What city has the Highest Percentage of Population Employed in Manufacturing in North Carolina?
Fairfield has the Highest Percentage of Population Employed in Manufacturing in North Carolina with 97.2%.
What is the Percentage of Population Employed in Manufacturing in the State of North Carolina?
Percentage of Population Employed in Manufacturing in North Carolina is 11.9%.
What is the Percentage of Population Employed in Manufacturing in the United States?
Percentage of Population Employed in Manufacturing in the United States is 10.0%.