Cities with the Highest Percentage of Population Employed in Manufacturing in Massachusetts
RELATED REPORTS & OPTIONS
Manufacturing
Massachusetts
Compare Cities
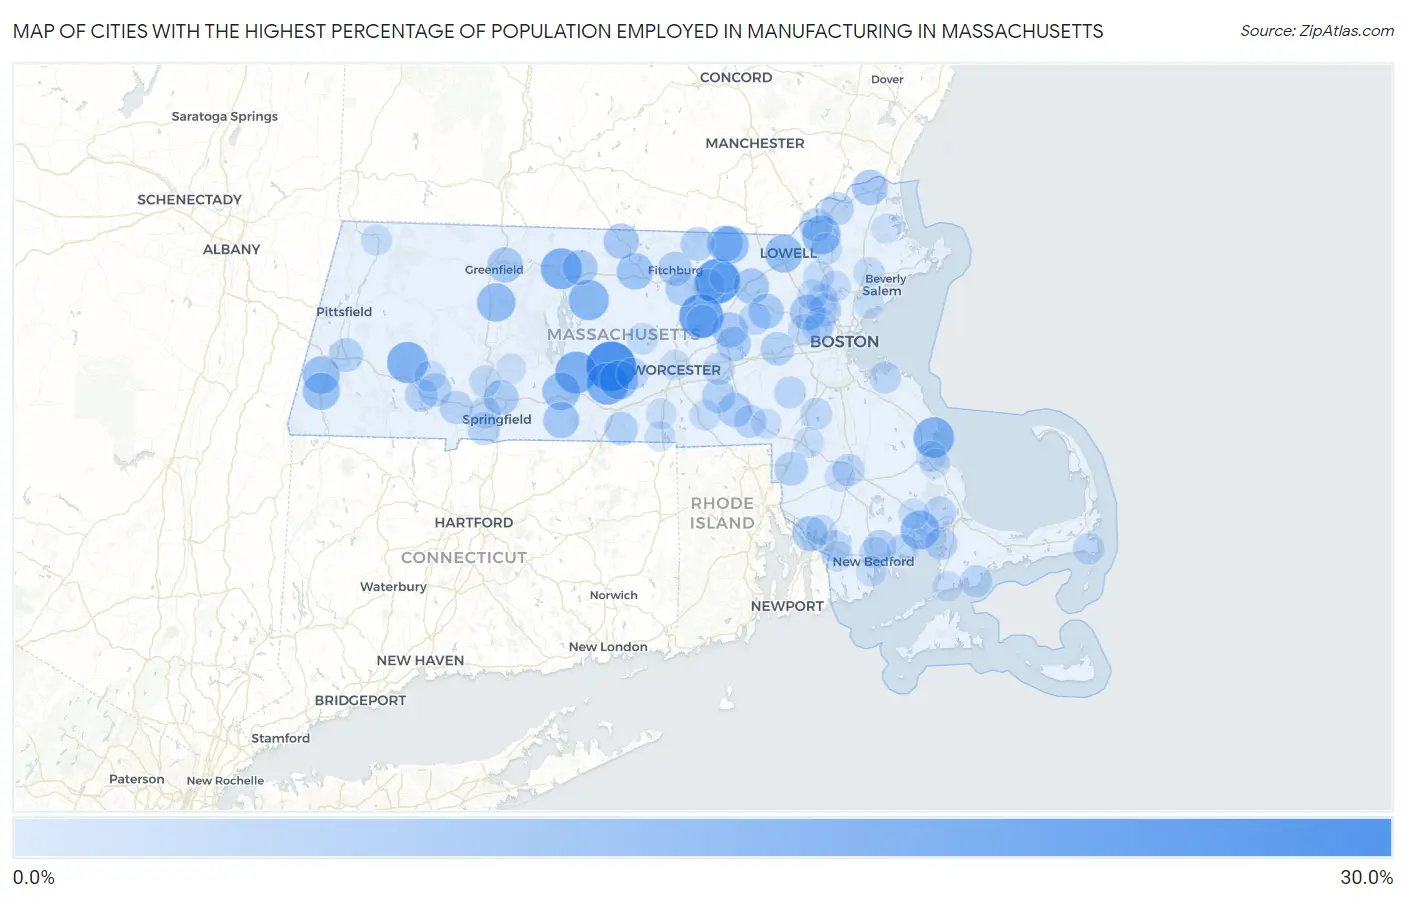
Map of Cities with the Highest Percentage of Population Employed in Manufacturing in Massachusetts
0.0%
30.0%
Cities with the Highest Percentage of Population Employed in Manufacturing in Massachusetts
| City | % Employed | vs State | vs National | |
| 1. | North Brookfield | 29.9% | 9.0%(+20.9)#1 | 10.0%(+19.9)#2,093 |
| 2. | Devens | 25.0% | 9.0%(+16.0)#2 | 10.0%(+15.0)#3,454 |
| 3. | South Lancaster | 24.1% | 9.0%(+15.1)#3 | 10.0%(+14.1)#3,784 |
| 4. | Ware | 21.7% | 9.0%(+12.7)#4 | 10.0%(+11.7)#4,830 |
| 5. | Brookfield | 21.7% | 9.0%(+12.7)#5 | 10.0%(+11.7)#4,833 |
| 6. | Chester | 20.9% | 9.0%(+12.0)#6 | 10.0%(+11.0)#5,205 |
| 7. | Orange | 20.9% | 9.0%(+11.9)#7 | 10.0%(+10.9)#5,260 |
| 8. | Duxbury | 20.4% | 9.0%(+11.5)#8 | 10.0%(+10.4)#5,486 |
| 9. | Petersham | 20.0% | 9.0%(+11.0)#9 | 10.0%(+10.0)#5,740 |
| 10. | East Brookfield | 18.5% | 9.0%(+9.52)#10 | 10.0%(+8.52)#6,759 |
| 11. | Weweantic | 18.2% | 9.0%(+9.22)#11 | 10.0%(+8.21)#6,947 |
| 12. | Lawrence | 18.2% | 9.0%(+9.18)#12 | 10.0%(+8.18)#6,992 |
| 13. | South Deerfield | 18.0% | 9.0%(+8.99)#13 | 10.0%(+7.99)#7,124 |
| 14. | Palmer Town | 17.2% | 9.0%(+8.25)#14 | 10.0%(+7.25)#7,643 |
| 15. | East Pepperell | 17.2% | 9.0%(+8.20)#15 | 10.0%(+7.20)#7,678 |
| 16. | Lowell | 17.1% | 9.0%(+8.15)#16 | 10.0%(+7.15)#7,711 |
| 17. | Housatonic | 16.8% | 9.0%(+7.77)#17 | 10.0%(+6.76)#7,958 |
| 18. | Great Barrington | 16.6% | 9.0%(+7.59)#18 | 10.0%(+6.59)#8,142 |
| 19. | Gardner | 16.1% | 9.0%(+7.09)#19 | 10.0%(+6.09)#8,535 |
| 20. | Pepperell | 15.7% | 9.0%(+6.67)#20 | 10.0%(+5.67)#8,948 |
| 21. | Monson Center | 15.5% | 9.0%(+6.47)#21 | 10.0%(+5.47)#9,129 |
| 22. | Littleton Common | 15.1% | 9.0%(+6.10)#22 | 10.0%(+5.09)#9,471 |
| 23. | Amesbury Town | 15.0% | 9.0%(+5.98)#23 | 10.0%(+4.98)#9,589 |
| 24. | Winchendon | 14.9% | 9.0%(+5.91)#24 | 10.0%(+4.91)#9,652 |
| 25. | Lexington | 14.9% | 9.0%(+5.87)#25 | 10.0%(+4.87)#9,693 |
| 26. | Hudson | 14.8% | 9.0%(+5.84)#26 | 10.0%(+4.84)#9,717 |
| 27. | Turners Falls | 14.7% | 9.0%(+5.73)#27 | 10.0%(+4.73)#9,827 |
| 28. | Athol | 14.5% | 9.0%(+5.48)#28 | 10.0%(+4.48)#10,075 |
| 29. | Ocean Grove | 14.5% | 9.0%(+5.47)#29 | 10.0%(+4.47)#10,082 |
| 30. | West Concord | 14.5% | 9.0%(+5.46)#30 | 10.0%(+4.46)#10,090 |
| 31. | Chicopee | 14.1% | 9.0%(+5.09)#31 | 10.0%(+4.09)#10,466 |
| 32. | Hopedale | 13.9% | 9.0%(+4.93)#32 | 10.0%(+3.93)#10,607 |
| 33. | Marlborough | 13.8% | 9.0%(+4.82)#33 | 10.0%(+3.81)#10,713 |
| 34. | Fitchburg | 13.6% | 9.0%(+4.60)#34 | 10.0%(+3.60)#10,954 |
| 35. | Leominster | 13.4% | 9.0%(+4.43)#35 | 10.0%(+3.43)#11,157 |
| 36. | Lee | 13.2% | 9.0%(+4.25)#36 | 10.0%(+3.25)#11,354 |
| 37. | Attleboro | 13.1% | 9.0%(+4.10)#37 | 10.0%(+3.10)#11,522 |
| 38. | Townsend | 13.1% | 9.0%(+4.09)#38 | 10.0%(+3.09)#11,525 |
| 39. | Southbridge Town | 13.1% | 9.0%(+4.09)#39 | 10.0%(+3.09)#11,531 |
| 40. | Upton | 13.1% | 9.0%(+4.07)#40 | 10.0%(+3.06)#11,556 |
| 41. | Cochituate | 13.0% | 9.0%(+4.06)#41 | 10.0%(+3.06)#11,561 |
| 42. | Methuen Town | 12.9% | 9.0%(+3.88)#42 | 10.0%(+2.88)#11,738 |
| 43. | Russell | 12.7% | 9.0%(+3.73)#43 | 10.0%(+2.73)#11,919 |
| 44. | Haverhill | 12.5% | 9.0%(+3.47)#44 | 10.0%(+2.47)#12,203 |
| 45. | Westfield | 12.5% | 9.0%(+3.47)#45 | 10.0%(+2.47)#12,204 |
| 46. | Blandford | 12.4% | 9.0%(+3.37)#46 | 10.0%(+2.37)#12,306 |
| 47. | Clinton | 12.2% | 9.0%(+3.20)#47 | 10.0%(+2.20)#12,489 |
| 48. | Agawam Town | 12.1% | 9.0%(+3.10)#48 | 10.0%(+2.10)#12,600 |
| 49. | Pocasset | 12.1% | 9.0%(+3.09)#49 | 10.0%(+2.08)#12,632 |
| 50. | Bellingham | 12.1% | 9.0%(+3.08)#50 | 10.0%(+2.08)#12,636 |
| 51. | Acushnet Center | 12.0% | 9.0%(+3.02)#51 | 10.0%(+2.02)#12,694 |
| 52. | Westborough | 11.8% | 9.0%(+2.83)#52 | 10.0%(+1.83)#12,942 |
| 53. | White Island Shores | 11.8% | 9.0%(+2.81)#53 | 10.0%(+1.81)#12,967 |
| 54. | Winchester | 11.7% | 9.0%(+2.69)#54 | 10.0%(+1.69)#13,111 |
| 55. | Raynham Center | 11.6% | 9.0%(+2.66)#55 | 10.0%(+1.66)#13,146 |
| 56. | New Seabury | 11.6% | 9.0%(+2.60)#56 | 10.0%(+1.60)#13,211 |
| 57. | Medfield | 11.5% | 9.0%(+2.53)#57 | 10.0%(+1.53)#13,302 |
| 58. | Shirley | 11.5% | 9.0%(+2.52)#58 | 10.0%(+1.51)#13,324 |
| 59. | Spencer | 11.5% | 9.0%(+2.50)#59 | 10.0%(+1.50)#13,344 |
| 60. | West Springfield Town | 11.4% | 9.0%(+2.40)#60 | 10.0%(+1.40)#13,449 |
| 61. | Maynard | 11.4% | 9.0%(+2.38)#61 | 10.0%(+1.38)#13,468 |
| 62. | Hingham | 11.3% | 9.0%(+2.32)#62 | 10.0%(+1.32)#13,547 |
| 63. | Fall River | 11.3% | 9.0%(+2.31)#63 | 10.0%(+1.30)#13,573 |
| 64. | Sharon | 11.2% | 9.0%(+2.18)#64 | 10.0%(+1.18)#13,727 |
| 65. | Holyoke | 11.1% | 9.0%(+2.12)#65 | 10.0%(+1.12)#13,771 |
| 66. | Woburn | 11.1% | 9.0%(+2.10)#66 | 10.0%(+1.10)#13,850 |
| 67. | Waltham | 11.1% | 9.0%(+2.08)#67 | 10.0%(+1.07)#13,879 |
| 68. | North Attleborough | 11.0% | 9.0%(+2.06)#68 | 10.0%(+1.06)#13,898 |
| 69. | Mattapoisett Center | 11.0% | 9.0%(+2.05)#69 | 10.0%(+1.05)#13,901 |
| 70. | West Chatham | 11.0% | 9.0%(+1.99)#70 | 10.0%(+0.990)#13,982 |
| 71. | New Bedford | 10.9% | 9.0%(+1.95)#71 | 10.0%(+0.948)#14,030 |
| 72. | Rutland | 10.9% | 9.0%(+1.88)#72 | 10.0%(+0.881)#14,123 |
| 73. | Huntington | 10.9% | 9.0%(+1.87)#73 | 10.0%(+0.869)#14,150 |
| 74. | Andover | 10.8% | 9.0%(+1.85)#74 | 10.0%(+0.851)#14,172 |
| 75. | Burlington | 10.5% | 9.0%(+1.51)#75 | 10.0%(+0.507)#14,593 |
| 76. | Arlington | 10.5% | 9.0%(+1.48)#76 | 10.0%(+0.476)#14,631 |
| 77. | Wilmington | 10.4% | 9.0%(+1.45)#77 | 10.0%(+0.450)#14,658 |
| 78. | North Adams | 10.4% | 9.0%(+1.41)#78 | 10.0%(+0.413)#14,695 |
| 79. | Reading | 10.4% | 9.0%(+1.38)#79 | 10.0%(+0.381)#14,731 |
| 80. | Whitinsville | 10.3% | 9.0%(+1.33)#80 | 10.0%(+0.330)#14,800 |
| 81. | Danvers | 10.3% | 9.0%(+1.33)#81 | 10.0%(+0.328)#14,802 |
| 82. | North Plymouth | 10.2% | 9.0%(+1.20)#82 | 10.0%(+0.203)#14,960 |
| 83. | Somerset | 10.2% | 9.0%(+1.20)#83 | 10.0%(+0.196)#14,965 |
| 84. | Belmont | 10.2% | 9.0%(+1.17)#84 | 10.0%(+0.169)#15,000 |
| 85. | Ayer | 10.1% | 9.0%(+1.10)#85 | 10.0%(+0.100)#15,092 |
| 86. | Mansfield Center | 10.1% | 9.0%(+1.10)#86 | 10.0%(+0.095)#15,098 |
| 87. | North Westport | 10.1% | 9.0%(+1.08)#87 | 10.0%(+0.079)#15,129 |
| 88. | Taunton | 10.0% | 9.0%(+1.04)#88 | 10.0%(+0.038)#15,165 |
| 89. | Worcester | 10.0% | 9.0%(+1.03)#89 | 10.0%(+0.026)#15,172 |
| 90. | West Wareham | 9.9% | 9.0%(+0.938)#90 | 10.0%(-0.064)#15,314 |
| 91. | Oxford | 9.9% | 9.0%(+0.930)#91 | 10.0%(-0.071)#15,321 |
| 92. | Bliss Corner | 9.9% | 9.0%(+0.903)#92 | 10.0%(-0.099)#15,353 |
| 93. | Falmouth | 9.8% | 9.0%(+0.820)#93 | 10.0%(-0.182)#15,474 |
| 94. | Franklin Town | 9.7% | 9.0%(+0.754)#94 | 10.0%(-0.248)#15,574 |
| 95. | Webster | 9.7% | 9.0%(+0.725)#95 | 10.0%(-0.276)#15,608 |
| 96. | Lynn | 9.7% | 9.0%(+0.666)#96 | 10.0%(-0.336)#15,692 |
| 97. | Plymouth | 9.5% | 9.0%(+0.496)#97 | 10.0%(-0.505)#15,912 |
| 98. | Rowley | 9.4% | 9.0%(+0.441)#98 | 10.0%(-0.561)#15,987 |
| 99. | Granby | 9.4% | 9.0%(+0.424)#99 | 10.0%(-0.578)#16,002 |
| 100. | Greenfield | 9.3% | 9.0%(+0.346)#100 | 10.0%(-0.655)#16,104 |
Common Questions
What are the Top 10 Cities with the Highest Percentage of Population Employed in Manufacturing in Massachusetts?
Top 10 Cities with the Highest Percentage of Population Employed in Manufacturing in Massachusetts are:
#1
29.9%
#2
25.0%
#3
24.1%
#4
21.7%
#5
21.7%
#6
20.9%
#7
20.9%
#8
20.4%
#9
20.0%
#10
18.5%
What city has the Highest Percentage of Population Employed in Manufacturing in Massachusetts?
North Brookfield has the Highest Percentage of Population Employed in Manufacturing in Massachusetts with 29.9%.
What is the Percentage of Population Employed in Manufacturing in the State of Massachusetts?
Percentage of Population Employed in Manufacturing in Massachusetts is 9.0%.
What is the Percentage of Population Employed in Manufacturing in the United States?
Percentage of Population Employed in Manufacturing in the United States is 10.0%.