Cities with the Highest Percentage of Population Employed in Manufacturing in Mississippi
RELATED REPORTS & OPTIONS
Manufacturing
Mississippi
Compare Cities
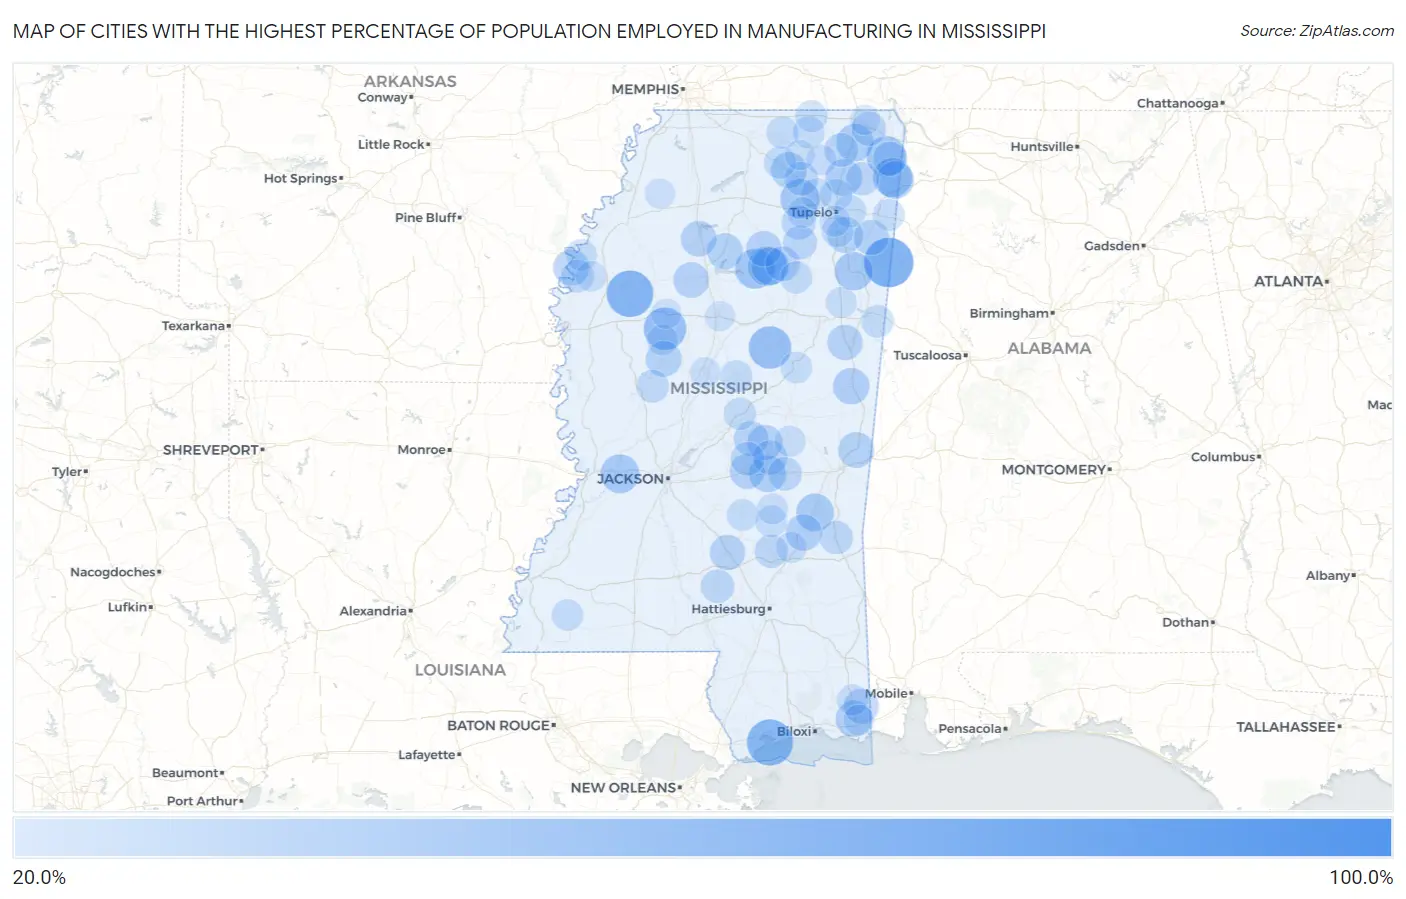
Map of Cities with the Highest Percentage of Population Employed in Manufacturing in Mississippi
0.0%
100.0%
Cities with the Highest Percentage of Population Employed in Manufacturing in Mississippi
| City | % Employed | vs State | vs National | |
| 1. | Harperville | 100.0% | 13.3%(+86.7)#1 | 10.0%(+90.0)#3 |
| 2. | Strayhorn | 100.0% | 13.3%(+86.7)#2 | 10.0%(+90.0)#24 |
| 3. | Gattman | 71.1% | 13.3%(+57.8)#3 | 10.0%(+61.1)#127 |
| 4. | Randolph | 70.6% | 13.3%(+57.3)#4 | 10.0%(+60.6)#130 |
| 5. | Hermanville | 69.2% | 13.3%(+55.9)#5 | 10.0%(+59.2)#138 |
| 6. | Biggersville | 68.3% | 13.3%(+55.0)#6 | 10.0%(+58.3)#142 |
| 7. | Doddsville | 63.6% | 13.3%(+50.3)#7 | 10.0%(+53.6)#169 |
| 8. | Henderson Point | 62.5% | 13.3%(+49.2)#8 | 10.0%(+52.5)#179 |
| 9. | Tula | 55.8% | 13.3%(+42.5)#9 | 10.0%(+45.8)#258 |
| 10. | Elizabeth | 55.0% | 13.3%(+41.7)#10 | 10.0%(+45.0)#277 |
| 11. | Sidon | 53.2% | 13.3%(+39.9)#11 | 10.0%(+43.2)#318 |
| 12. | Weir | 53.1% | 13.3%(+39.8)#12 | 10.0%(+43.1)#319 |
| 13. | Agricola | 49.3% | 13.3%(+36.0)#13 | 10.0%(+39.3)#420 |
| 14. | Big Creek | 46.3% | 13.3%(+33.0)#14 | 10.0%(+36.3)#505 |
| 15. | Paden | 45.7% | 13.3%(+32.4)#15 | 10.0%(+35.7)#532 |
| 16. | Calhoun City | 45.1% | 13.3%(+31.8)#16 | 10.0%(+35.1)#548 |
| 17. | Ecru | 44.7% | 13.3%(+31.3)#17 | 10.0%(+34.7)#564 |
| 18. | Belmont | 44.1% | 13.3%(+30.8)#18 | 10.0%(+34.1)#599 |
| 19. | Edwards | 43.4% | 13.3%(+30.1)#19 | 10.0%(+33.5)#634 |
| 20. | Wheeler | 42.5% | 13.3%(+29.2)#20 | 10.0%(+32.5)#678 |
| 21. | Aberdeen | 42.2% | 13.3%(+28.9)#21 | 10.0%(+32.2)#689 |
| 22. | Valley Park | 41.7% | 13.3%(+28.4)#22 | 10.0%(+31.7)#725 |
| 23. | Pachuta | 41.0% | 13.3%(+27.7)#23 | 10.0%(+31.0)#758 |
| 24. | Derma | 40.6% | 13.3%(+27.3)#24 | 10.0%(+30.6)#794 |
| 25. | Golden | 40.4% | 13.3%(+27.1)#25 | 10.0%(+30.4)#807 |
| 26. | Rienzi | 40.2% | 13.3%(+26.9)#26 | 10.0%(+30.2)#821 |
| 27. | Baldwyn | 39.3% | 13.3%(+26.0)#27 | 10.0%(+29.3)#881 |
| 28. | Lake | 38.9% | 13.3%(+25.6)#28 | 10.0%(+28.9)#903 |
| 29. | Shuqualak | 37.5% | 13.3%(+24.2)#29 | 10.0%(+27.5)#1,017 |
| 30. | Heidelberg | 37.3% | 13.3%(+24.0)#30 | 10.0%(+27.3)#1,037 |
| 31. | Escatawpa | 37.2% | 13.3%(+23.9)#31 | 10.0%(+27.2)#1,042 |
| 32. | Tchula | 36.5% | 13.3%(+23.2)#32 | 10.0%(+26.5)#1,109 |
| 33. | Coffeeville | 36.4% | 13.3%(+23.1)#33 | 10.0%(+26.5)#1,112 |
| 34. | Rosedale | 36.4% | 13.3%(+23.1)#34 | 10.0%(+26.4)#1,115 |
| 35. | Nettleton | 36.2% | 13.3%(+22.9)#35 | 10.0%(+26.2)#1,148 |
| 36. | Myrtle | 36.2% | 13.3%(+22.9)#36 | 10.0%(+26.2)#1,149 |
| 37. | Lauderdale | 35.8% | 13.3%(+22.5)#37 | 10.0%(+25.8)#1,187 |
| 38. | Holcomb | 35.5% | 13.3%(+22.2)#38 | 10.0%(+25.5)#1,228 |
| 39. | Oakland | 35.4% | 13.3%(+22.1)#39 | 10.0%(+25.4)#1,242 |
| 40. | Bruce | 35.1% | 13.3%(+21.8)#40 | 10.0%(+25.1)#1,277 |
| 41. | Crawford | 34.9% | 13.3%(+21.6)#41 | 10.0%(+24.9)#1,296 |
| 42. | Forest | 34.8% | 13.3%(+21.5)#42 | 10.0%(+24.8)#1,302 |
| 43. | Mount Olive | 34.7% | 13.3%(+21.4)#43 | 10.0%(+24.7)#1,320 |
| 44. | Smithville | 34.6% | 13.3%(+21.3)#44 | 10.0%(+24.7)#1,335 |
| 45. | Sebastopol | 34.4% | 13.3%(+21.1)#45 | 10.0%(+24.4)#1,357 |
| 46. | Big Point | 33.9% | 13.3%(+20.6)#46 | 10.0%(+23.9)#1,427 |
| 47. | Walnut Grove | 33.3% | 13.3%(+20.0)#47 | 10.0%(+23.3)#1,487 |
| 48. | Vardaman | 33.2% | 13.3%(+19.9)#48 | 10.0%(+23.2)#1,540 |
| 49. | Conehatta | 32.7% | 13.3%(+19.4)#49 | 10.0%(+22.7)#1,598 |
| 50. | Glen | 32.5% | 13.3%(+19.2)#50 | 10.0%(+22.5)#1,622 |
| 51. | Tishomingo | 32.0% | 13.3%(+18.7)#51 | 10.0%(+22.0)#1,694 |
| 52. | Algoma | 31.7% | 13.3%(+18.4)#52 | 10.0%(+21.7)#1,755 |
| 53. | New Houlka | 31.7% | 13.3%(+18.3)#53 | 10.0%(+21.7)#1,757 |
| 54. | Jumpertown | 31.1% | 13.3%(+17.8)#54 | 10.0%(+21.2)#1,850 |
| 55. | Newton | 31.0% | 13.3%(+17.7)#55 | 10.0%(+21.0)#1,874 |
| 56. | New Albany | 30.7% | 13.3%(+17.4)#56 | 10.0%(+20.7)#1,930 |
| 57. | Hillsboro | 30.7% | 13.3%(+17.4)#57 | 10.0%(+20.7)#1,933 |
| 58. | Bassfield | 30.4% | 13.3%(+17.1)#58 | 10.0%(+20.4)#1,993 |
| 59. | De Soto | 30.3% | 13.3%(+17.0)#59 | 10.0%(+20.3)#2,020 |
| 60. | Shubuta | 30.1% | 13.3%(+16.8)#60 | 10.0%(+20.1)#2,048 |
| 61. | Marietta | 30.0% | 13.3%(+16.7)#61 | 10.0%(+20.0)#2,076 |
| 62. | Soso | 29.7% | 13.3%(+16.4)#62 | 10.0%(+19.7)#2,123 |
| 63. | Eden | 28.6% | 13.3%(+15.3)#63 | 10.0%(+18.6)#2,390 |
| 64. | Beulah | 28.3% | 13.3%(+15.0)#64 | 10.0%(+18.3)#2,465 |
| 65. | New Hope | 27.8% | 13.3%(+14.5)#65 | 10.0%(+17.8)#2,592 |
| 66. | Redwater | 27.5% | 13.3%(+14.2)#66 | 10.0%(+17.5)#2,698 |
| 67. | Mooreville | 27.2% | 13.3%(+13.9)#67 | 10.0%(+17.3)#2,790 |
| 68. | Hickory Flat | 27.2% | 13.3%(+13.9)#68 | 10.0%(+17.2)#2,800 |
| 69. | Ashland | 27.2% | 13.3%(+13.9)#69 | 10.0%(+17.2)#2,801 |
| 70. | Woodland | 27.1% | 13.3%(+13.8)#70 | 10.0%(+17.1)#2,831 |
| 71. | Saltillo | 27.0% | 13.3%(+13.7)#71 | 10.0%(+17.0)#2,855 |
| 72. | Kosciusko | 26.9% | 13.3%(+13.6)#72 | 10.0%(+16.9)#2,869 |
| 73. | Falkner | 26.4% | 13.3%(+13.1)#73 | 10.0%(+16.4)#3,032 |
| 74. | Shannon | 26.2% | 13.3%(+12.9)#74 | 10.0%(+16.2)#3,070 |
| 75. | Raleigh | 26.2% | 13.3%(+12.9)#75 | 10.0%(+16.2)#3,083 |
| 76. | Walnut | 26.1% | 13.3%(+12.8)#76 | 10.0%(+16.1)#3,100 |
| 77. | Tremont | 26.1% | 13.3%(+12.8)#77 | 10.0%(+16.1)#3,107 |
| 78. | Bay Springs | 25.9% | 13.3%(+12.6)#78 | 10.0%(+15.9)#3,171 |
| 79. | Gunnison | 25.6% | 13.3%(+12.3)#79 | 10.0%(+15.6)#3,265 |
| 80. | Louisville | 25.6% | 13.3%(+12.3)#80 | 10.0%(+15.6)#3,270 |
| 81. | Crosby | 25.4% | 13.3%(+12.1)#81 | 10.0%(+15.4)#3,321 |
| 82. | Victoria | 25.1% | 13.3%(+11.8)#82 | 10.0%(+15.2)#3,414 |
| 83. | Wade | 24.9% | 13.3%(+11.6)#83 | 10.0%(+14.9)#3,530 |
| 84. | Blue Springs | 24.8% | 13.3%(+11.5)#84 | 10.0%(+14.9)#3,547 |
| 85. | Union | 24.5% | 13.3%(+11.2)#85 | 10.0%(+14.5)#3,673 |
| 86. | Sharon | 24.2% | 13.3%(+10.9)#86 | 10.0%(+14.2)#3,769 |
| 87. | Cruger | 24.1% | 13.3%(+10.7)#87 | 10.0%(+14.1)#3,828 |
| 88. | Louin | 24.0% | 13.3%(+10.7)#88 | 10.0%(+14.0)#3,846 |
| 89. | West Point | 24.0% | 13.3%(+10.7)#89 | 10.0%(+14.0)#3,855 |
| 90. | Verona | 23.8% | 13.3%(+10.5)#90 | 10.0%(+13.8)#3,910 |
| 91. | Helena | 23.2% | 13.3%(+9.85)#91 | 10.0%(+13.2)#4,163 |
| 92. | Pace | 23.1% | 13.3%(+9.77)#92 | 10.0%(+13.1)#4,184 |
| 93. | Durant | 23.0% | 13.3%(+9.74)#93 | 10.0%(+13.1)#4,201 |
| 94. | Pontotoc | 23.0% | 13.3%(+9.71)#94 | 10.0%(+13.0)#4,215 |
| 95. | Dumas | 22.7% | 13.3%(+9.42)#95 | 10.0%(+12.7)#4,341 |
| 96. | Falcon | 22.4% | 13.3%(+9.14)#96 | 10.0%(+12.5)#4,470 |
| 97. | Winona | 22.2% | 13.3%(+8.94)#97 | 10.0%(+12.3)#4,558 |
| 98. | Greenwood | 22.2% | 13.3%(+8.89)#98 | 10.0%(+12.2)#4,592 |
| 99. | Farmington | 22.1% | 13.3%(+8.84)#99 | 10.0%(+12.2)#4,613 |
| 100. | Blue Mountain | 22.0% | 13.3%(+8.70)#100 | 10.0%(+12.0)#4,668 |
Common Questions
What are the Top 10 Cities with the Highest Percentage of Population Employed in Manufacturing in Mississippi?
Top 10 Cities with the Highest Percentage of Population Employed in Manufacturing in Mississippi are:
#1
71.1%
#2
63.6%
#3
62.5%
#4
53.2%
#5
53.1%
#6
46.3%
#7
45.7%
#8
45.1%
#9
44.7%
#10
44.1%
What city has the Highest Percentage of Population Employed in Manufacturing in Mississippi?
Gattman has the Highest Percentage of Population Employed in Manufacturing in Mississippi with 71.1%.
What is the Percentage of Population Employed in Manufacturing in the State of Mississippi?
Percentage of Population Employed in Manufacturing in Mississippi is 13.3%.
What is the Percentage of Population Employed in Manufacturing in the United States?
Percentage of Population Employed in Manufacturing in the United States is 10.0%.