Orland, CA Map & Demographics
Orland Map
Orland Overview
$23,601
PER CAPITA INCOME
$64,261
AVG FAMILY INCOME
$61,587
AVG HOUSEHOLD INCOME
23.9%
WAGE / INCOME GAP [ % ]
76.1¢/ $1
WAGE / INCOME GAP [ $ ]
$8,286
FAMILY INCOME DEFICIT
0.37
INEQUALITY / GINI INDEX
8,221
TOTAL POPULATION
4,087
MALE POPULATION
4,134
FEMALE POPULATION
98.86
MALES / 100 FEMALES
101.15
FEMALES / 100 MALES
34.3
MEDIAN AGE
3.6
AVG FAMILY SIZE
2.9
AVG HOUSEHOLD SIZE
3,637
LABOR FORCE [ PEOPLE ]
63.4%
PERCENT IN LABOR FORCE
7.2%
UNEMPLOYMENT RATE
Orland Zip Codes
Orland Area Codes
Income in Orland
Income Overview in Orland
Per Capita Income in Orland is $23,601, while median incomes of families and households are $64,261 and $61,587 respectively.
| Characteristic | Number | Measure |
| Per Capita Income | 8,221 | $23,601 |
| Median Family Income | 1,994 | $64,261 |
| Mean Family Income | 1,994 | $72,743 |
| Median Household Income | 2,788 | $61,587 |
| Mean Household Income | 2,788 | $67,104 |
| Income Deficit | 1,994 | $8,286 |
| Wage / Income Gap (%) | 8,221 | 23.86% |
| Wage / Income Gap ($) | 8,221 | 76.14¢ per $1 |
| Gini / Inequality Index | 8,221 | 0.37 |
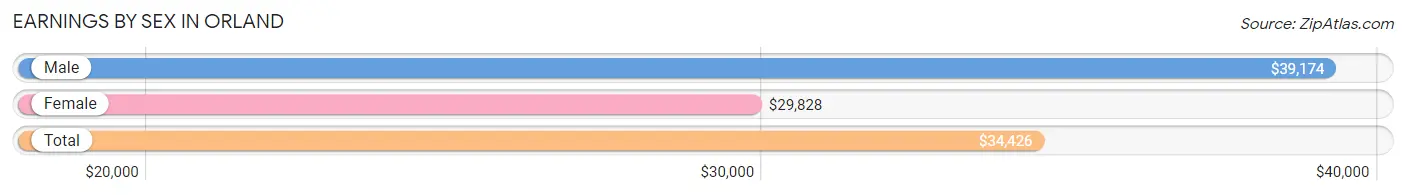
Earnings by Sex in Orland
Average Earnings in Orland are $34,426, $39,174 for men and $29,828 for women, a difference of 23.9%.
| Sex | Number | Average Earnings |
| Male | 1,944 (52.5%) | $39,174 |
| Female | 1,762 (47.5%) | $29,828 |
| Total | 3,706 (100.0%) | $34,426 |
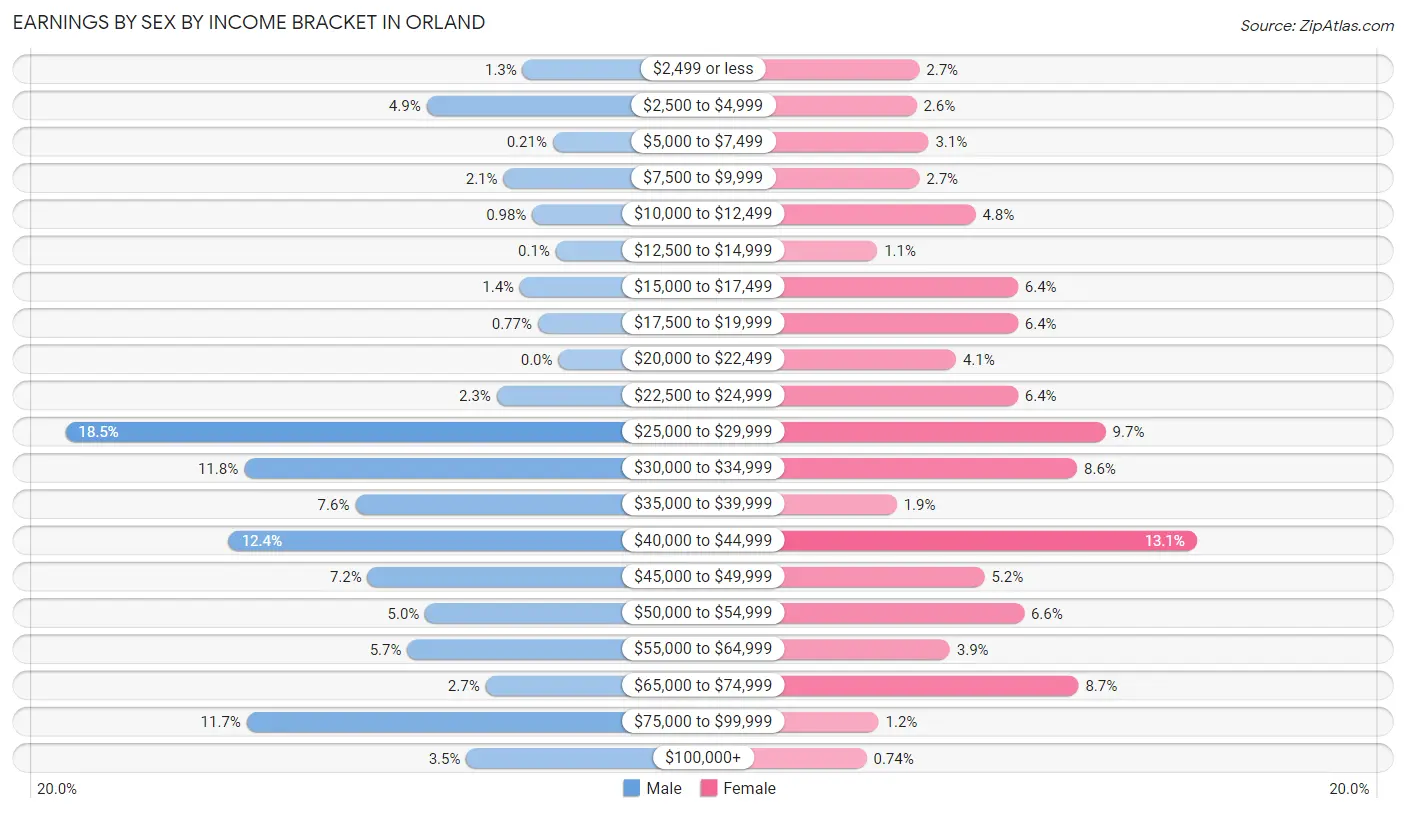
Earnings by Sex by Income Bracket in Orland
The most common earnings brackets in Orland are $25,000 to $29,999 for men (359 | 18.5%) and $40,000 to $44,999 for women (231 | 13.1%).
| Income | Male | Female |
| $2,499 or less | 26 (1.3%) | 48 (2.7%) |
| $2,500 to $4,999 | 96 (4.9%) | 46 (2.6%) |
| $5,000 to $7,499 | 4 (0.2%) | 54 (3.1%) |
| $7,500 to $9,999 | 40 (2.1%) | 48 (2.7%) |
| $10,000 to $12,499 | 19 (1.0%) | 85 (4.8%) |
| $12,500 to $14,999 | 2 (0.1%) | 20 (1.1%) |
| $15,000 to $17,499 | 28 (1.4%) | 113 (6.4%) |
| $17,500 to $19,999 | 15 (0.8%) | 113 (6.4%) |
| $20,000 to $22,499 | 0 (0.0%) | 72 (4.1%) |
| $22,500 to $24,999 | 45 (2.3%) | 113 (6.4%) |
| $25,000 to $29,999 | 359 (18.5%) | 171 (9.7%) |
| $30,000 to $34,999 | 229 (11.8%) | 152 (8.6%) |
| $35,000 to $39,999 | 148 (7.6%) | 33 (1.9%) |
| $40,000 to $44,999 | 240 (12.3%) | 231 (13.1%) |
| $45,000 to $49,999 | 139 (7.1%) | 91 (5.2%) |
| $50,000 to $54,999 | 97 (5.0%) | 117 (6.6%) |
| $55,000 to $64,999 | 110 (5.7%) | 68 (3.9%) |
| $65,000 to $74,999 | 53 (2.7%) | 153 (8.7%) |
| $75,000 to $99,999 | 227 (11.7%) | 21 (1.2%) |
| $100,000+ | 67 (3.5%) | 13 (0.7%) |
| Total | 1,944 (100.0%) | 1,762 (100.0%) |
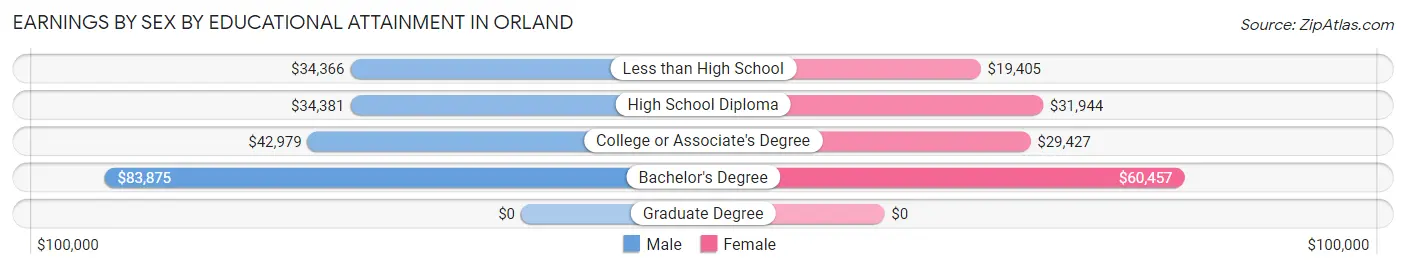
Earnings by Sex by Educational Attainment in Orland
Average earnings in Orland are $39,417 for men and $27,759 for women, a difference of 29.6%. Men with an educational attainment of bachelor's degree enjoy the highest average annual earnings of $83,875, while those with less than high school education earn the least with $34,366. Women with an educational attainment of bachelor's degree earn the most with the average annual earnings of $60,457, while those with less than high school education have the smallest earnings of $19,405.
| Educational Attainment | Male Income | Female Income |
| Less than High School | $34,366 | $19,405 |
| High School Diploma | $34,381 | $31,944 |
| College or Associate's Degree | $42,979 | $29,427 |
| Bachelor's Degree | $83,875 | $60,457 |
| Graduate Degree | - | - |
| Total | $39,417 | $27,759 |
Family Income in Orland
Family Income Brackets in Orland
According to the Orland family income data, there are 395 families falling into the $50,000 to $74,999 income range, which is the most common income bracket and makes up 19.8% of all families. Conversely, the $200,000+ income bracket is the least frequent group with only 30 families (1.5%) belonging to this category.
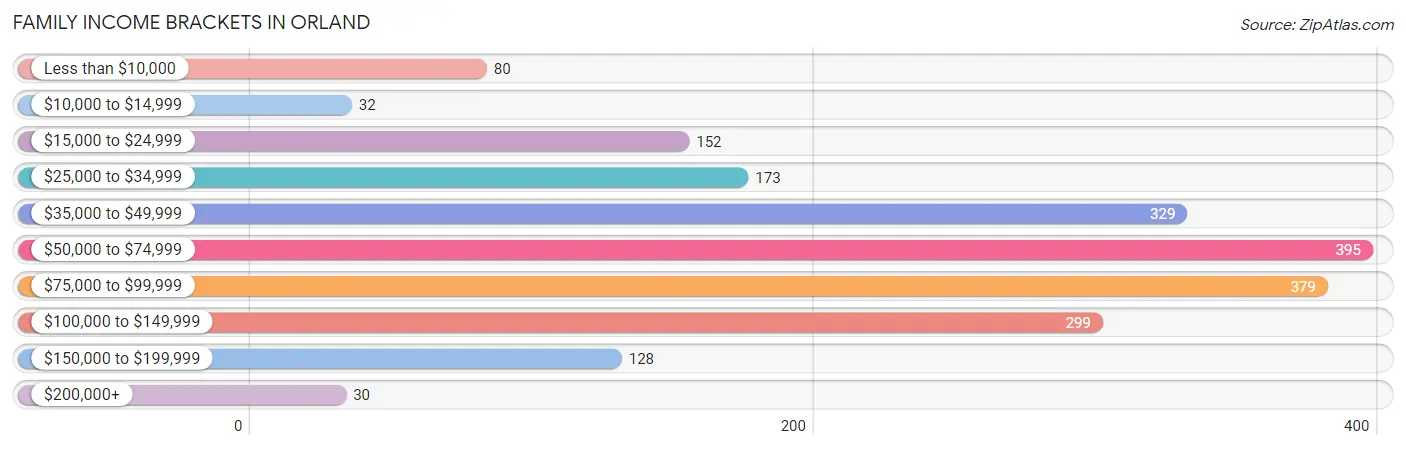
| Income Bracket | # Families | % Families |
| Less than $10,000 | 80 | 4.0% |
| $10,000 to $14,999 | 32 | 1.6% |
| $15,000 to $24,999 | 152 | 7.6% |
| $25,000 to $34,999 | 173 | 8.7% |
| $35,000 to $49,999 | 329 | 16.5% |
| $50,000 to $74,999 | 395 | 19.8% |
| $75,000 to $99,999 | 379 | 19.0% |
| $100,000 to $149,999 | 299 | 15.0% |
| $150,000 to $199,999 | 128 | 6.4% |
| $200,000+ | 30 | 1.5% |
Family Income by Famaliy Size in Orland
5-person families (250 | 12.5%) account for the highest median family income in Orland with $90,813 per family, while 2-person families (694 | 34.8%) have the highest median income of $33,588 per family member.
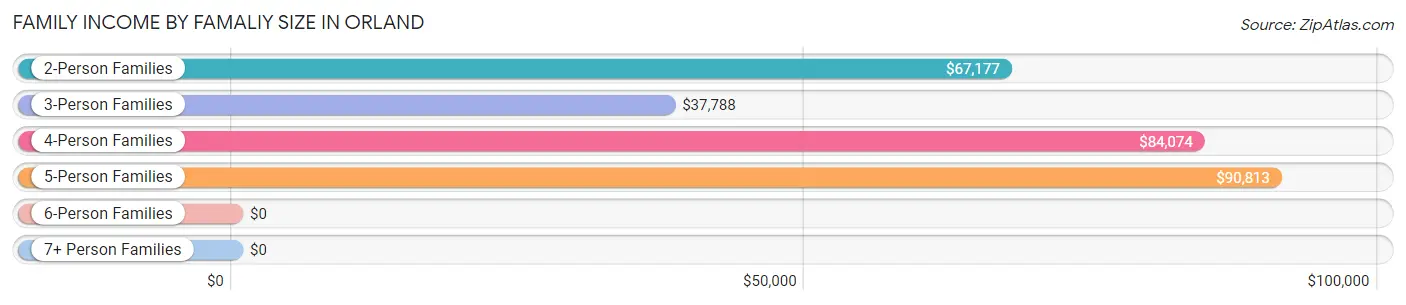
| Income Bracket | # Families | Median Income |
| 2-Person Families | 694 (34.8%) | $67,177 |
| 3-Person Families | 583 (29.2%) | $37,788 |
| 4-Person Families | 340 (17.1%) | $84,074 |
| 5-Person Families | 250 (12.5%) | $90,813 |
| 6-Person Families | 76 (3.8%) | $0 |
| 7+ Person Families | 51 (2.6%) | $0 |
| Total | 1,994 (100.0%) | $64,261 |
Family Income by Number of Earners in Orland
The median family income in Orland is $64,261, with families comprising 3+ earners (231) having the highest median family income of $127,435, while families with 1 earner (794) have the lowest median family income of $40,065, accounting for 11.6% and 39.8% of families, respectively.
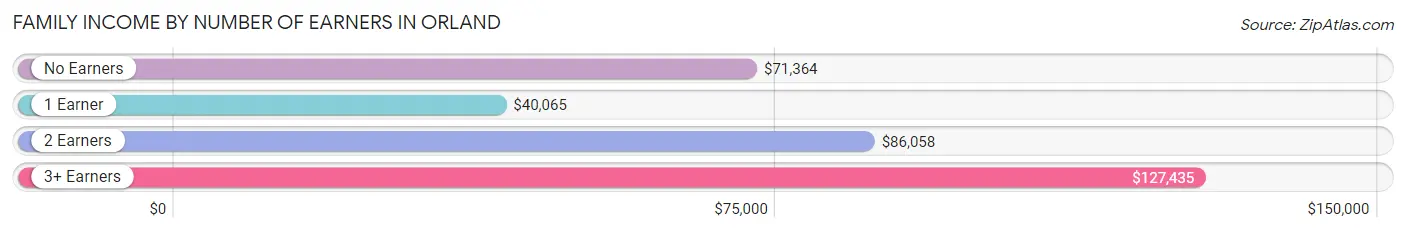
| Number of Earners | # Families | Median Income |
| No Earners | 250 (12.5%) | $71,364 |
| 1 Earner | 794 (39.8%) | $40,065 |
| 2 Earners | 719 (36.1%) | $86,058 |
| 3+ Earners | 231 (11.6%) | $127,435 |
| Total | 1,994 (100.0%) | $64,261 |
Household Income in Orland
Household Income Brackets in Orland
With 733 households falling in the category, the $50,000 to $74,999 income range is the most frequent in Orland, accounting for 26.3% of all households. In contrast, only 28 households (1.0%) fall into the $200,000+ income bracket, making it the least populous group.
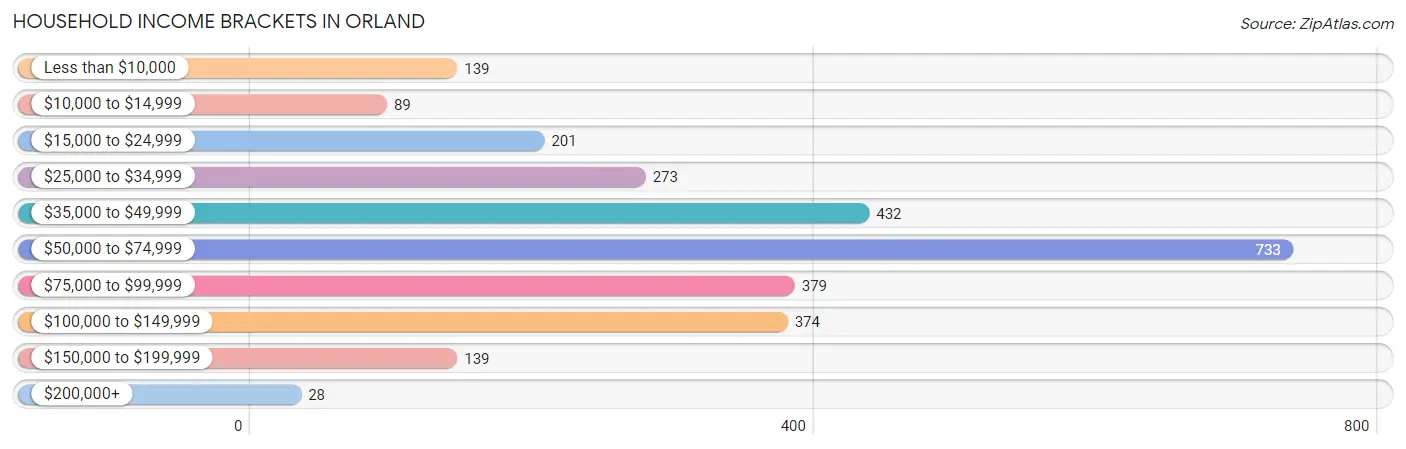
| Income Bracket | # Households | % Households |
| Less than $10,000 | 139 | 5.0% |
| $10,000 to $14,999 | 89 | 3.2% |
| $15,000 to $24,999 | 201 | 7.2% |
| $25,000 to $34,999 | 273 | 9.8% |
| $35,000 to $49,999 | 432 | 15.5% |
| $50,000 to $74,999 | 733 | 26.3% |
| $75,000 to $99,999 | 379 | 13.6% |
| $100,000 to $149,999 | 374 | 13.4% |
| $150,000 to $199,999 | 139 | 5.0% |
| $200,000+ | 28 | 1.0% |
Household Income by Householder Age in Orland
The median household income in Orland is $61,587, with the highest median household income of $65,771 found in the 25 to 44 years age bracket for the primary householder. A total of 956 households (34.3%) fall into this category. Meanwhile, the 15 to 24 years age bracket for the primary householder has the lowest median household income of $0, with 45 households (1.6%) in this group.
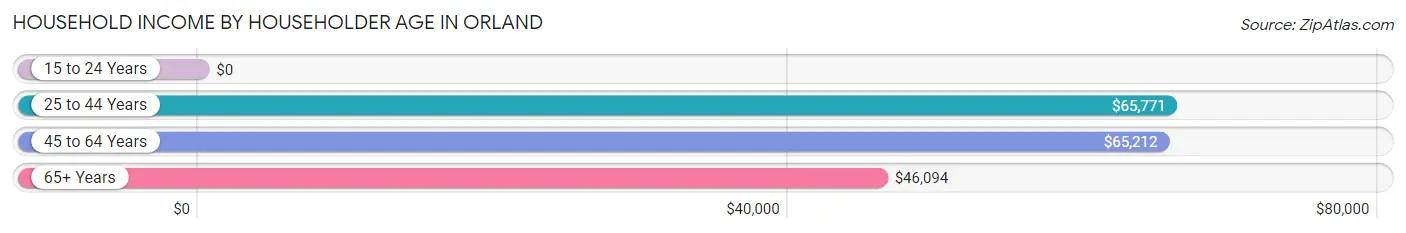
| Income Bracket | # Households | Median Income |
| 15 to 24 Years | 45 (1.6%) | $0 |
| 25 to 44 Years | 956 (34.3%) | $65,771 |
| 45 to 64 Years | 1,020 (36.6%) | $65,212 |
| 65+ Years | 767 (27.5%) | $46,094 |
| Total | 2,788 (100.0%) | $61,587 |
Poverty in Orland
Income Below Poverty by Sex and Age in Orland
With 9.6% poverty level for males and 20.2% for females among the residents of Orland, 16 and 17 year old males and 12 to 14 year old females are the most vulnerable to poverty, with 51 males (76.1%) and 178 females (54.3%) in their respective age groups living below the poverty level.
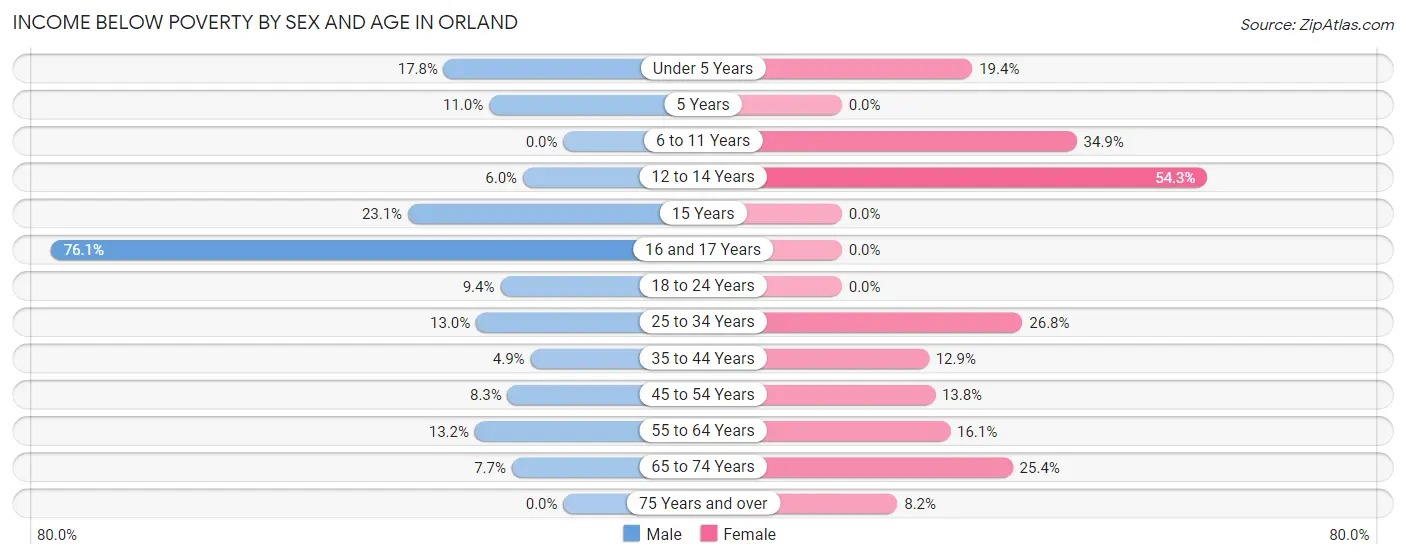
| Age Bracket | Male | Female |
| Under 5 Years | 71 (17.7%) | 61 (19.4%) |
| 5 Years | 16 (11.0%) | 0 (0.0%) |
| 6 to 11 Years | 0 (0.0%) | 121 (34.9%) |
| 12 to 14 Years | 15 (6.0%) | 178 (54.3%) |
| 15 Years | 15 (23.1%) | 0 (0.0%) |
| 16 and 17 Years | 51 (76.1%) | 0 (0.0%) |
| 18 to 24 Years | 19 (9.4%) | 0 (0.0%) |
| 25 to 34 Years | 75 (13.0%) | 137 (26.8%) |
| 35 to 44 Years | 25 (4.9%) | 71 (12.9%) |
| 45 to 54 Years | 40 (8.3%) | 65 (13.8%) |
| 55 to 64 Years | 38 (13.2%) | 72 (16.1%) |
| 65 to 74 Years | 25 (7.6%) | 104 (25.4%) |
| 75 Years and over | 0 (0.0%) | 22 (8.2%) |
| Total | 390 (9.6%) | 831 (20.2%) |
Income Above Poverty by Sex and Age in Orland
According to the poverty statistics in Orland, males aged 6 to 11 years and females aged 15 years are the age groups that are most secure financially, with 100.0% of males and 100.0% of females in these age groups living above the poverty line.
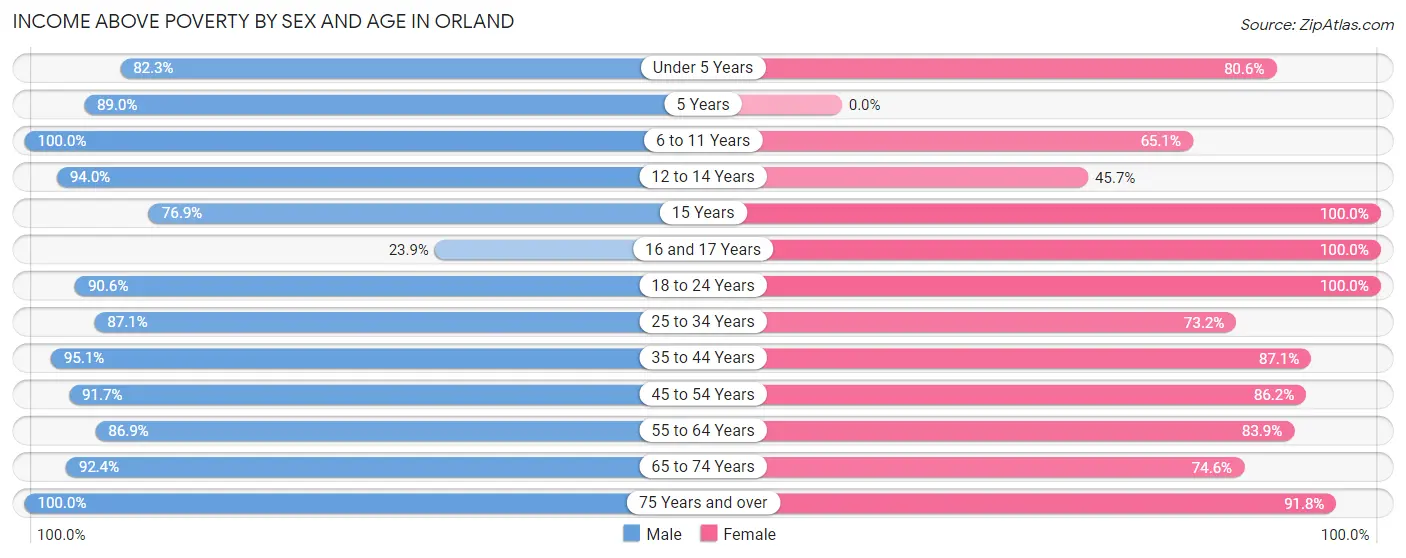
| Age Bracket | Male | Female |
| Under 5 Years | 329 (82.3%) | 254 (80.6%) |
| 5 Years | 129 (89.0%) | 0 (0.0%) |
| 6 to 11 Years | 529 (100.0%) | 226 (65.1%) |
| 12 to 14 Years | 235 (94.0%) | 150 (45.7%) |
| 15 Years | 50 (76.9%) | 78 (100.0%) |
| 16 and 17 Years | 16 (23.9%) | 139 (100.0%) |
| 18 to 24 Years | 184 (90.6%) | 249 (100.0%) |
| 25 to 34 Years | 504 (87.1%) | 374 (73.2%) |
| 35 to 44 Years | 486 (95.1%) | 479 (87.1%) |
| 45 to 54 Years | 443 (91.7%) | 405 (86.2%) |
| 55 to 64 Years | 251 (86.9%) | 376 (83.9%) |
| 65 to 74 Years | 302 (92.3%) | 306 (74.6%) |
| 75 Years and over | 223 (100.0%) | 245 (91.8%) |
| Total | 3,681 (90.4%) | 3,281 (79.8%) |
Income Below Poverty Among Married-Couple Families in Orland
The poverty statistics for married-couple families in Orland show that 4.4% or 61 of the total 1,385 families live below the poverty line. Families with 1 or 2 children have the highest poverty rate of 7.1%, comprising of 40 families. On the other hand, families with no children have the lowest poverty rate of 1.7%, which includes 11 families.
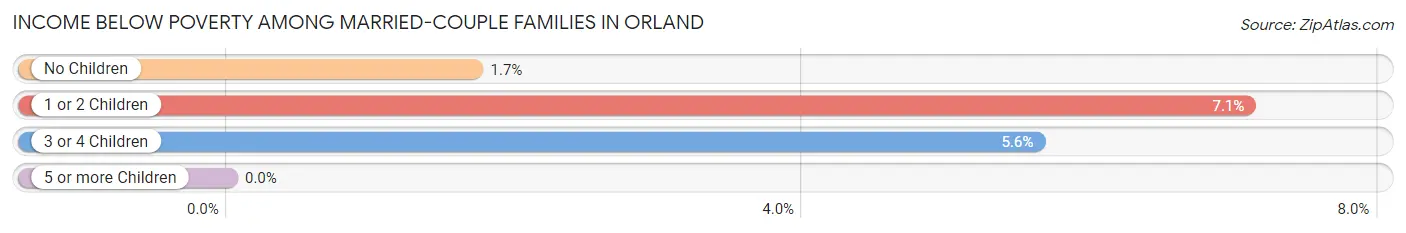
| Children | Above Poverty | Below Poverty |
| No Children | 632 (98.3%) | 11 (1.7%) |
| 1 or 2 Children | 524 (92.9%) | 40 (7.1%) |
| 3 or 4 Children | 168 (94.4%) | 10 (5.6%) |
| 5 or more Children | 0 (0.0%) | 0 (0.0%) |
| Total | 1,324 (95.6%) | 61 (4.4%) |
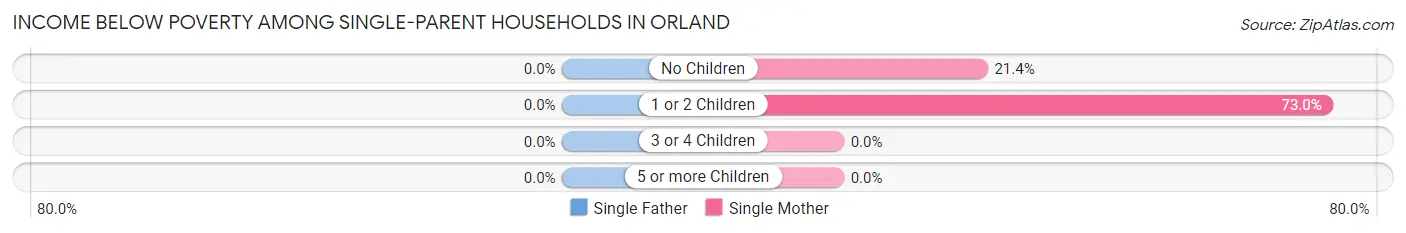
Income Below Poverty Among Single-Parent Households in Orland
| Children | Single Father | Single Mother |
| No Children | 0 (0.0%) | 12 (21.4%) |
| 1 or 2 Children | 0 (0.0%) | 200 (73.0%) |
| 3 or 4 Children | 0 (0.0%) | 0 (0.0%) |
| 5 or more Children | 0 (0.0%) | 0 (0.0%) |
| Total | 0 (0.0%) | 212 (54.9%) |
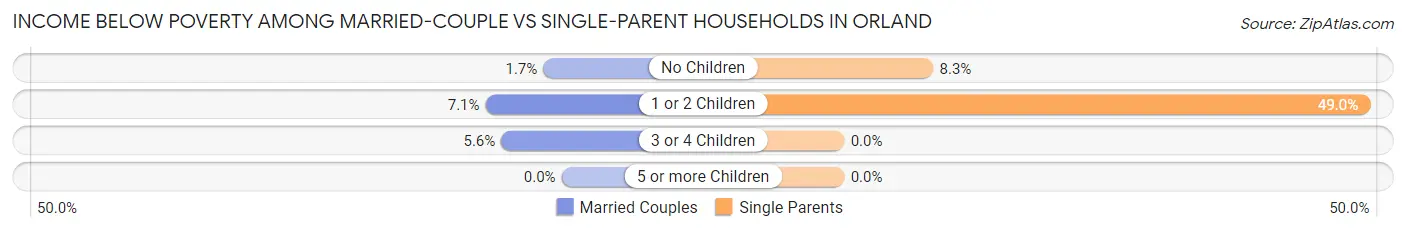
Income Below Poverty Among Married-Couple vs Single-Parent Households in Orland
The poverty data for Orland shows that 61 of the married-couple family households (4.4%) and 212 of the single-parent households (34.8%) are living below the poverty level. Within the married-couple family households, those with 1 or 2 children have the highest poverty rate, with 40 households (7.1%) falling below the poverty line. Among the single-parent households, those with 1 or 2 children have the highest poverty rate, with 200 household (49.0%) living below poverty.
| Children | Married-Couple Families | Single-Parent Households |
| No Children | 11 (1.7%) | 12 (8.3%) |
| 1 or 2 Children | 40 (7.1%) | 200 (49.0%) |
| 3 or 4 Children | 10 (5.6%) | 0 (0.0%) |
| 5 or more Children | 0 (0.0%) | 0 (0.0%) |
| Total | 61 (4.4%) | 212 (34.8%) |
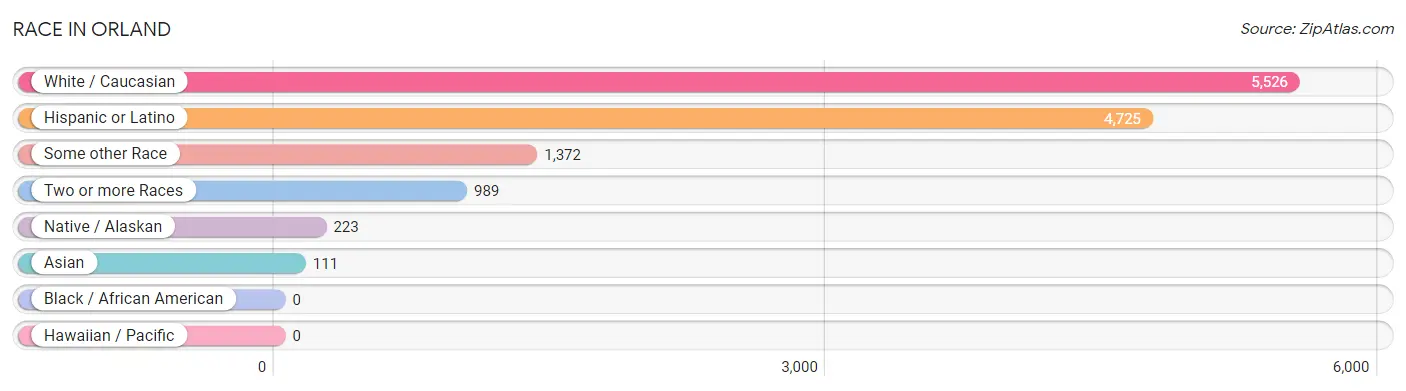
Race in Orland
The most populous races in Orland are White / Caucasian (5,526 | 67.2%), Hispanic or Latino (4,725 | 57.5%), and Some other Race (1,372 | 16.7%).
| Race | # Population | % Population |
| Asian | 111 | 1.3% |
| Black / African American | 0 | 0.0% |
| Hawaiian / Pacific | 0 | 0.0% |
| Hispanic or Latino | 4,725 | 57.5% |
| Native / Alaskan | 223 | 2.7% |
| White / Caucasian | 5,526 | 67.2% |
| Two or more Races | 989 | 12.0% |
| Some other Race | 1,372 | 16.7% |
| Total | 8,221 | 100.0% |
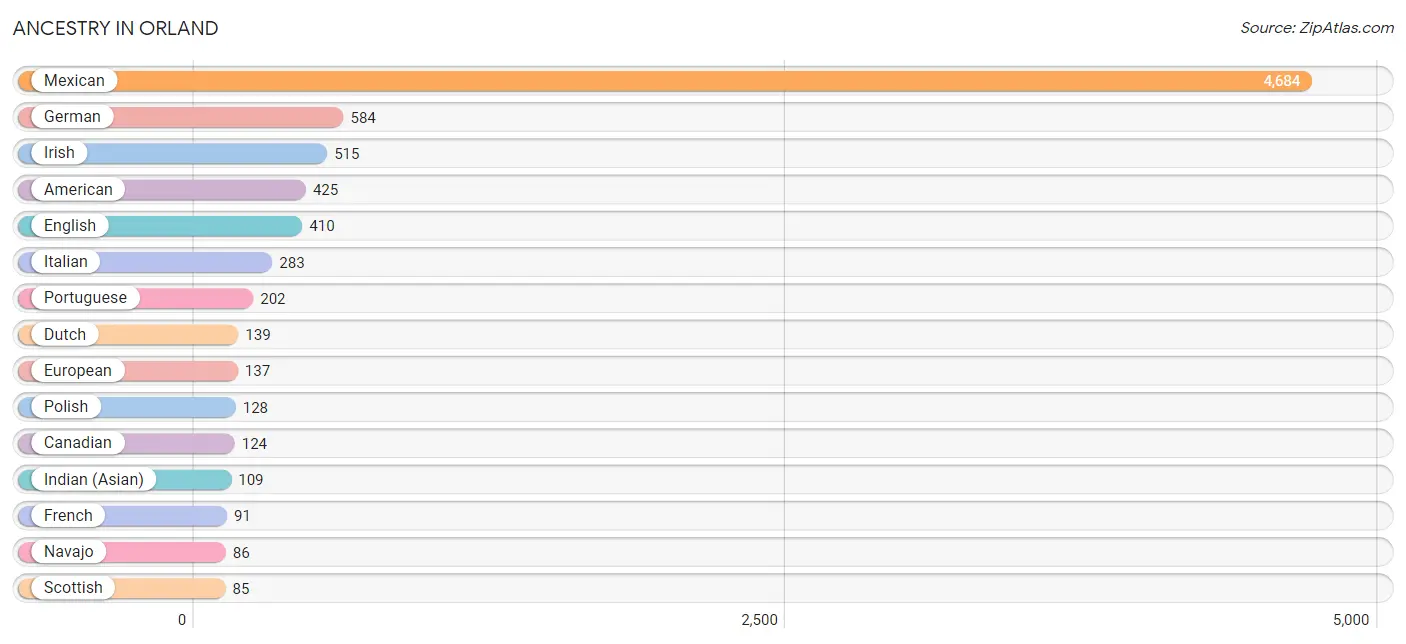
Ancestry in Orland
The most populous ancestries reported in Orland are Mexican (4,684 | 57.0%), German (584 | 7.1%), Irish (515 | 6.3%), American (425 | 5.2%), and English (410 | 5.0%), together accounting for 80.5% of all Orland residents.
| Ancestry | # Population | % Population |
| American | 425 | 5.2% |
| Arab | 9 | 0.1% |
| Belgian | 9 | 0.1% |
| British | 7 | 0.1% |
| Canadian | 124 | 1.5% |
| Central American Indian | 15 | 0.2% |
| Cherokee | 17 | 0.2% |
| Choctaw | 36 | 0.4% |
| Colombian | 33 | 0.4% |
| Czech | 10 | 0.1% |
| Dutch | 139 | 1.7% |
| English | 410 | 5.0% |
| European | 137 | 1.7% |
| French | 91 | 1.1% |
| German | 584 | 7.1% |
| Hopi | 8 | 0.1% |
| Hungarian | 37 | 0.4% |
| Indian (Asian) | 109 | 1.3% |
| Irish | 515 | 6.3% |
| Italian | 283 | 3.4% |
| Korean | 33 | 0.4% |
| Lebanese | 9 | 0.1% |
| Mexican | 4,684 | 57.0% |
| Mexican American Indian | 82 | 1.0% |
| Native Hawaiian | 19 | 0.2% |
| Navajo | 86 | 1.1% |
| Norwegian | 27 | 0.3% |
| Pakistani | 2 | 0.0% |
| Polish | 128 | 1.6% |
| Portuguese | 202 | 2.5% |
| Scandinavian | 17 | 0.2% |
| Scotch-Irish | 57 | 0.7% |
| Scottish | 85 | 1.0% |
| South American | 33 | 0.4% |
| Spanish | 8 | 0.1% |
| Swedish | 40 | 0.5% |
| Welsh | 32 | 0.4% | View All 37 Rows |
Immigrants in Orland
The most numerous immigrant groups reported in Orland came from Central America (1,497 | 18.2%), Latin America (1,497 | 18.2%), Mexico (1,488 | 18.1%), Asia (87 | 1.1%), and China (45 | 0.5%), together accounting for 56.1% of all Orland residents.
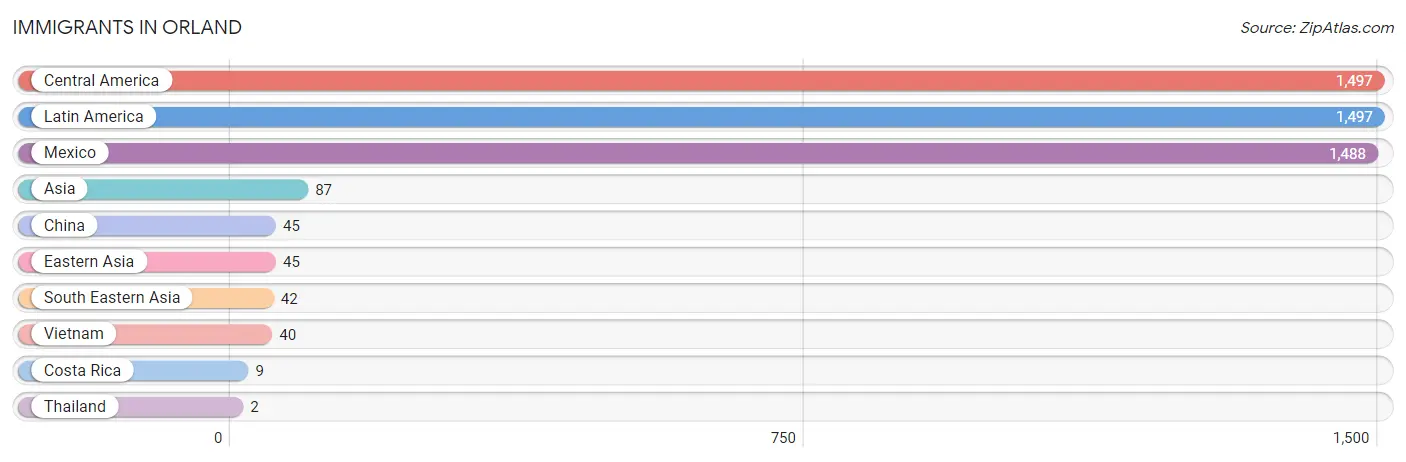
| Immigration Origin | # Population | % Population |
| Asia | 87 | 1.1% |
| Central America | 1,497 | 18.2% |
| China | 45 | 0.5% |
| Costa Rica | 9 | 0.1% |
| Eastern Asia | 45 | 0.5% |
| Latin America | 1,497 | 18.2% |
| Mexico | 1,488 | 18.1% |
| South Eastern Asia | 42 | 0.5% |
| Thailand | 2 | 0.0% |
| Vietnam | 40 | 0.5% | View All 10 Rows |
Sex and Age in Orland
Sex and Age in Orland
The most populous age groups in Orland are 5 to 9 Years (496 | 12.1%) for men and 10 to 14 Years (449 | 10.9%) for women.
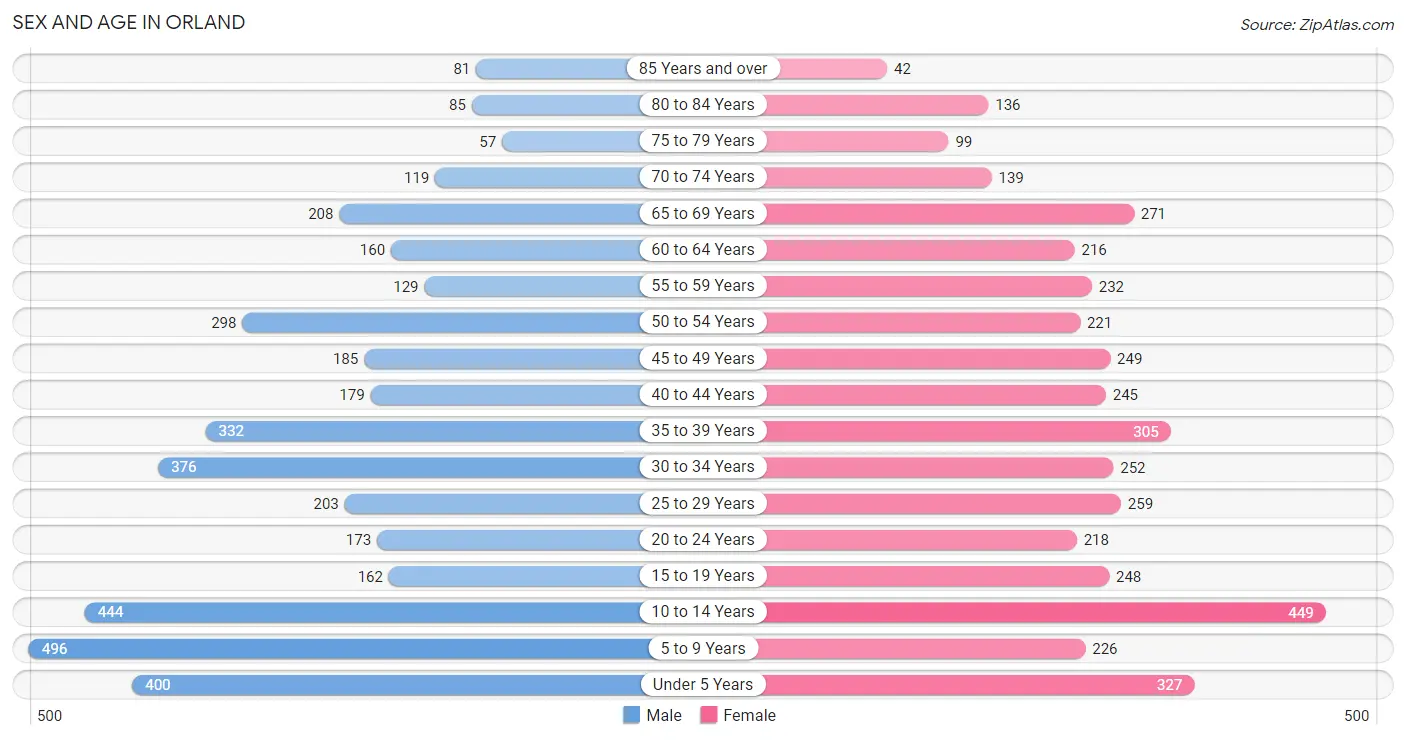
| Age Bracket | Male | Female |
| Under 5 Years | 400 (9.8%) | 327 (7.9%) |
| 5 to 9 Years | 496 (12.1%) | 226 (5.5%) |
| 10 to 14 Years | 444 (10.9%) | 449 (10.9%) |
| 15 to 19 Years | 162 (4.0%) | 248 (6.0%) |
| 20 to 24 Years | 173 (4.2%) | 218 (5.3%) |
| 25 to 29 Years | 203 (5.0%) | 259 (6.3%) |
| 30 to 34 Years | 376 (9.2%) | 252 (6.1%) |
| 35 to 39 Years | 332 (8.1%) | 305 (7.4%) |
| 40 to 44 Years | 179 (4.4%) | 245 (5.9%) |
| 45 to 49 Years | 185 (4.5%) | 249 (6.0%) |
| 50 to 54 Years | 298 (7.3%) | 221 (5.3%) |
| 55 to 59 Years | 129 (3.2%) | 232 (5.6%) |
| 60 to 64 Years | 160 (3.9%) | 216 (5.2%) |
| 65 to 69 Years | 208 (5.1%) | 271 (6.6%) |
| 70 to 74 Years | 119 (2.9%) | 139 (3.4%) |
| 75 to 79 Years | 57 (1.4%) | 99 (2.4%) |
| 80 to 84 Years | 85 (2.1%) | 136 (3.3%) |
| 85 Years and over | 81 (2.0%) | 42 (1.0%) |
| Total | 4,087 (100.0%) | 4,134 (100.0%) |
Families and Households in Orland
Median Family Size in Orland
The median family size in Orland is 3.57 persons per family, with married-couple families (1,385 | 69.5%) accounting for the largest median family size of 3.84 persons per family. On the other hand, single male/father families (223 | 11.2%) represent the smallest median family size with 2.76 persons per family.
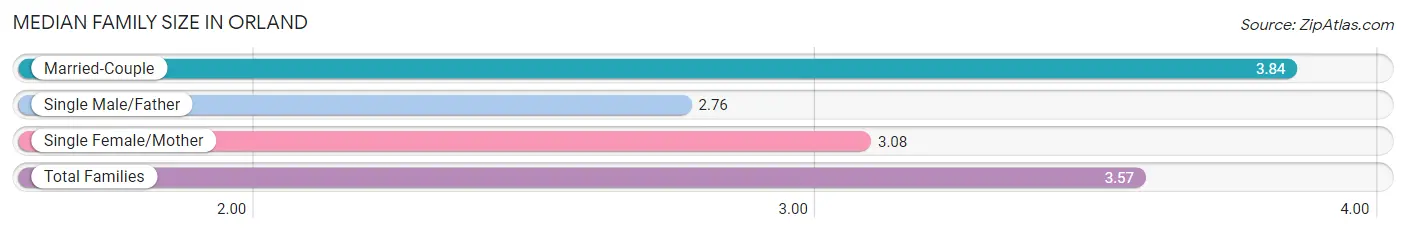
| Family Type | # Families | Family Size |
| Married-Couple | 1,385 (69.5%) | 3.84 |
| Single Male/Father | 223 (11.2%) | 2.76 |
| Single Female/Mother | 386 (19.4%) | 3.08 |
| Total Families | 1,994 (100.0%) | 3.57 |
Median Household Size in Orland
The median household size in Orland is 2.94 persons per household, with married-couple households (1,385 | 49.7%) accounting for the largest median household size of 3.86 persons per household. non-family households (794 | 28.5%) represent the smallest median household size with 1.19 persons per household.
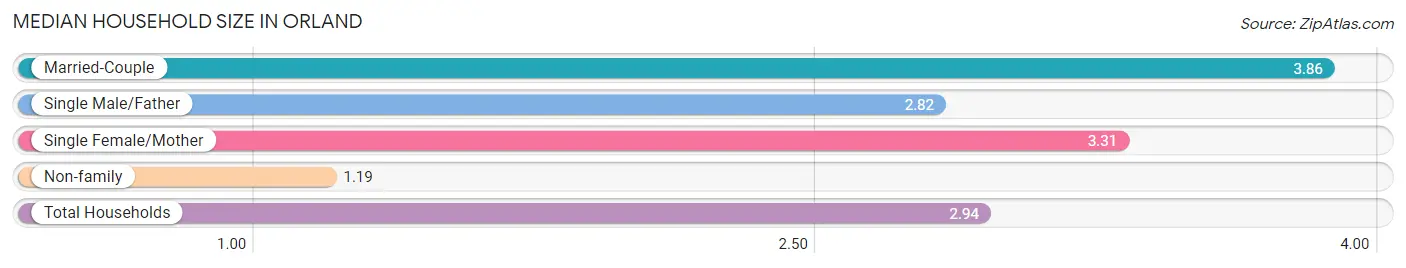
| Household Type | # Households | Household Size |
| Married-Couple | 1,385 (49.7%) | 3.86 |
| Single Male/Father | 223 (8.0%) | 2.82 |
| Single Female/Mother | 386 (13.9%) | 3.31 |
| Non-family | 794 (28.5%) | 1.19 |
| Total Households | 2,788 (100.0%) | 2.94 |
Household Size by Marriage Status in Orland
Out of a total of 2,788 households in Orland, 1,994 (71.5%) are family households, while 794 (28.5%) are nonfamily households. The most numerous type of family households are 2-person households, comprising 694, and the most common type of nonfamily households are 1-person households, comprising 640.
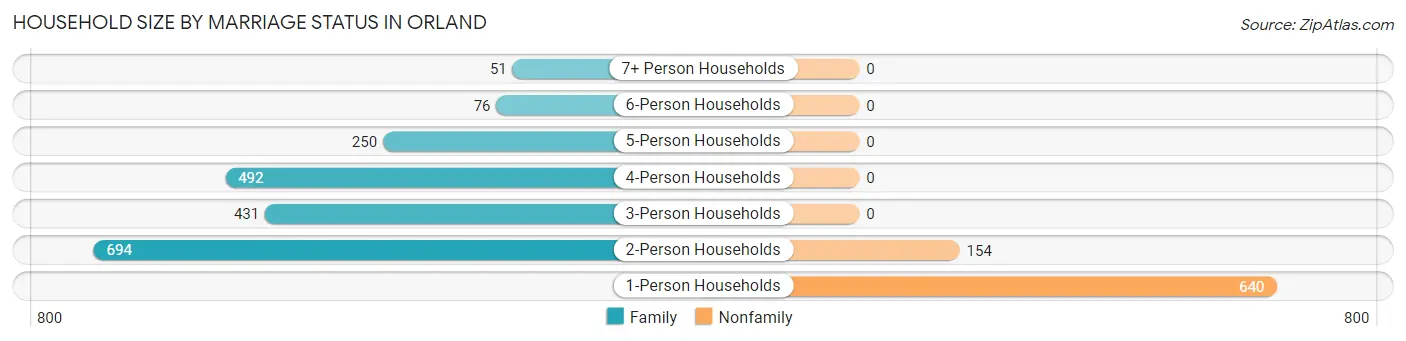
| Household Size | Family Households | Nonfamily Households |
| 1-Person Households | - | 640 (23.0%) |
| 2-Person Households | 694 (24.9%) | 154 (5.5%) |
| 3-Person Households | 431 (15.5%) | 0 (0.0%) |
| 4-Person Households | 492 (17.6%) | 0 (0.0%) |
| 5-Person Households | 250 (9.0%) | 0 (0.0%) |
| 6-Person Households | 76 (2.7%) | 0 (0.0%) |
| 7+ Person Households | 51 (1.8%) | 0 (0.0%) |
| Total | 1,994 (71.5%) | 794 (28.5%) |
Female Fertility in Orland
Fertility by Age in Orland
Average fertility rate in Orland is 74.0 births per 1,000 women. Women in the age bracket of 15 to 19 years have the highest fertility rate with 210.0 births per 1,000 women. Women in the age bracket of 20 to 34 years acount for 62.9% of all women with births.
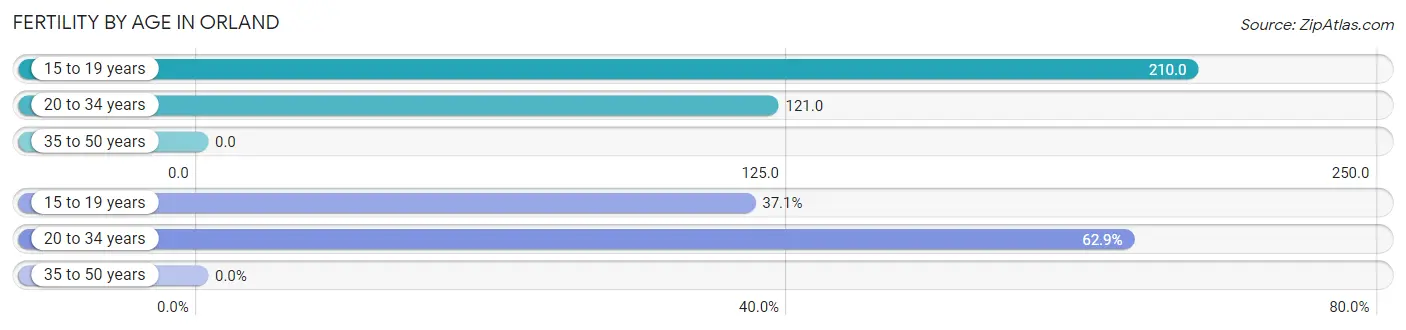
| Age Bracket | Women with Births | Births / 1,000 Women |
| 15 to 19 years | 52 (37.1%) | 210.0 |
| 20 to 34 years | 88 (62.9%) | 121.0 |
| 35 to 50 years | 0 (0.0%) | 0.0 |
| Total | 140 (100.0%) | 74.0 |
Fertility by Age by Marriage Status in Orland
62.9% of women with births (140) in Orland are married. The highest percentage of unmarried women with births falls into 15 to 19 years age bracket with 100.0% of them unmarried at the time of birth, while the lowest percentage of unmarried women with births belong to 20 to 34 years age bracket with 0.0% of them unmarried.
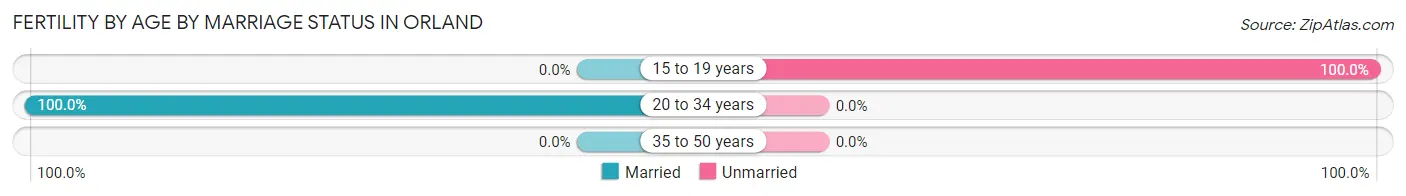
| Age Bracket | Married | Unmarried |
| 15 to 19 years | 0 (0.0%) | 52 (100.0%) |
| 20 to 34 years | 88 (100.0%) | 0 (0.0%) |
| 35 to 50 years | 0 (0.0%) | 0 (0.0%) |
| Total | 88 (62.9%) | 52 (37.1%) |
Fertility by Education in Orland
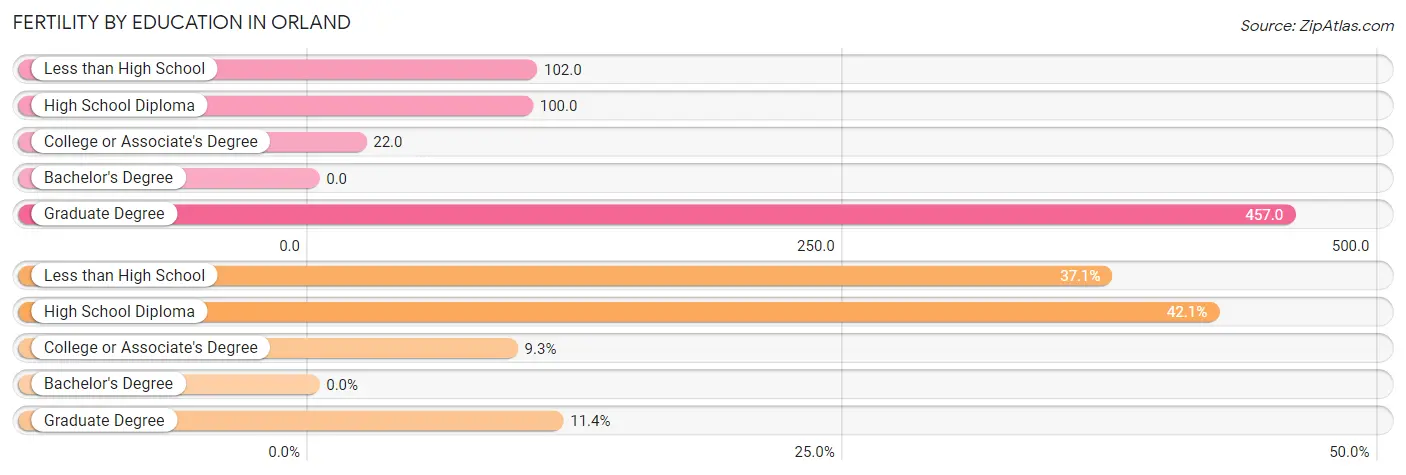
| Educational Attainment | Women with Births | Births / 1,000 Women |
| Less than High School | 52 (37.1%) | 102.0 |
| High School Diploma | 59 (42.1%) | 100.0 |
| College or Associate's Degree | 13 (9.3%) | 22.0 |
| Bachelor's Degree | 0 (0.0%) | 0.0 |
| Graduate Degree | 16 (11.4%) | 457.0 |
| Total | 140 (100.0%) | 74.0 |
Fertility by Education by Marriage Status in Orland
37.1% of women with births in Orland are unmarried. Women with the educational attainment of high school diploma are most likely to be married with 100.0% of them married at childbirth, while women with the educational attainment of less than high school are least likely to be married with 100.0% of them unmarried at childbirth.
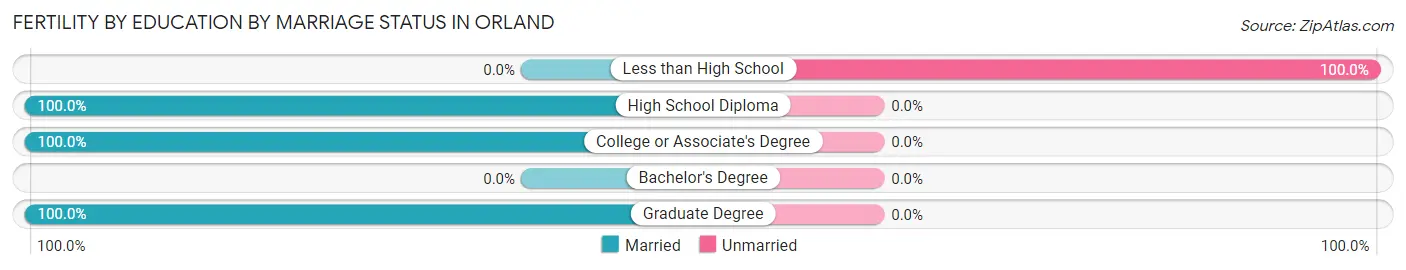
| Educational Attainment | Married | Unmarried |
| Less than High School | 0 (0.0%) | 52 (100.0%) |
| High School Diploma | 59 (100.0%) | 0 (0.0%) |
| College or Associate's Degree | 13 (100.0%) | 0 (0.0%) |
| Bachelor's Degree | 0 (0.0%) | 0 (0.0%) |
| Graduate Degree | 16 (100.0%) | 0 (0.0%) |
| Total | 88 (62.9%) | 52 (37.1%) |
Employment Characteristics in Orland
Employment by Class of Employer in Orland
Among the 3,245 employed individuals in Orland, private company employees (2,258 | 69.6%), local government employees (458 | 14.1%), and self-employed (not incorporated) (237 | 7.3%) make up the most common classes of employment.
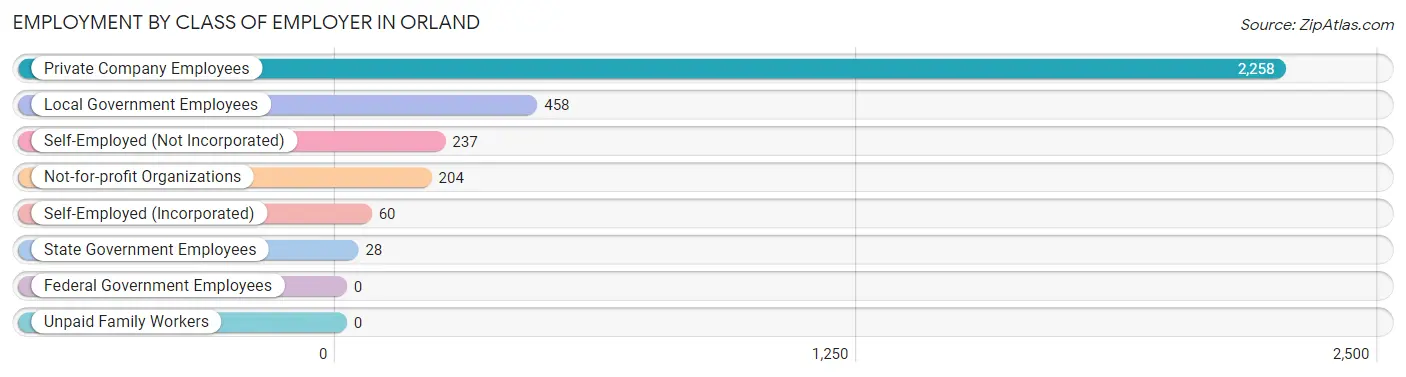
| Employer Class | # Employees | % Employees |
| Private Company Employees | 2,258 | 69.6% |
| Self-Employed (Incorporated) | 60 | 1.8% |
| Self-Employed (Not Incorporated) | 237 | 7.3% |
| Not-for-profit Organizations | 204 | 6.3% |
| Local Government Employees | 458 | 14.1% |
| State Government Employees | 28 | 0.9% |
| Federal Government Employees | 0 | 0.0% |
| Unpaid Family Workers | 0 | 0.0% |
| Total | 3,245 | 100.0% |
Employment Status by Age in Orland
According to the labor force statistics for Orland, out of the total population over 16 years of age (5,736), 63.4% or 3,637 individuals are in the labor force, with 7.2% or 262 of them unemployed. The age group with the highest labor force participation rate is 30 to 34 years, with 90.0% or 565 individuals in the labor force. Within the labor force, the 16 to 19 years age range has the highest percentage of unemployed individuals, with 100.0% or 81 of them being unemployed.
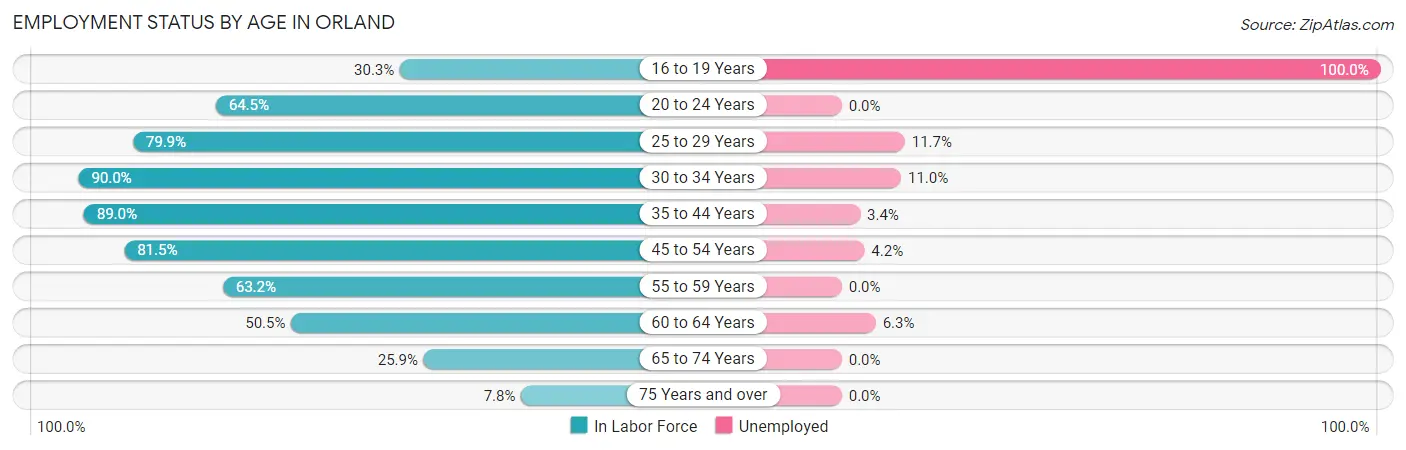
| Age Bracket | In Labor Force | Unemployed |
| 16 to 19 Years | 81 (30.3%) | 81 (100.0%) |
| 20 to 24 Years | 252 (64.5%) | 0 (0.0%) |
| 25 to 29 Years | 369 (79.9%) | 43 (11.7%) |
| 30 to 34 Years | 565 (90.0%) | 62 (11.0%) |
| 35 to 44 Years | 944 (89.0%) | 32 (3.4%) |
| 45 to 54 Years | 777 (81.5%) | 33 (4.2%) |
| 55 to 59 Years | 228 (63.2%) | 0 (0.0%) |
| 60 to 64 Years | 190 (50.5%) | 12 (6.3%) |
| 65 to 74 Years | 191 (25.9%) | 0 (0.0%) |
| 75 Years and over | 39 (7.8%) | 0 (0.0%) |
| Total | 3,637 (63.4%) | 262 (7.2%) |
Employment Status by Educational Attainment in Orland
According to labor force statistics for Orland, 80.0% of individuals (3,073) out of the total population between 25 and 64 years of age (3,841) are in the labor force, with 5.9% or 181 of them being unemployed. The group with the highest labor force participation rate are those with the educational attainment of bachelor's degree or higher, with 94.7% or 372 individuals in the labor force. Within the labor force, individuals with less than high school education have the highest percentage of unemployment, with 7.9% or 81 of them being unemployed.
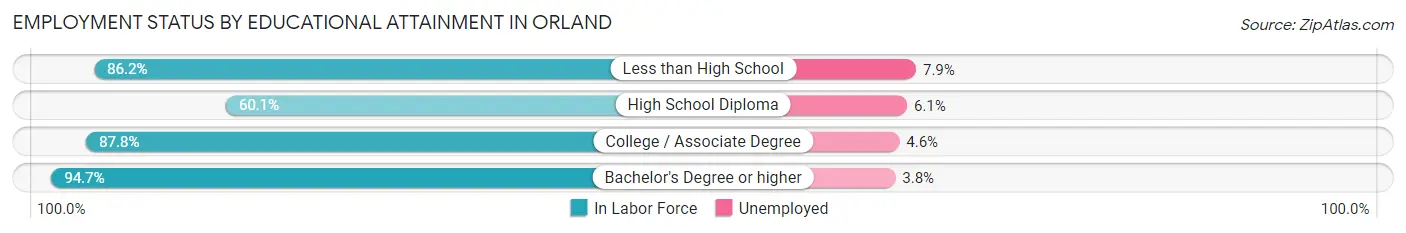
| Educational Attainment | In Labor Force | Unemployed |
| Less than High School | 1,019 (86.2%) | 93 (7.9%) |
| High School Diploma | 667 (60.1%) | 68 (6.1%) |
| College / Associate Degree | 1,015 (87.8%) | 53 (4.6%) |
| Bachelor's Degree or higher | 372 (94.7%) | 15 (3.8%) |
| Total | 3,073 (80.0%) | 227 (5.9%) |
Employment Occupations by Sex in Orland
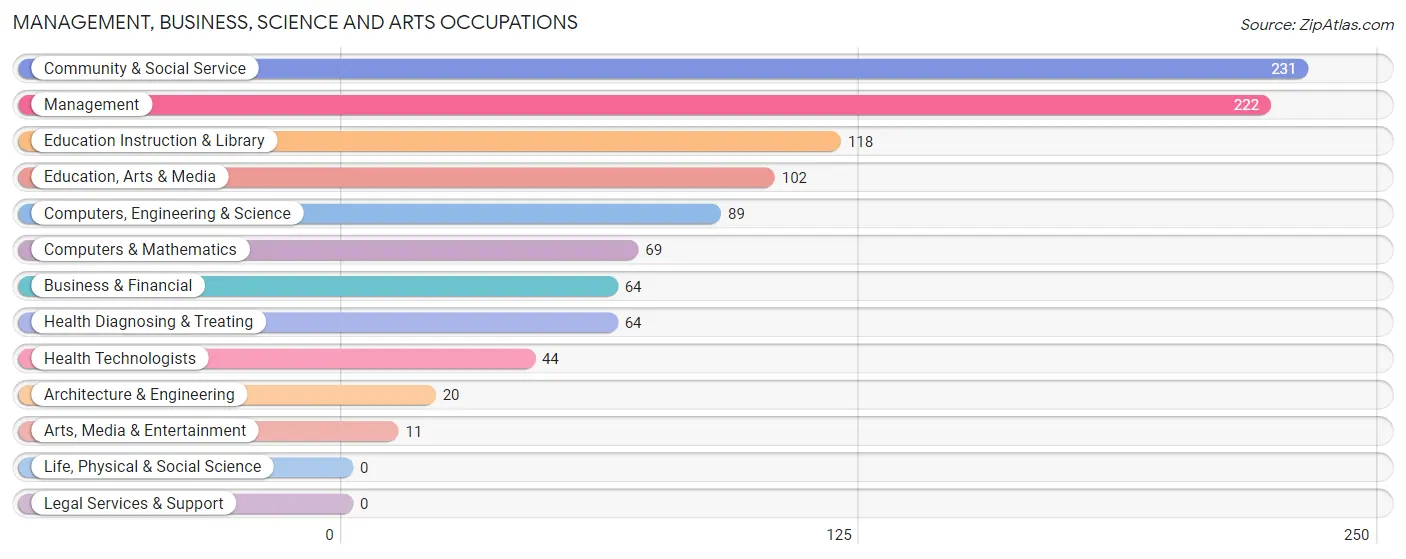
Management, Business, Science and Arts Occupations
The most common Management, Business, Science and Arts occupations in Orland are Community & Social Service (231 | 6.9%), Management (222 | 6.6%), Education Instruction & Library (118 | 3.5%), Education, Arts & Media (102 | 3.0%), and Computers, Engineering & Science (89 | 2.6%).
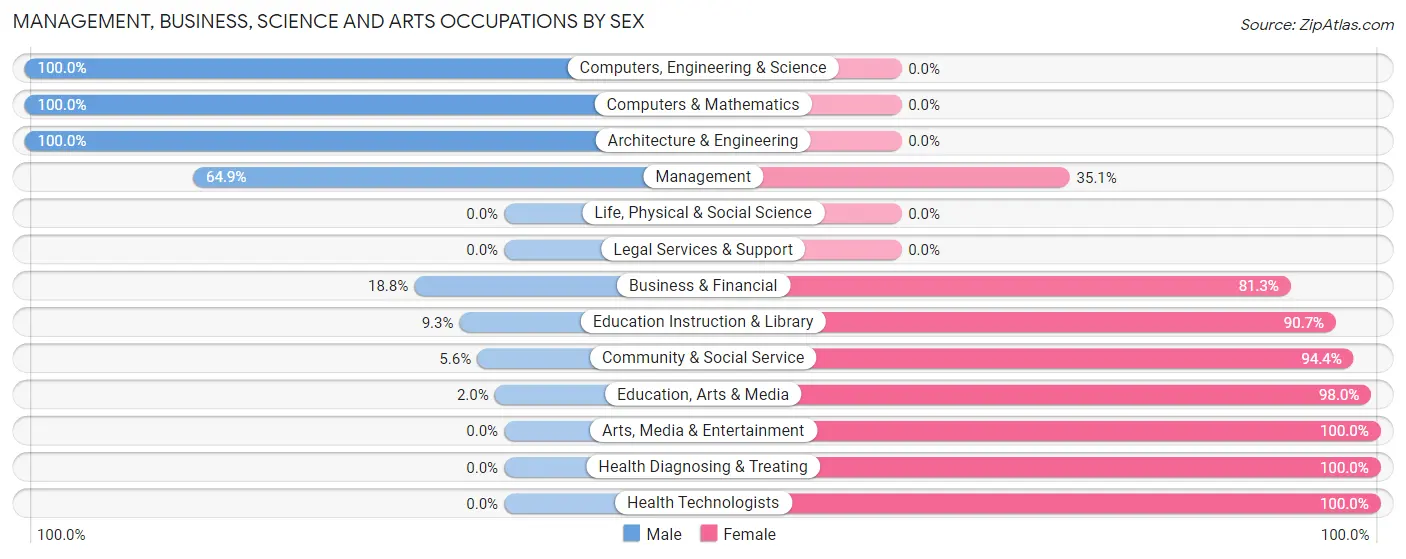
Management, Business, Science and Arts Occupations by Sex
Within the Management, Business, Science and Arts occupations in Orland, the most male-oriented occupations are Computers, Engineering & Science (100.0%), Computers & Mathematics (100.0%), and Architecture & Engineering (100.0%), while the most female-oriented occupations are Arts, Media & Entertainment (100.0%), Health Diagnosing & Treating (100.0%), and Health Technologists (100.0%).
| Occupation | Male | Female |
| Management | 144 (64.9%) | 78 (35.1%) |
| Business & Financial | 12 (18.8%) | 52 (81.2%) |
| Computers, Engineering & Science | 89 (100.0%) | 0 (0.0%) |
| Computers & Mathematics | 69 (100.0%) | 0 (0.0%) |
| Architecture & Engineering | 20 (100.0%) | 0 (0.0%) |
| Life, Physical & Social Science | 0 (0.0%) | 0 (0.0%) |
| Community & Social Service | 13 (5.6%) | 218 (94.4%) |
| Education, Arts & Media | 2 (2.0%) | 100 (98.0%) |
| Legal Services & Support | 0 (0.0%) | 0 (0.0%) |
| Education Instruction & Library | 11 (9.3%) | 107 (90.7%) |
| Arts, Media & Entertainment | 0 (0.0%) | 11 (100.0%) |
| Health Diagnosing & Treating | 0 (0.0%) | 64 (100.0%) |
| Health Technologists | 0 (0.0%) | 44 (100.0%) |
| Total (Category) | 258 (38.5%) | 412 (61.5%) |
| Total (Overall) | 1,819 (53.9%) | 1,554 (46.1%) |
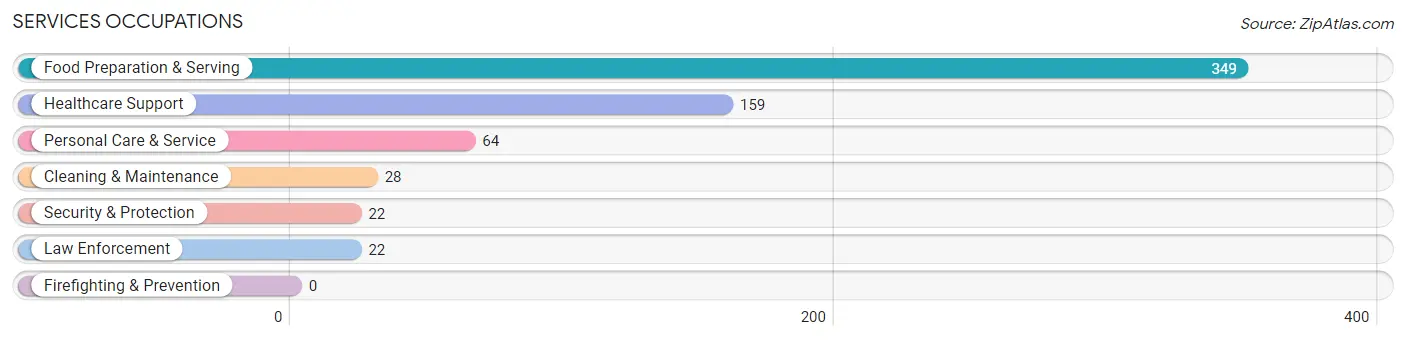
Services Occupations
The most common Services occupations in Orland are Food Preparation & Serving (349 | 10.3%), Healthcare Support (159 | 4.7%), Personal Care & Service (64 | 1.9%), Cleaning & Maintenance (28 | 0.8%), and Security & Protection (22 | 0.6%).
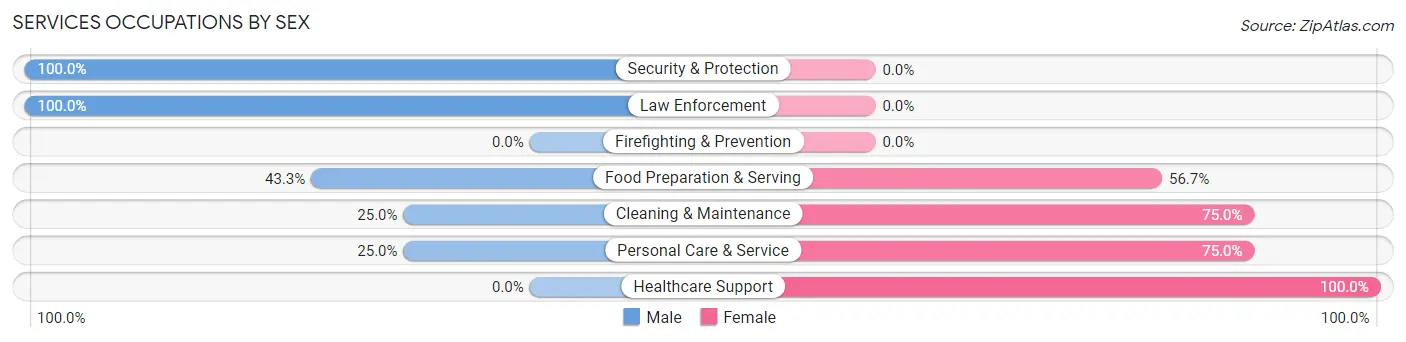
Services Occupations by Sex
Within the Services occupations in Orland, the most male-oriented occupations are Security & Protection (100.0%), Law Enforcement (100.0%), and Food Preparation & Serving (43.3%), while the most female-oriented occupations are Healthcare Support (100.0%), Cleaning & Maintenance (75.0%), and Personal Care & Service (75.0%).
| Occupation | Male | Female |
| Healthcare Support | 0 (0.0%) | 159 (100.0%) |
| Security & Protection | 22 (100.0%) | 0 (0.0%) |
| Firefighting & Prevention | 0 (0.0%) | 0 (0.0%) |
| Law Enforcement | 22 (100.0%) | 0 (0.0%) |
| Food Preparation & Serving | 151 (43.3%) | 198 (56.7%) |
| Cleaning & Maintenance | 7 (25.0%) | 21 (75.0%) |
| Personal Care & Service | 16 (25.0%) | 48 (75.0%) |
| Total (Category) | 196 (31.5%) | 426 (68.5%) |
| Total (Overall) | 1,819 (53.9%) | 1,554 (46.1%) |
Sales and Office Occupations
The most common Sales and Office occupations in Orland are Office & Administration (428 | 12.7%), and Sales & Related (337 | 10.0%).

Sales and Office Occupations by Sex
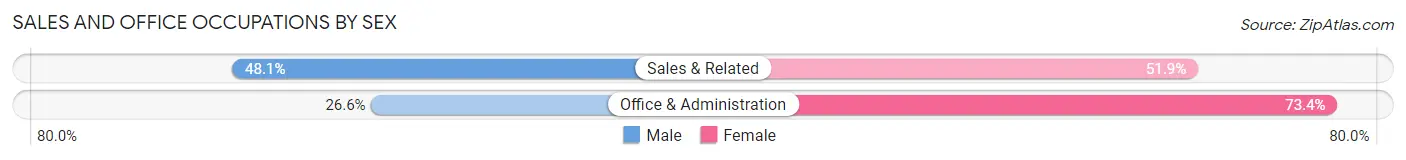
| Occupation | Male | Female |
| Sales & Related | 162 (48.1%) | 175 (51.9%) |
| Office & Administration | 114 (26.6%) | 314 (73.4%) |
| Total (Category) | 276 (36.1%) | 489 (63.9%) |
| Total (Overall) | 1,819 (53.9%) | 1,554 (46.1%) |
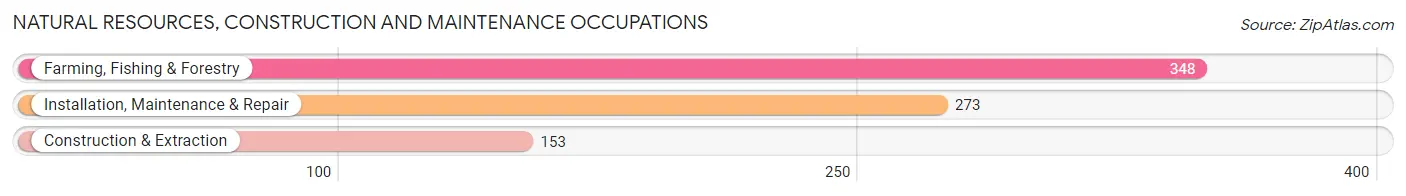
Natural Resources, Construction and Maintenance Occupations
The most common Natural Resources, Construction and Maintenance occupations in Orland are Farming, Fishing & Forestry (348 | 10.3%), Installation, Maintenance & Repair (273 | 8.1%), and Construction & Extraction (153 | 4.5%).
Natural Resources, Construction and Maintenance Occupations by Sex
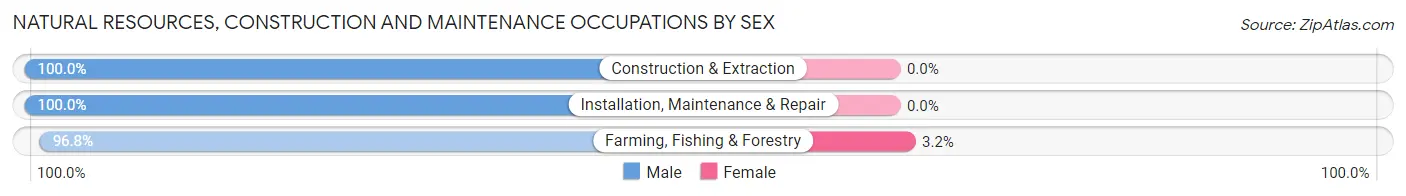
| Occupation | Male | Female |
| Farming, Fishing & Forestry | 337 (96.8%) | 11 (3.2%) |
| Construction & Extraction | 153 (100.0%) | 0 (0.0%) |
| Installation, Maintenance & Repair | 273 (100.0%) | 0 (0.0%) |
| Total (Category) | 763 (98.6%) | 11 (1.4%) |
| Total (Overall) | 1,819 (53.9%) | 1,554 (46.1%) |
Production, Transportation and Moving Occupations
The most common Production, Transportation and Moving occupations in Orland are Production (295 | 8.7%), Material Moving (156 | 4.6%), and Transportation (91 | 2.7%).
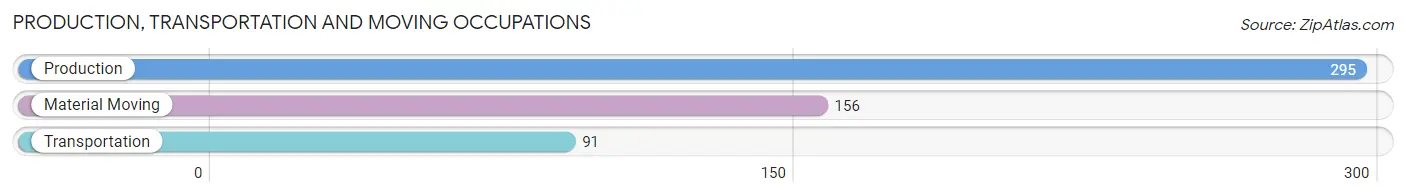
Production, Transportation and Moving Occupations by Sex
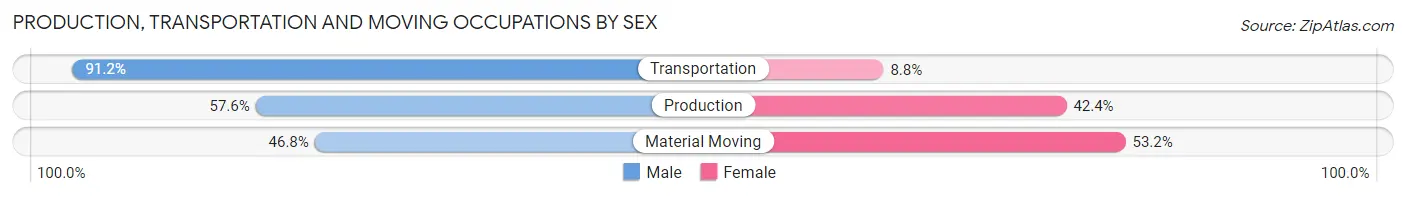
| Occupation | Male | Female |
| Production | 170 (57.6%) | 125 (42.4%) |
| Transportation | 83 (91.2%) | 8 (8.8%) |
| Material Moving | 73 (46.8%) | 83 (53.2%) |
| Total (Category) | 326 (60.2%) | 216 (39.9%) |
| Total (Overall) | 1,819 (53.9%) | 1,554 (46.1%) |
Employment Industries by Sex in Orland
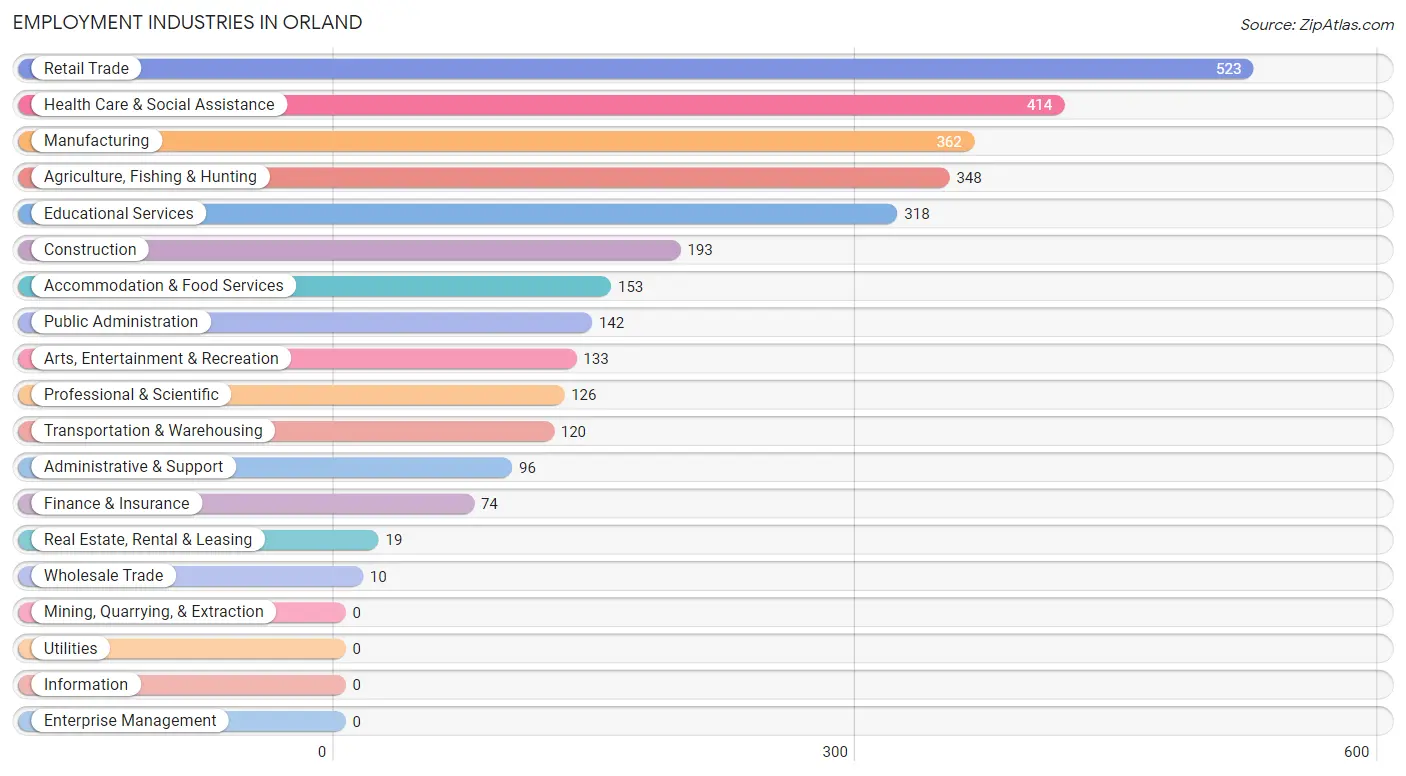
Employment Industries in Orland
The major employment industries in Orland include Retail Trade (523 | 15.5%), Health Care & Social Assistance (414 | 12.3%), Manufacturing (362 | 10.7%), Agriculture, Fishing & Hunting (348 | 10.3%), and Educational Services (318 | 9.4%).
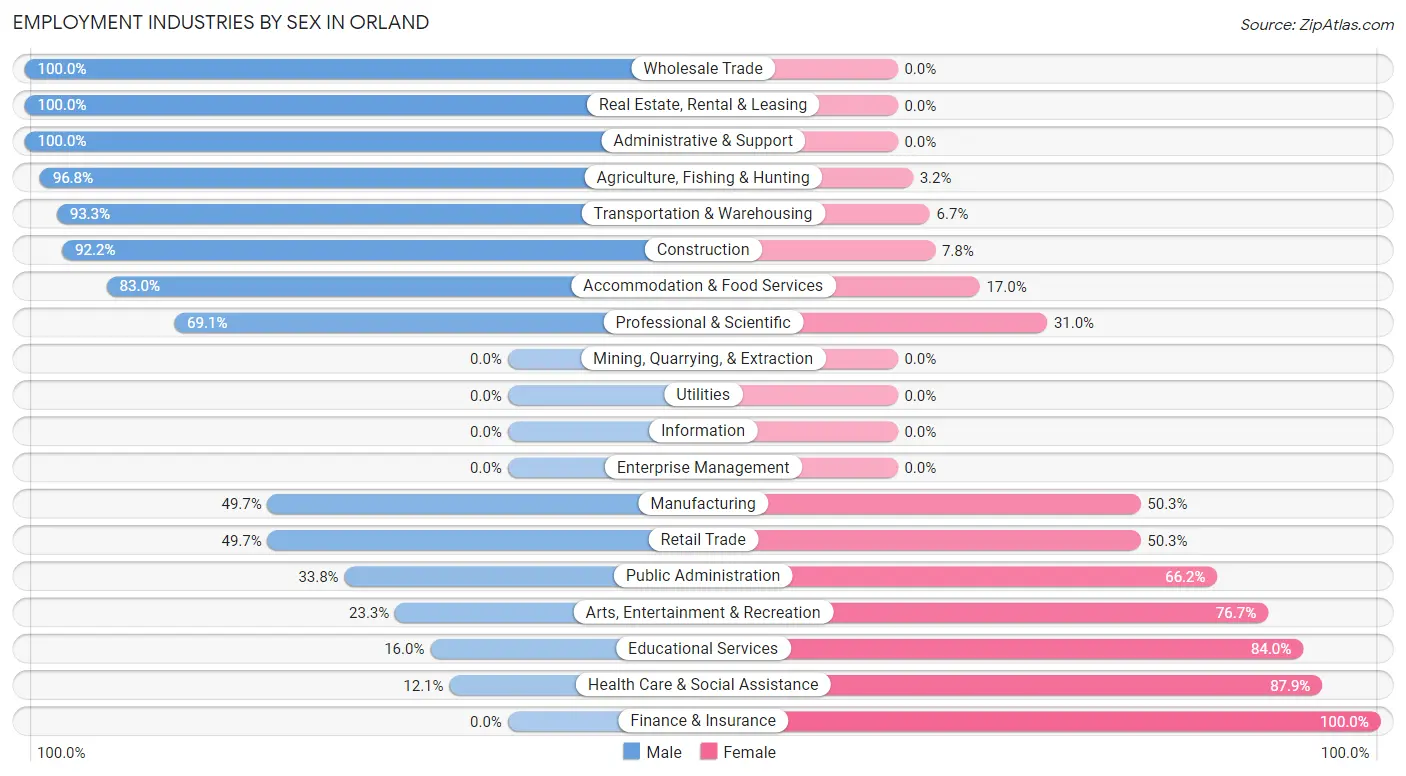
Employment Industries by Sex in Orland
The Orland industries that see more men than women are Wholesale Trade (100.0%), Real Estate, Rental & Leasing (100.0%), and Administrative & Support (100.0%), whereas the industries that tend to have a higher number of women are Finance & Insurance (100.0%), Health Care & Social Assistance (87.9%), and Educational Services (84.0%).
| Industry | Male | Female |
| Agriculture, Fishing & Hunting | 337 (96.8%) | 11 (3.2%) |
| Mining, Quarrying, & Extraction | 0 (0.0%) | 0 (0.0%) |
| Construction | 178 (92.2%) | 15 (7.8%) |
| Manufacturing | 180 (49.7%) | 182 (50.3%) |
| Wholesale Trade | 10 (100.0%) | 0 (0.0%) |
| Retail Trade | 260 (49.7%) | 263 (50.3%) |
| Transportation & Warehousing | 112 (93.3%) | 8 (6.7%) |
| Utilities | 0 (0.0%) | 0 (0.0%) |
| Information | 0 (0.0%) | 0 (0.0%) |
| Finance & Insurance | 0 (0.0%) | 74 (100.0%) |
| Real Estate, Rental & Leasing | 19 (100.0%) | 0 (0.0%) |
| Professional & Scientific | 87 (69.1%) | 39 (30.9%) |
| Enterprise Management | 0 (0.0%) | 0 (0.0%) |
| Administrative & Support | 96 (100.0%) | 0 (0.0%) |
| Educational Services | 51 (16.0%) | 267 (84.0%) |
| Health Care & Social Assistance | 50 (12.1%) | 364 (87.9%) |
| Arts, Entertainment & Recreation | 31 (23.3%) | 102 (76.7%) |
| Accommodation & Food Services | 127 (83.0%) | 26 (17.0%) |
| Public Administration | 48 (33.8%) | 94 (66.2%) |
| Total | 1,819 (53.9%) | 1,554 (46.1%) |
Education in Orland
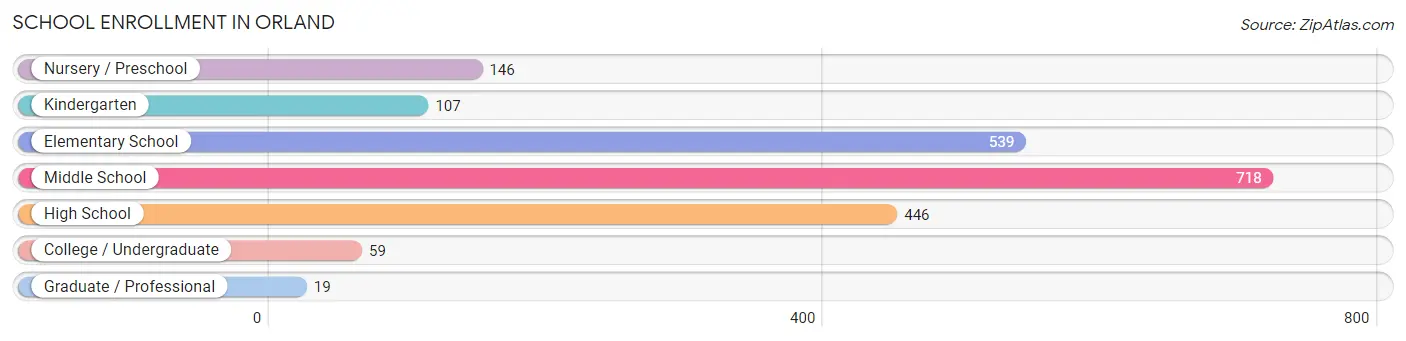
School Enrollment in Orland
The most common levels of schooling among the 2,034 students in Orland are middle school (718 | 35.3%), elementary school (539 | 26.5%), and high school (446 | 21.9%).
| School Level | # Students | % Students |
| Nursery / Preschool | 146 | 7.2% |
| Kindergarten | 107 | 5.3% |
| Elementary School | 539 | 26.5% |
| Middle School | 718 | 35.3% |
| High School | 446 | 21.9% |
| College / Undergraduate | 59 | 2.9% |
| Graduate / Professional | 19 | 0.9% |
| Total | 2,034 | 100.0% |
School Enrollment by Age by Funding Source in Orland
Out of a total of 2,034 students who are enrolled in schools in Orland, 124 (6.1%) attend a private institution, while the remaining 1,910 (93.9%) are enrolled in public schools. The age group of 5 to 9 year old has the highest likelihood of being enrolled in private schools, with 57 (8.3% in the age bracket) enrolled. Conversely, the age group of 3 to 4 year olds has the lowest likelihood of being enrolled in a private school, with 15 (100.0% in the age bracket) attending a public institution.
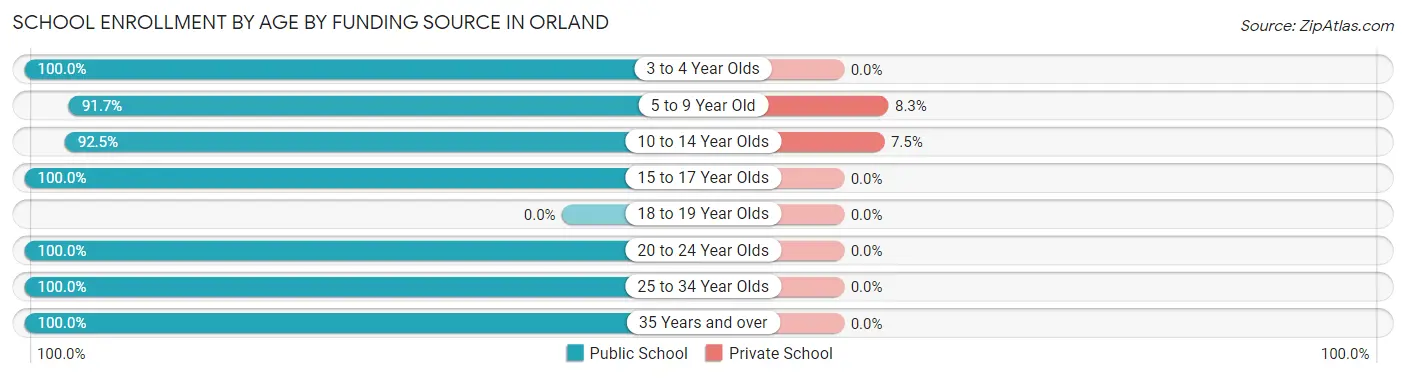
| Age Bracket | Public School | Private School |
| 3 to 4 Year Olds | 15 (100.0%) | 0 (0.0%) |
| 5 to 9 Year Old | 633 (91.7%) | 57 (8.3%) |
| 10 to 14 Year Olds | 826 (92.5%) | 67 (7.5%) |
| 15 to 17 Year Olds | 349 (100.0%) | 0 (0.0%) |
| 18 to 19 Year Olds | 0 (0.0%) | 0 (0.0%) |
| 20 to 24 Year Olds | 60 (100.0%) | 0 (0.0%) |
| 25 to 34 Year Olds | 18 (100.0%) | 0 (0.0%) |
| 35 Years and over | 9 (100.0%) | 0 (0.0%) |
| Total | 1,910 (93.9%) | 124 (6.1%) |
Educational Attainment by Field of Study in Orland
Business (131 | 23.1%), bio, nature & agricultural (98 | 17.3%), science & technology (80 | 14.1%), liberal arts & history (55 | 9.7%), and psychology (46 | 8.1%) are the most common fields of study among 566 individuals in Orland who have obtained a bachelor's degree or higher.
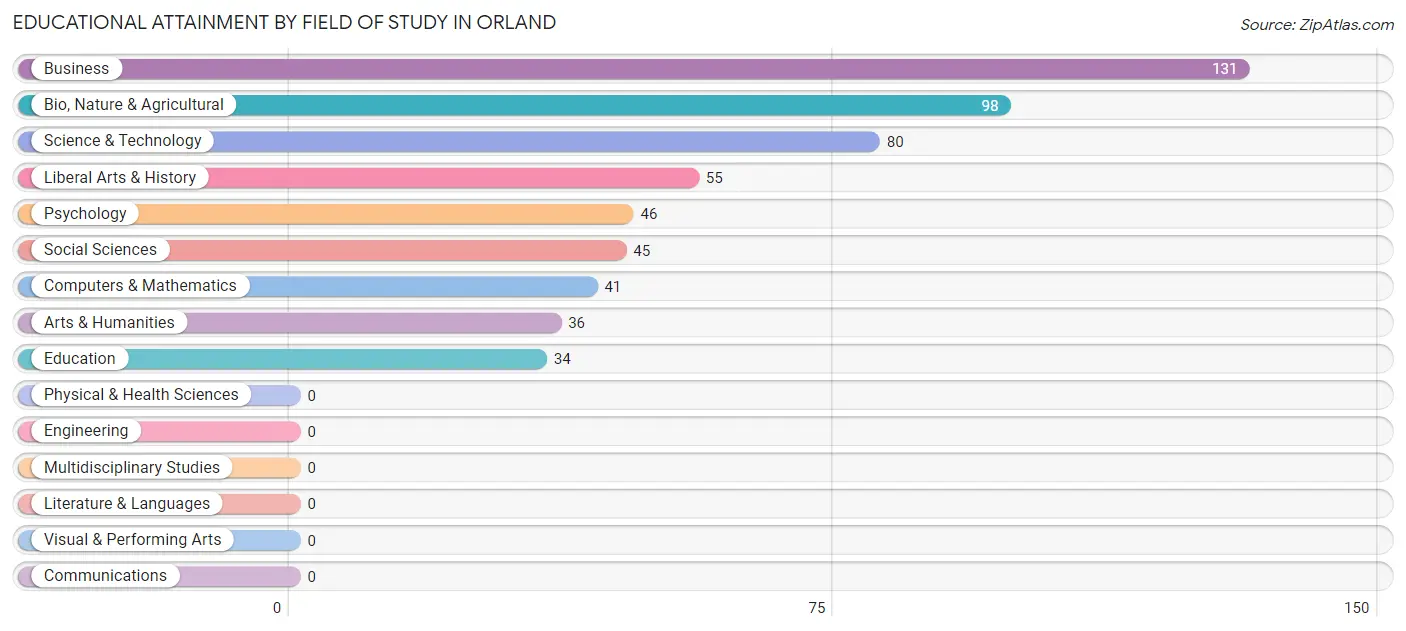
| Field of Study | # Graduates | % Graduates |
| Computers & Mathematics | 41 | 7.2% |
| Bio, Nature & Agricultural | 98 | 17.3% |
| Physical & Health Sciences | 0 | 0.0% |
| Psychology | 46 | 8.1% |
| Social Sciences | 45 | 8.0% |
| Engineering | 0 | 0.0% |
| Multidisciplinary Studies | 0 | 0.0% |
| Science & Technology | 80 | 14.1% |
| Business | 131 | 23.1% |
| Education | 34 | 6.0% |
| Literature & Languages | 0 | 0.0% |
| Liberal Arts & History | 55 | 9.7% |
| Visual & Performing Arts | 0 | 0.0% |
| Communications | 0 | 0.0% |
| Arts & Humanities | 36 | 6.4% |
| Total | 566 | 100.0% |
Transportation & Commute in Orland
Vehicle Availability by Sex in Orland
The most prevalent vehicle ownership categories in Orland are males with 3 vehicles (590, accounting for 32.5%) and females with 3 vehicles (388, making up 41.4%).
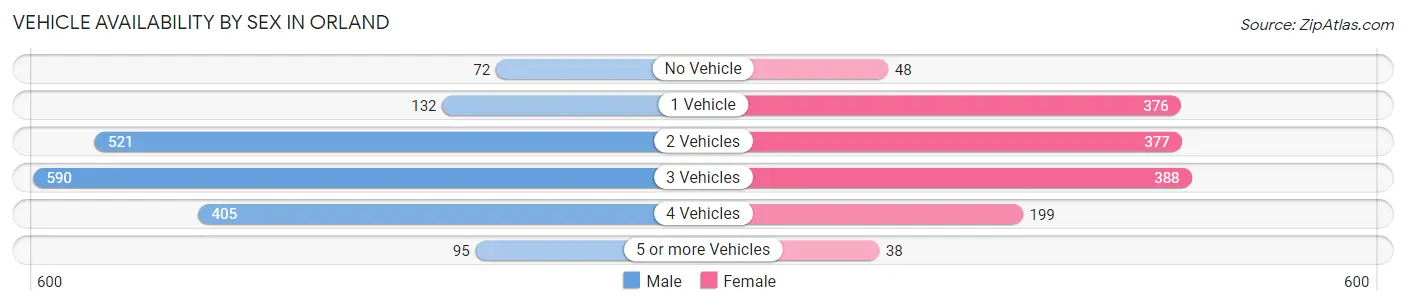
| Vehicles Available | Male | Female |
| No Vehicle | 72 (4.0%) | 48 (3.4%) |
| 1 Vehicle | 132 (7.3%) | 376 (26.4%) |
| 2 Vehicles | 521 (28.7%) | 377 (26.4%) |
| 3 Vehicles | 590 (32.5%) | 388 (27.2%) |
| 4 Vehicles | 405 (22.3%) | 199 (14.0%) |
| 5 or more Vehicles | 95 (5.2%) | 38 (2.7%) |
| Total | 1,815 (100.0%) | 1,426 (100.0%) |
Commute Time in Orland
The most frequently occuring commute durations in Orland are 15 to 19 minutes (637 commuters, 21.3%), 5 to 9 minutes (472 commuters, 15.8%), and 30 to 34 minutes (459 commuters, 15.3%).
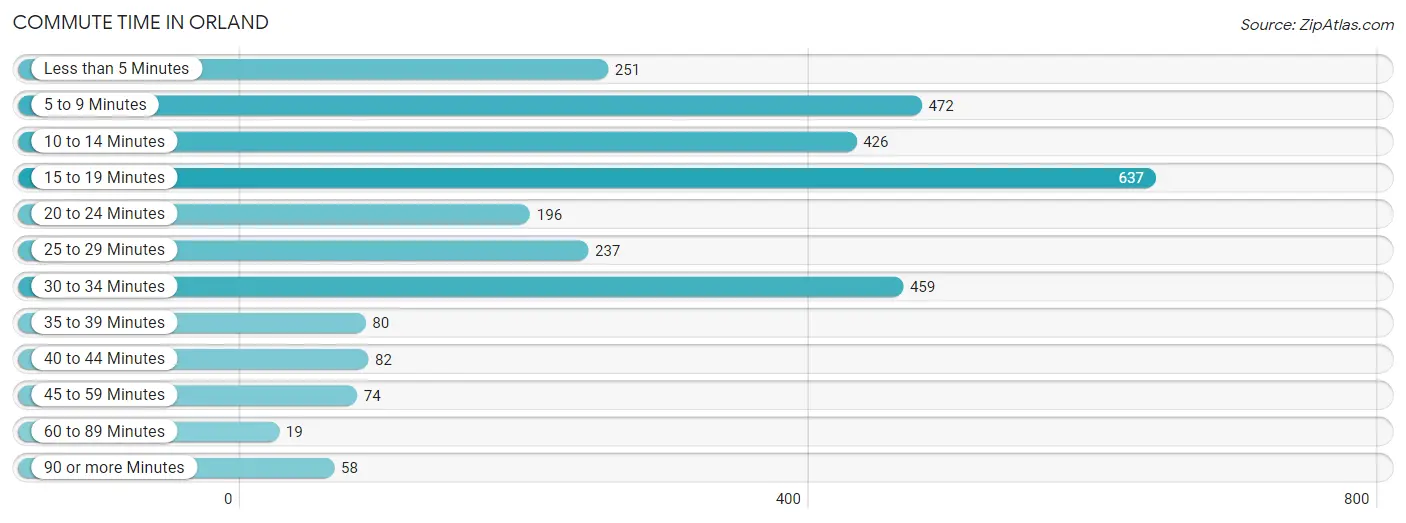
| Commute Time | # Commuters | % Commuters |
| Less than 5 Minutes | 251 | 8.4% |
| 5 to 9 Minutes | 472 | 15.8% |
| 10 to 14 Minutes | 426 | 14.2% |
| 15 to 19 Minutes | 637 | 21.3% |
| 20 to 24 Minutes | 196 | 6.6% |
| 25 to 29 Minutes | 237 | 7.9% |
| 30 to 34 Minutes | 459 | 15.3% |
| 35 to 39 Minutes | 80 | 2.7% |
| 40 to 44 Minutes | 82 | 2.7% |
| 45 to 59 Minutes | 74 | 2.5% |
| 60 to 89 Minutes | 19 | 0.6% |
| 90 or more Minutes | 58 | 1.9% |
Commute Time by Sex in Orland
The most common commute times in Orland are 15 to 19 minutes (478 commuters, 28.8%) for males and 5 to 9 minutes (282 commuters, 21.1%) for females.
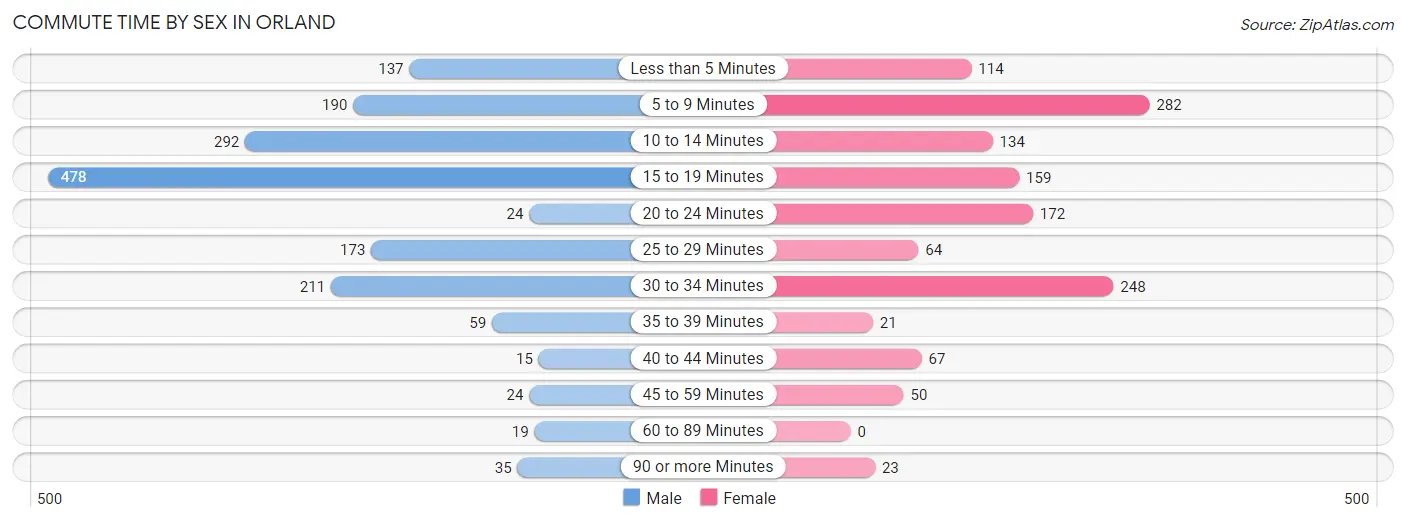
| Commute Time | Male | Female |
| Less than 5 Minutes | 137 (8.3%) | 114 (8.6%) |
| 5 to 9 Minutes | 190 (11.5%) | 282 (21.1%) |
| 10 to 14 Minutes | 292 (17.6%) | 134 (10.0%) |
| 15 to 19 Minutes | 478 (28.8%) | 159 (11.9%) |
| 20 to 24 Minutes | 24 (1.5%) | 172 (12.9%) |
| 25 to 29 Minutes | 173 (10.4%) | 64 (4.8%) |
| 30 to 34 Minutes | 211 (12.7%) | 248 (18.6%) |
| 35 to 39 Minutes | 59 (3.6%) | 21 (1.6%) |
| 40 to 44 Minutes | 15 (0.9%) | 67 (5.0%) |
| 45 to 59 Minutes | 24 (1.5%) | 50 (3.7%) |
| 60 to 89 Minutes | 19 (1.1%) | 0 (0.0%) |
| 90 or more Minutes | 35 (2.1%) | 23 (1.7%) |
Time of Departure to Work by Sex in Orland
The most frequent times of departure to work in Orland are 6:00 AM to 6:29 AM (437, 26.4%) for males and 7:30 AM to 7:59 AM (341, 25.6%) for females.
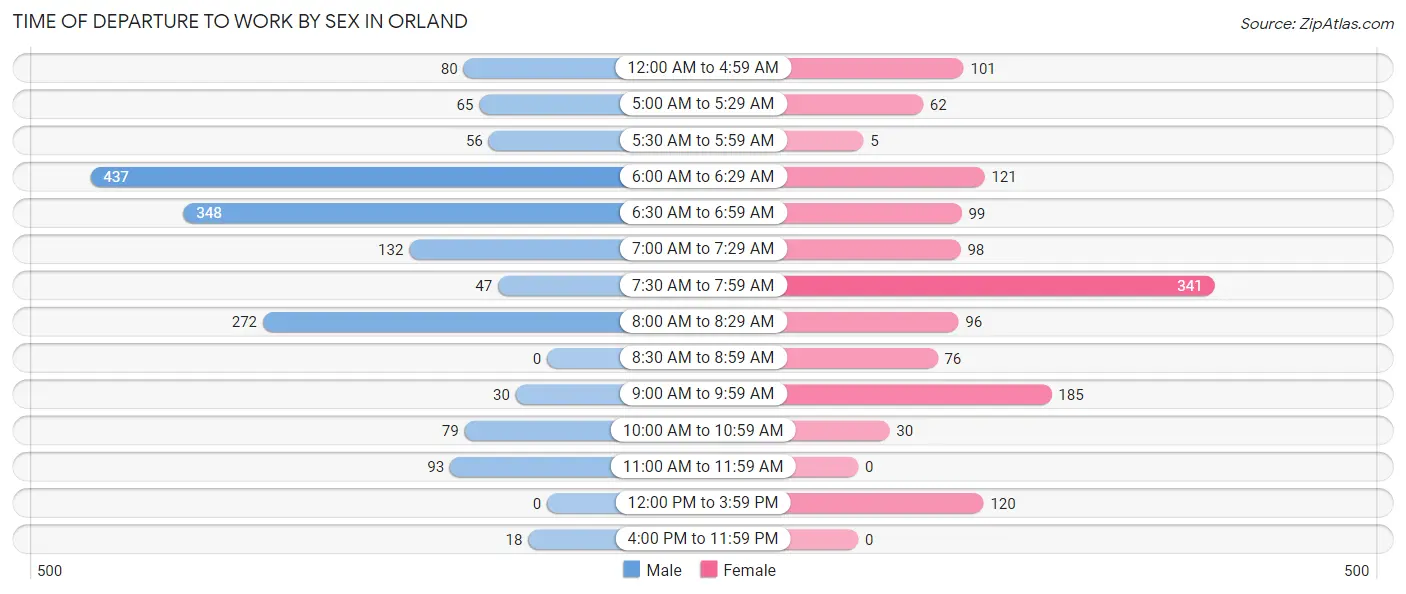
| Time of Departure | Male | Female |
| 12:00 AM to 4:59 AM | 80 (4.8%) | 101 (7.6%) |
| 5:00 AM to 5:29 AM | 65 (3.9%) | 62 (4.6%) |
| 5:30 AM to 5:59 AM | 56 (3.4%) | 5 (0.4%) |
| 6:00 AM to 6:29 AM | 437 (26.4%) | 121 (9.1%) |
| 6:30 AM to 6:59 AM | 348 (21.0%) | 99 (7.4%) |
| 7:00 AM to 7:29 AM | 132 (8.0%) | 98 (7.3%) |
| 7:30 AM to 7:59 AM | 47 (2.8%) | 341 (25.6%) |
| 8:00 AM to 8:29 AM | 272 (16.4%) | 96 (7.2%) |
| 8:30 AM to 8:59 AM | 0 (0.0%) | 76 (5.7%) |
| 9:00 AM to 9:59 AM | 30 (1.8%) | 185 (13.9%) |
| 10:00 AM to 10:59 AM | 79 (4.8%) | 30 (2.2%) |
| 11:00 AM to 11:59 AM | 93 (5.6%) | 0 (0.0%) |
| 12:00 PM to 3:59 PM | 0 (0.0%) | 120 (9.0%) |
| 4:00 PM to 11:59 PM | 18 (1.1%) | 0 (0.0%) |
| Total | 1,657 (100.0%) | 1,334 (100.0%) |
Housing Occupancy in Orland
Occupancy by Ownership in Orland
Of the total 2,788 dwellings in Orland, owner-occupied units account for 1,684 (60.4%), while renter-occupied units make up 1,104 (39.6%).
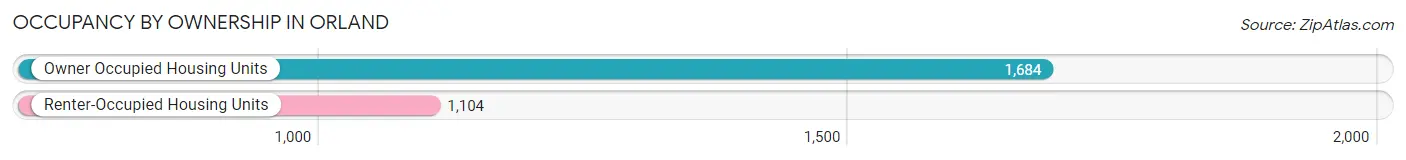
| Occupancy | # Housing Units | % Housing Units |
| Owner Occupied Housing Units | 1,684 | 60.4% |
| Renter-Occupied Housing Units | 1,104 | 39.6% |
| Total Occupied Housing Units | 2,788 | 100.0% |
Occupancy by Household Size in Orland
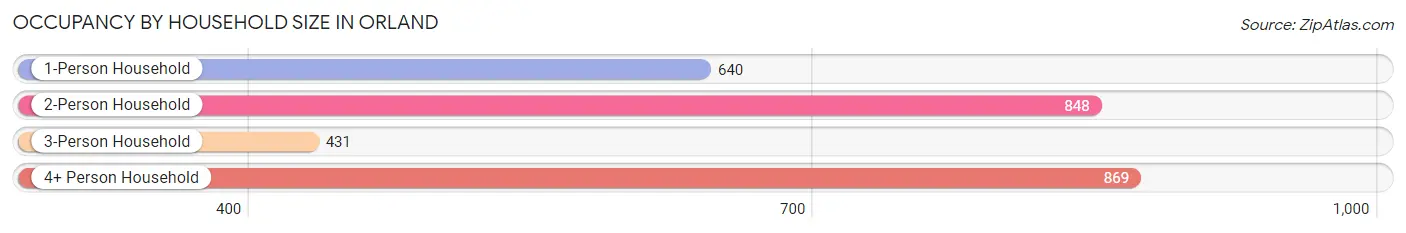
| Household Size | # Housing Units | % Housing Units |
| 1-Person Household | 640 | 23.0% |
| 2-Person Household | 848 | 30.4% |
| 3-Person Household | 431 | 15.5% |
| 4+ Person Household | 869 | 31.2% |
| Total Housing Units | 2,788 | 100.0% |
Occupancy by Ownership by Household Size in Orland
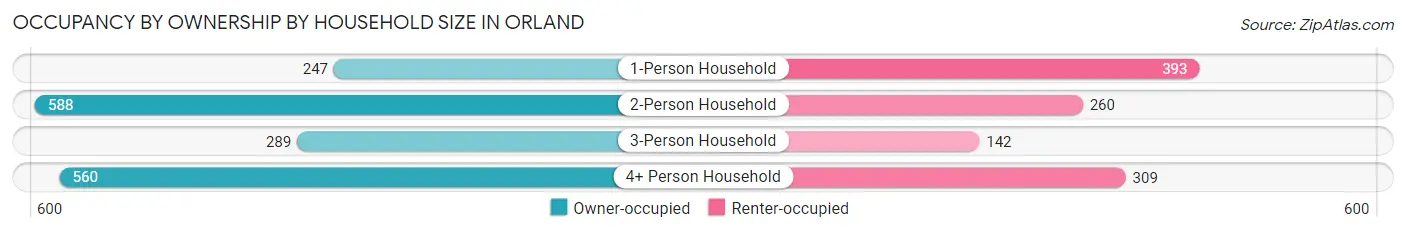
| Household Size | Owner-occupied | Renter-occupied |
| 1-Person Household | 247 (38.6%) | 393 (61.4%) |
| 2-Person Household | 588 (69.3%) | 260 (30.7%) |
| 3-Person Household | 289 (67.0%) | 142 (33.0%) |
| 4+ Person Household | 560 (64.4%) | 309 (35.6%) |
| Total Housing Units | 1,684 (60.4%) | 1,104 (39.6%) |
Occupancy by Educational Attainment in Orland
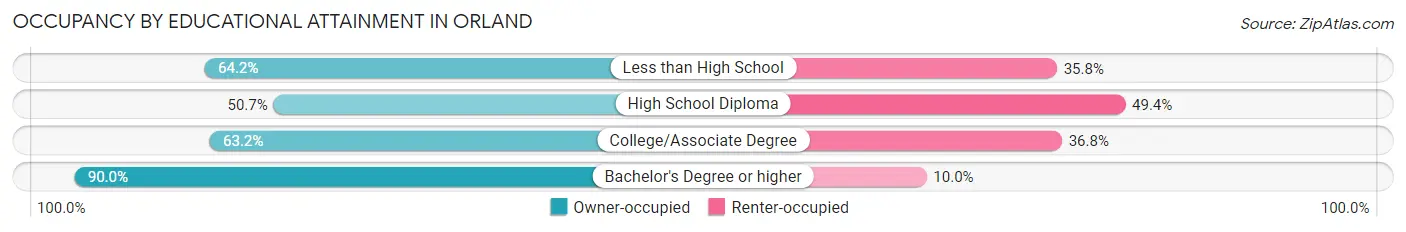
| Household Size | Owner-occupied | Renter-occupied |
| Less than High School | 312 (64.2%) | 174 (35.8%) |
| High School Diploma | 585 (50.6%) | 570 (49.3%) |
| College/Associate Degree | 579 (63.2%) | 337 (36.8%) |
| Bachelor's Degree or higher | 208 (90.0%) | 23 (10.0%) |
Occupancy by Age of Householder in Orland
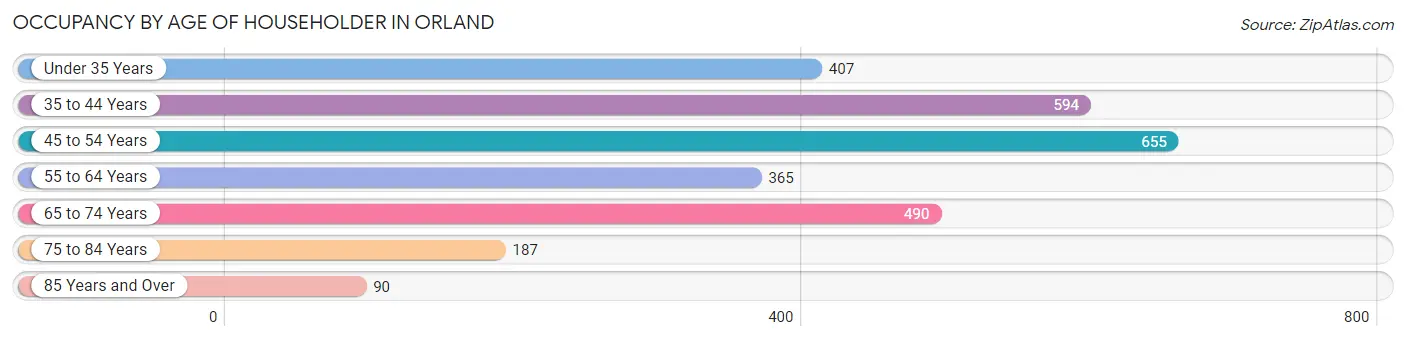
| Age Bracket | # Households | % Households |
| Under 35 Years | 407 | 14.6% |
| 35 to 44 Years | 594 | 21.3% |
| 45 to 54 Years | 655 | 23.5% |
| 55 to 64 Years | 365 | 13.1% |
| 65 to 74 Years | 490 | 17.6% |
| 75 to 84 Years | 187 | 6.7% |
| 85 Years and Over | 90 | 3.2% |
| Total | 2,788 | 100.0% |
Housing Finances in Orland
Median Income by Occupancy in Orland
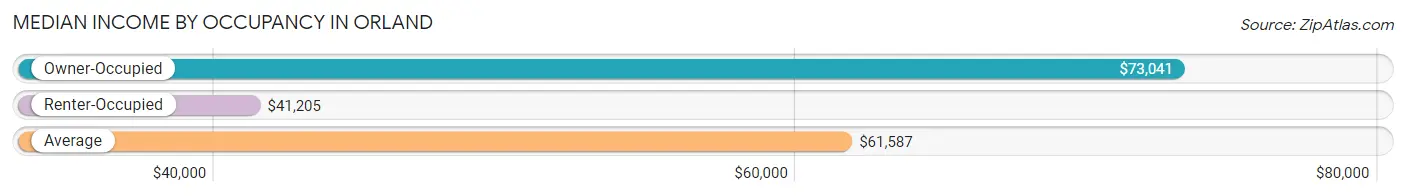
| Occupancy Type | # Households | Median Income |
| Owner-Occupied | 1,684 (60.4%) | $73,041 |
| Renter-Occupied | 1,104 (39.6%) | $41,205 |
| Average | 2,788 (100.0%) | $61,587 |
Occupancy by Householder Income Bracket in Orland
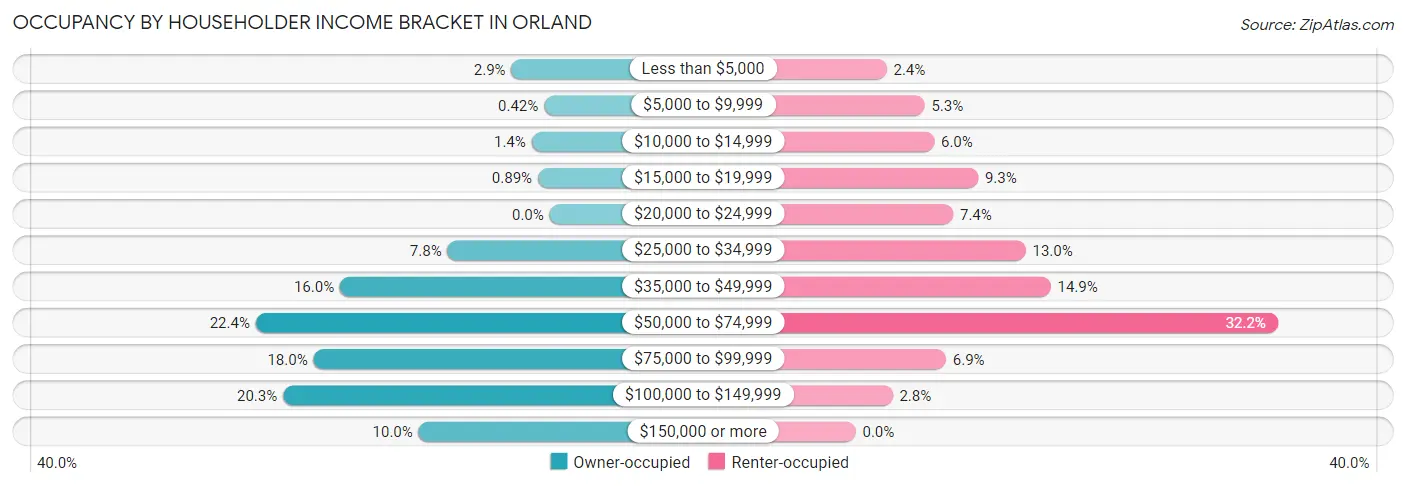
| Income Bracket | Owner-occupied | Renter-occupied |
| Less than $5,000 | 49 (2.9%) | 26 (2.4%) |
| $5,000 to $9,999 | 7 (0.4%) | 58 (5.2%) |
| $10,000 to $14,999 | 23 (1.4%) | 66 (6.0%) |
| $15,000 to $19,999 | 15 (0.9%) | 103 (9.3%) |
| $20,000 to $24,999 | 0 (0.0%) | 82 (7.4%) |
| $25,000 to $34,999 | 131 (7.8%) | 143 (13.0%) |
| $35,000 to $49,999 | 269 (16.0%) | 164 (14.9%) |
| $50,000 to $74,999 | 377 (22.4%) | 355 (32.2%) |
| $75,000 to $99,999 | 303 (18.0%) | 76 (6.9%) |
| $100,000 to $149,999 | 342 (20.3%) | 31 (2.8%) |
| $150,000 or more | 168 (10.0%) | 0 (0.0%) |
| Total | 1,684 (100.0%) | 1,104 (100.0%) |
Monthly Housing Cost Tiers in Orland
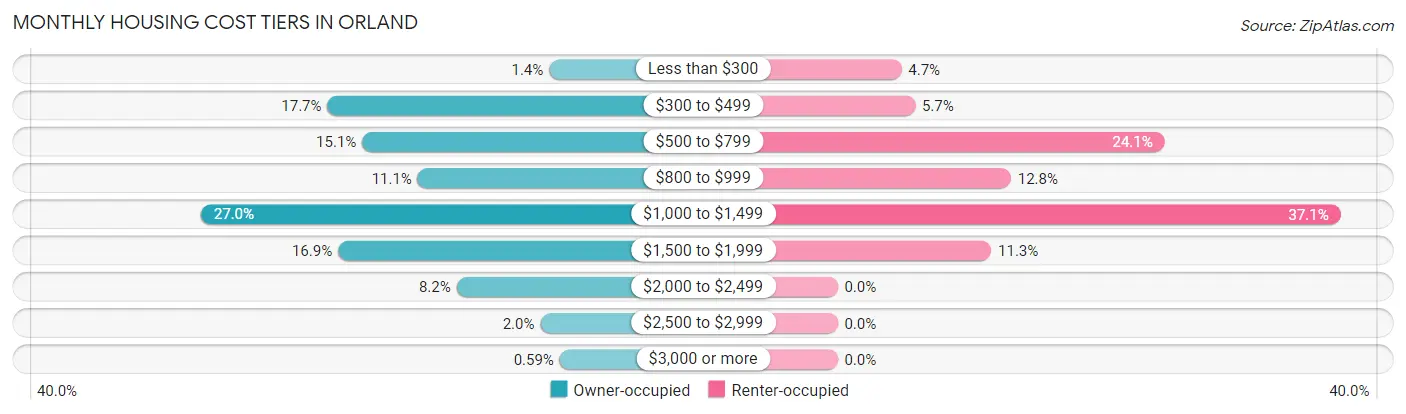
| Monthly Cost | Owner-occupied | Renter-occupied |
| Less than $300 | 23 (1.4%) | 52 (4.7%) |
| $300 to $499 | 298 (17.7%) | 63 (5.7%) |
| $500 to $799 | 255 (15.1%) | 266 (24.1%) |
| $800 to $999 | 186 (11.1%) | 141 (12.8%) |
| $1,000 to $1,499 | 455 (27.0%) | 409 (37.0%) |
| $1,500 to $1,999 | 285 (16.9%) | 125 (11.3%) |
| $2,000 to $2,499 | 138 (8.2%) | 0 (0.0%) |
| $2,500 to $2,999 | 34 (2.0%) | 0 (0.0%) |
| $3,000 or more | 10 (0.6%) | 0 (0.0%) |
| Total | 1,684 (100.0%) | 1,104 (100.0%) |
Physical Housing Characteristics in Orland
Housing Structures in Orland
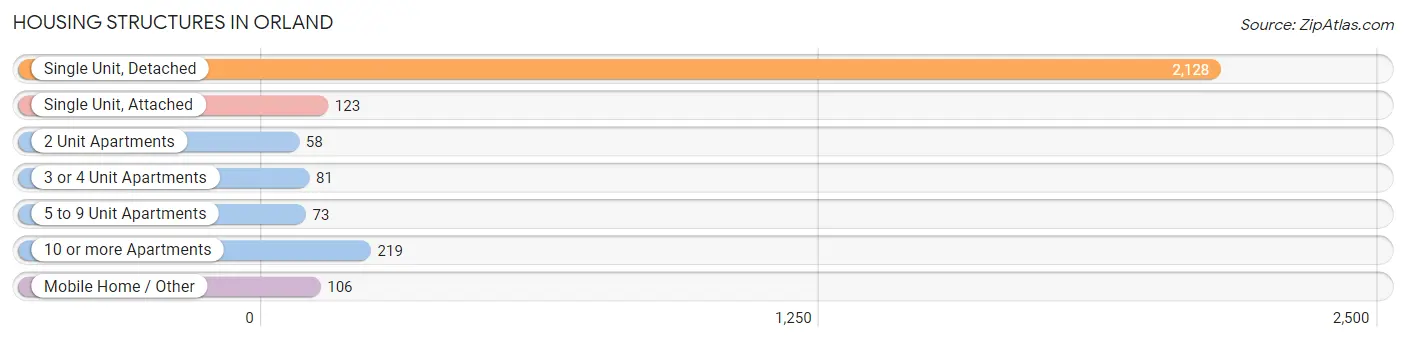
| Structure Type | # Housing Units | % Housing Units |
| Single Unit, Detached | 2,128 | 76.3% |
| Single Unit, Attached | 123 | 4.4% |
| 2 Unit Apartments | 58 | 2.1% |
| 3 or 4 Unit Apartments | 81 | 2.9% |
| 5 to 9 Unit Apartments | 73 | 2.6% |
| 10 or more Apartments | 219 | 7.9% |
| Mobile Home / Other | 106 | 3.8% |
| Total | 2,788 | 100.0% |
Housing Structures by Occupancy in Orland
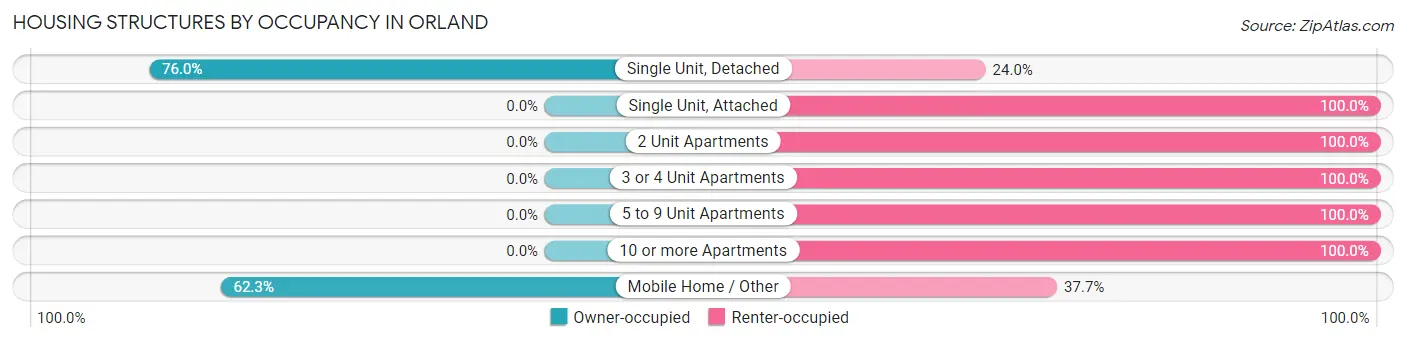
| Structure Type | Owner-occupied | Renter-occupied |
| Single Unit, Detached | 1,618 (76.0%) | 510 (24.0%) |
| Single Unit, Attached | 0 (0.0%) | 123 (100.0%) |
| 2 Unit Apartments | 0 (0.0%) | 58 (100.0%) |
| 3 or 4 Unit Apartments | 0 (0.0%) | 81 (100.0%) |
| 5 to 9 Unit Apartments | 0 (0.0%) | 73 (100.0%) |
| 10 or more Apartments | 0 (0.0%) | 219 (100.0%) |
| Mobile Home / Other | 66 (62.3%) | 40 (37.7%) |
| Total | 1,684 (60.4%) | 1,104 (39.6%) |
Housing Structures by Number of Rooms in Orland
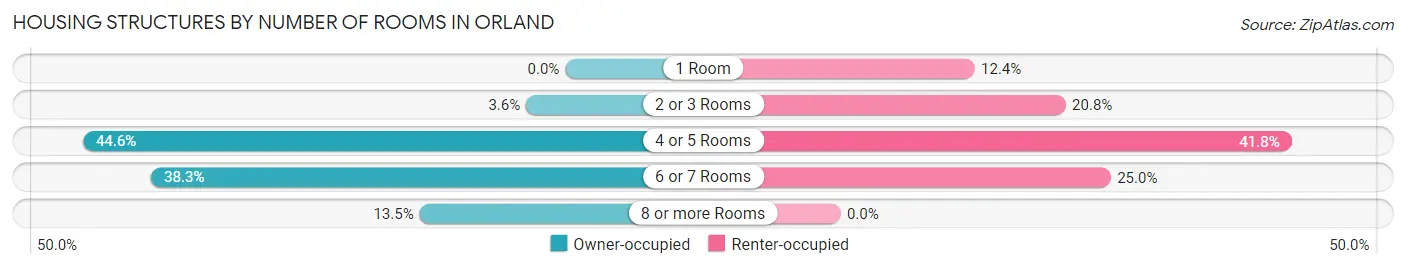
| Number of Rooms | Owner-occupied | Renter-occupied |
| 1 Room | 0 (0.0%) | 137 (12.4%) |
| 2 or 3 Rooms | 61 (3.6%) | 230 (20.8%) |
| 4 or 5 Rooms | 751 (44.6%) | 461 (41.8%) |
| 6 or 7 Rooms | 645 (38.3%) | 276 (25.0%) |
| 8 or more Rooms | 227 (13.5%) | 0 (0.0%) |
| Total | 1,684 (100.0%) | 1,104 (100.0%) |
Housing Structure by Heating Type in Orland
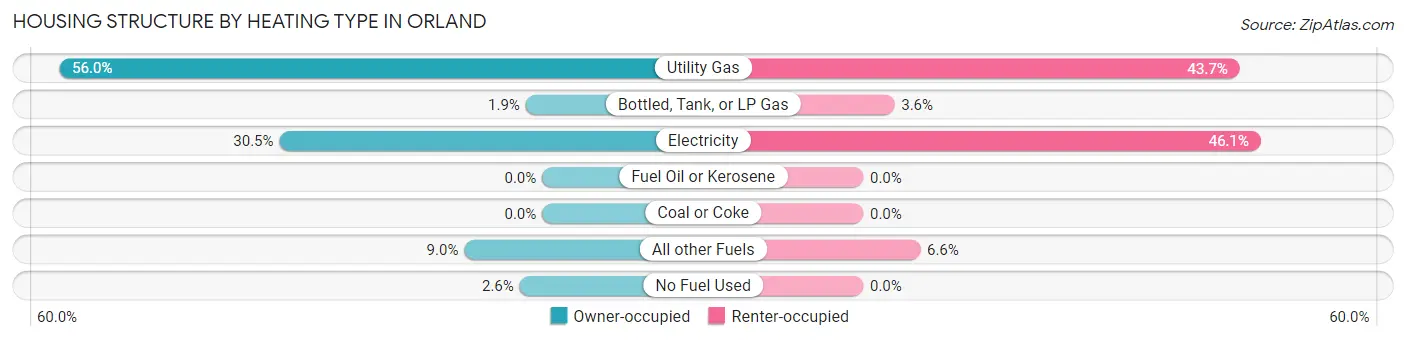
| Heating Type | Owner-occupied | Renter-occupied |
| Utility Gas | 943 (56.0%) | 482 (43.7%) |
| Bottled, Tank, or LP Gas | 32 (1.9%) | 40 (3.6%) |
| Electricity | 513 (30.5%) | 509 (46.1%) |
| Fuel Oil or Kerosene | 0 (0.0%) | 0 (0.0%) |
| Coal or Coke | 0 (0.0%) | 0 (0.0%) |
| All other Fuels | 152 (9.0%) | 73 (6.6%) |
| No Fuel Used | 44 (2.6%) | 0 (0.0%) |
| Total | 1,684 (100.0%) | 1,104 (100.0%) |
Household Vehicle Usage in Orland
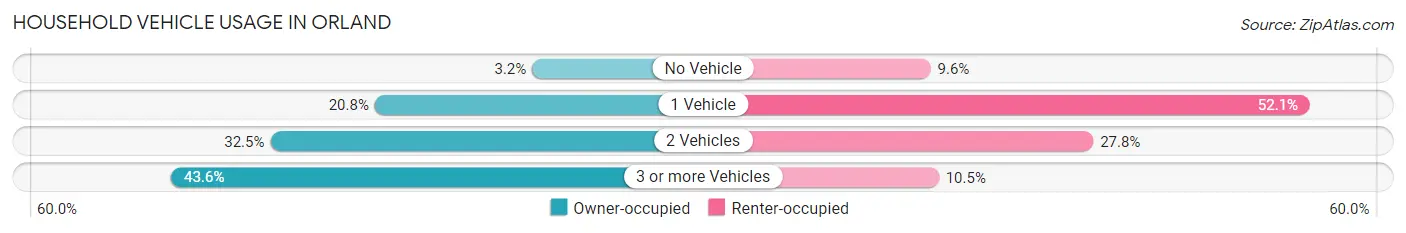
| Vehicles per Household | Owner-occupied | Renter-occupied |
| No Vehicle | 53 (3.2%) | 106 (9.6%) |
| 1 Vehicle | 350 (20.8%) | 575 (52.1%) |
| 2 Vehicles | 547 (32.5%) | 307 (27.8%) |
| 3 or more Vehicles | 734 (43.6%) | 116 (10.5%) |
| Total | 1,684 (100.0%) | 1,104 (100.0%) |
Real Estate & Mortgages in Orland
Real Estate and Mortgage Overview in Orland
| Characteristic | Without Mortgage | With Mortgage |
| Housing Units | 615 | 1,069 |
| Median Property Value | $265,600 | $288,500 |
| Median Household Income | $85,313 | $43 |
| Monthly Housing Costs | $499 | $10 |
| Real Estate Taxes | $1,745 | $15 |
Property Value by Mortgage Status in Orland
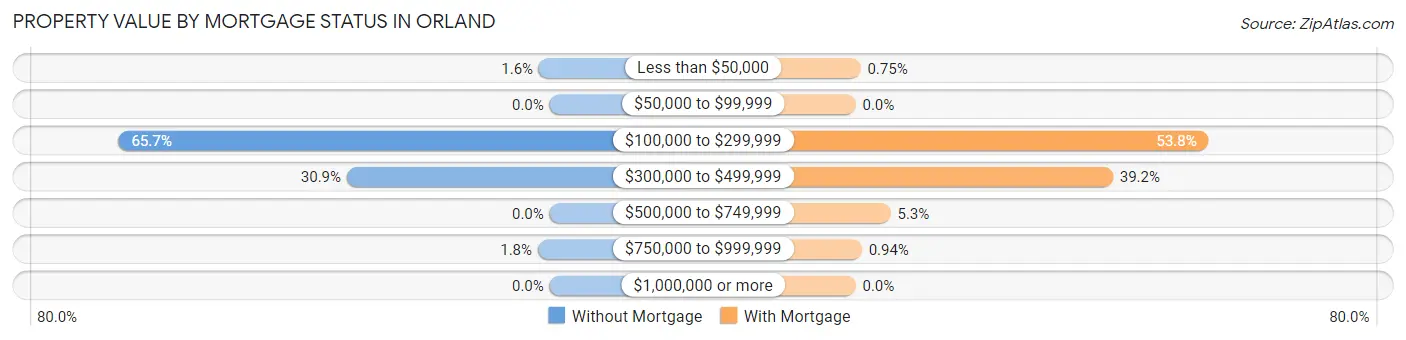
| Property Value | Without Mortgage | With Mortgage |
| Less than $50,000 | 10 (1.6%) | 8 (0.7%) |
| $50,000 to $99,999 | 0 (0.0%) | 0 (0.0%) |
| $100,000 to $299,999 | 404 (65.7%) | 575 (53.8%) |
| $300,000 to $499,999 | 190 (30.9%) | 419 (39.2%) |
| $500,000 to $749,999 | 0 (0.0%) | 57 (5.3%) |
| $750,000 to $999,999 | 11 (1.8%) | 10 (0.9%) |
| $1,000,000 or more | 0 (0.0%) | 0 (0.0%) |
| Total | 615 (100.0%) | 1,069 (100.0%) |
Household Income by Mortgage Status in Orland
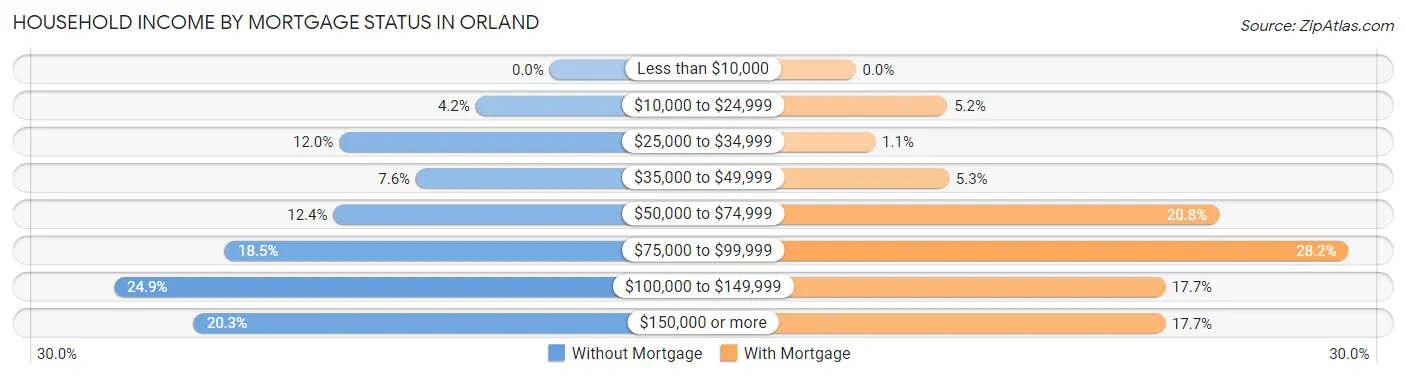
| Household Income | Without Mortgage | With Mortgage |
| Less than $10,000 | 0 (0.0%) | 0 (0.0%) |
| $10,000 to $24,999 | 26 (4.2%) | 56 (5.2%) |
| $25,000 to $34,999 | 74 (12.0%) | 12 (1.1%) |
| $35,000 to $49,999 | 47 (7.6%) | 57 (5.3%) |
| $50,000 to $74,999 | 76 (12.4%) | 222 (20.8%) |
| $75,000 to $99,999 | 114 (18.5%) | 301 (28.2%) |
| $100,000 to $149,999 | 153 (24.9%) | 189 (17.7%) |
| $150,000 or more | 125 (20.3%) | 189 (17.7%) |
| Total | 615 (100.0%) | 1,069 (100.0%) |
Property Value to Household Income Ratio in Orland
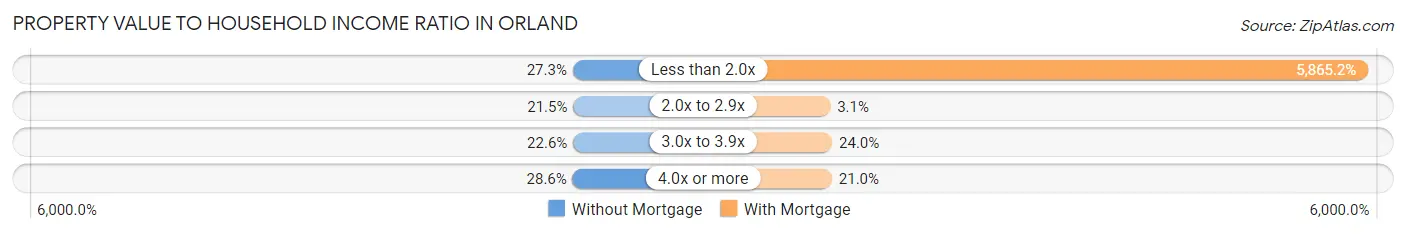
| Value-to-Income Ratio | Without Mortgage | With Mortgage |
| Less than 2.0x | 168 (27.3%) | 62,699 (5,865.2%) |
| 2.0x to 2.9x | 132 (21.5%) | 33 (3.1%) |
| 3.0x to 3.9x | 139 (22.6%) | 256 (23.9%) |
| 4.0x or more | 176 (28.6%) | 224 (20.9%) |
| Total | 615 (100.0%) | 1,069 (100.0%) |
Real Estate Taxes by Mortgage Status in Orland
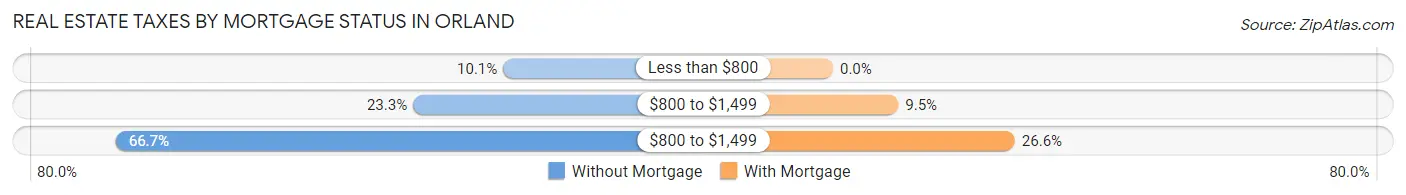
| Property Taxes | Without Mortgage | With Mortgage |
| Less than $800 | 62 (10.1%) | 0 (0.0%) |
| $800 to $1,499 | 143 (23.3%) | 102 (9.5%) |
| $800 to $1,499 | 410 (66.7%) | 284 (26.6%) |
| Total | 615 (100.0%) | 1,069 (100.0%) |
Health & Disability in Orland
Health Insurance Coverage by Age in Orland
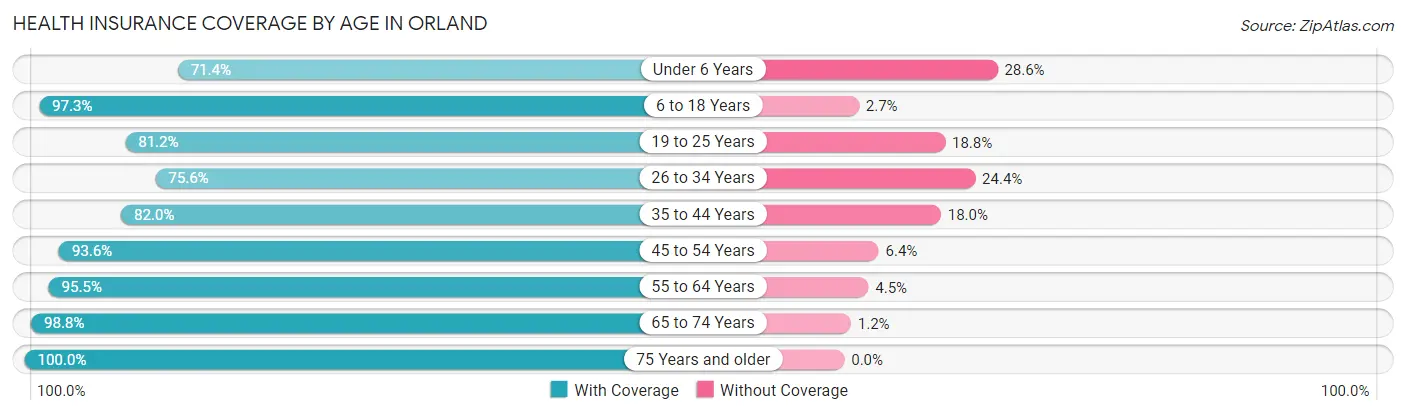
| Age Bracket | With Coverage | Without Coverage |
| Under 6 Years | 623 (71.4%) | 249 (28.6%) |
| 6 to 18 Years | 1,829 (97.3%) | 51 (2.7%) |
| 19 to 25 Years | 497 (81.2%) | 115 (18.8%) |
| 26 to 34 Years | 657 (75.6%) | 212 (24.4%) |
| 35 to 44 Years | 870 (82.0%) | 191 (18.0%) |
| 45 to 54 Years | 892 (93.6%) | 61 (6.4%) |
| 55 to 64 Years | 704 (95.5%) | 33 (4.5%) |
| 65 to 74 Years | 728 (98.8%) | 9 (1.2%) |
| 75 Years and older | 490 (100.0%) | 0 (0.0%) |
| Total | 7,290 (88.8%) | 921 (11.2%) |
Health Insurance Coverage by Citizenship Status in Orland
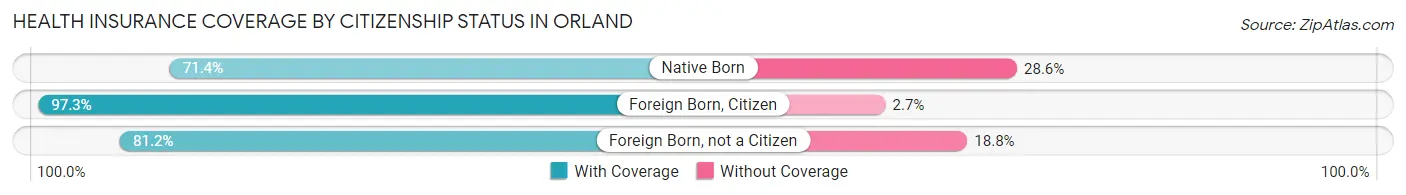
| Citizenship Status | With Coverage | Without Coverage |
| Native Born | 623 (71.4%) | 249 (28.6%) |
| Foreign Born, Citizen | 1,829 (97.3%) | 51 (2.7%) |
| Foreign Born, not a Citizen | 497 (81.2%) | 115 (18.8%) |
Health Insurance Coverage by Household Income in Orland
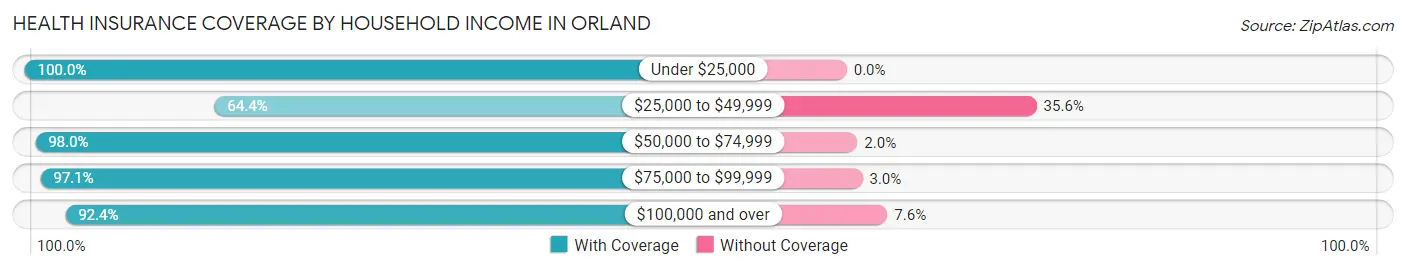
| Household Income | With Coverage | Without Coverage |
| Under $25,000 | 882 (100.0%) | 0 (0.0%) |
| $25,000 to $49,999 | 1,241 (64.4%) | 685 (35.6%) |
| $50,000 to $74,999 | 2,016 (98.0%) | 41 (2.0%) |
| $75,000 to $99,999 | 1,249 (97.1%) | 38 (2.9%) |
| $100,000 and over | 1,882 (92.4%) | 155 (7.6%) |
Public vs Private Health Insurance Coverage by Age in Orland
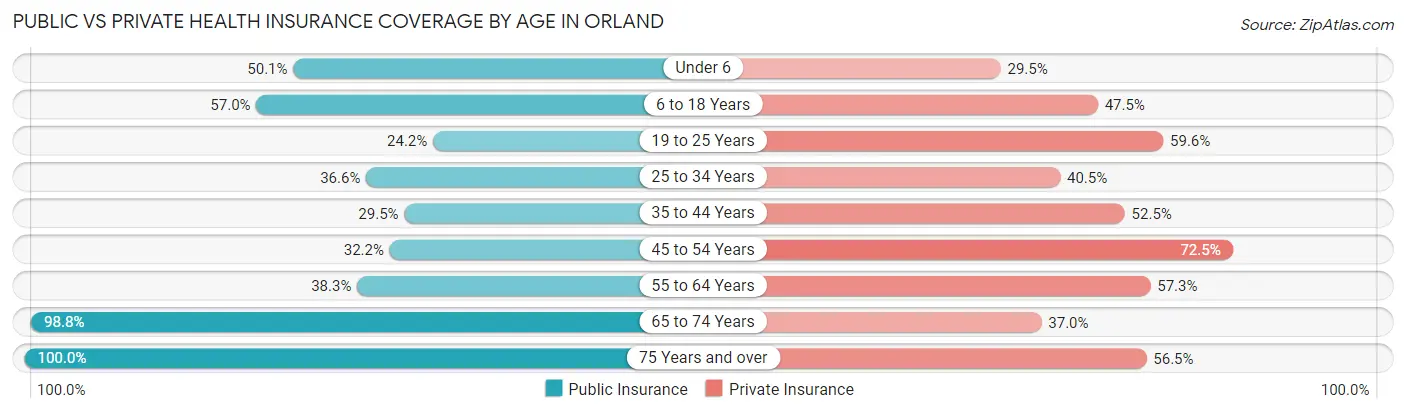
| Age Bracket | Public Insurance | Private Insurance |
| Under 6 | 437 (50.1%) | 257 (29.5%) |
| 6 to 18 Years | 1,071 (57.0%) | 893 (47.5%) |
| 19 to 25 Years | 148 (24.2%) | 365 (59.6%) |
| 25 to 34 Years | 318 (36.6%) | 352 (40.5%) |
| 35 to 44 Years | 313 (29.5%) | 557 (52.5%) |
| 45 to 54 Years | 307 (32.2%) | 691 (72.5%) |
| 55 to 64 Years | 282 (38.3%) | 422 (57.3%) |
| 65 to 74 Years | 728 (98.8%) | 273 (37.0%) |
| 75 Years and over | 490 (100.0%) | 277 (56.5%) |
| Total | 4,094 (49.9%) | 4,087 (49.8%) |
Disability Status by Sex by Age in Orland
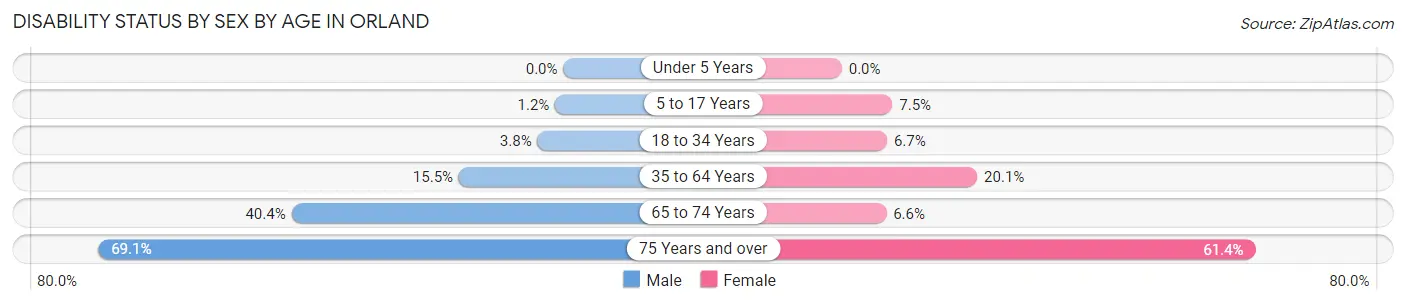
| Age Bracket | Male | Female |
| Under 5 Years | 0 (0.0%) | 0 (0.0%) |
| 5 to 17 Years | 13 (1.2%) | 67 (7.5%) |
| 18 to 34 Years | 30 (3.8%) | 51 (6.7%) |
| 35 to 64 Years | 199 (15.5%) | 295 (20.1%) |
| 65 to 74 Years | 132 (40.4%) | 27 (6.6%) |
| 75 Years and over | 154 (69.1%) | 164 (61.4%) |
Disability Class by Sex by Age in Orland
Disability Class: Hearing Difficulty
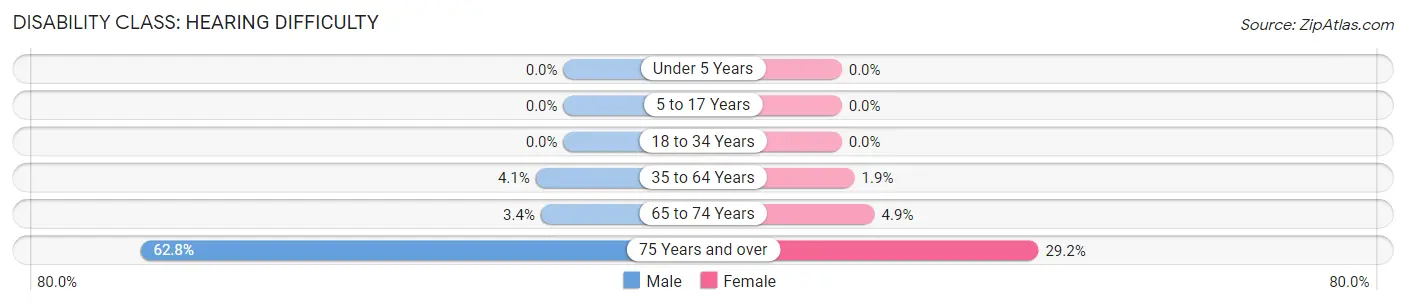
| Age Bracket | Male | Female |
| Under 5 Years | 0 (0.0%) | 0 (0.0%) |
| 5 to 17 Years | 0 (0.0%) | 0 (0.0%) |
| 18 to 34 Years | 0 (0.0%) | 0 (0.0%) |
| 35 to 64 Years | 53 (4.1%) | 28 (1.9%) |
| 65 to 74 Years | 11 (3.4%) | 20 (4.9%) |
| 75 Years and over | 140 (62.8%) | 78 (29.2%) |
Disability Class: Vision Difficulty
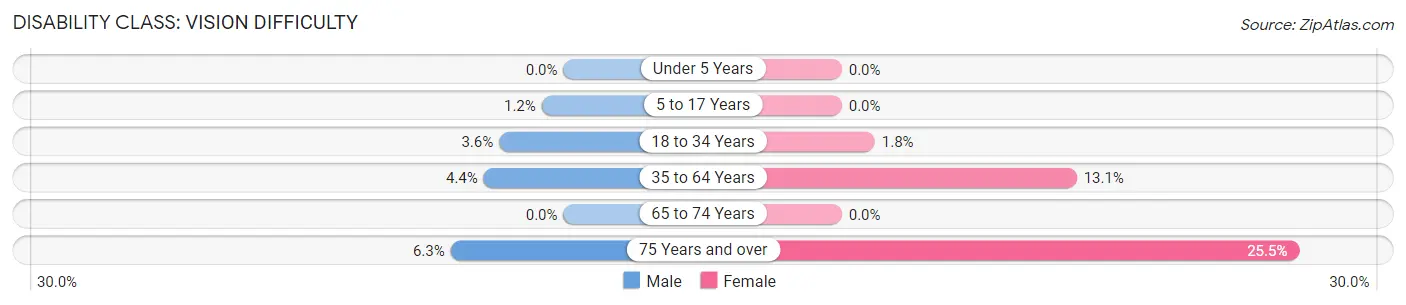
| Age Bracket | Male | Female |
| Under 5 Years | 0 (0.0%) | 0 (0.0%) |
| 5 to 17 Years | 13 (1.2%) | 0 (0.0%) |
| 18 to 34 Years | 28 (3.6%) | 14 (1.8%) |
| 35 to 64 Years | 57 (4.4%) | 192 (13.1%) |
| 65 to 74 Years | 0 (0.0%) | 0 (0.0%) |
| 75 Years and over | 14 (6.3%) | 68 (25.5%) |
Disability Class: Cognitive Difficulty
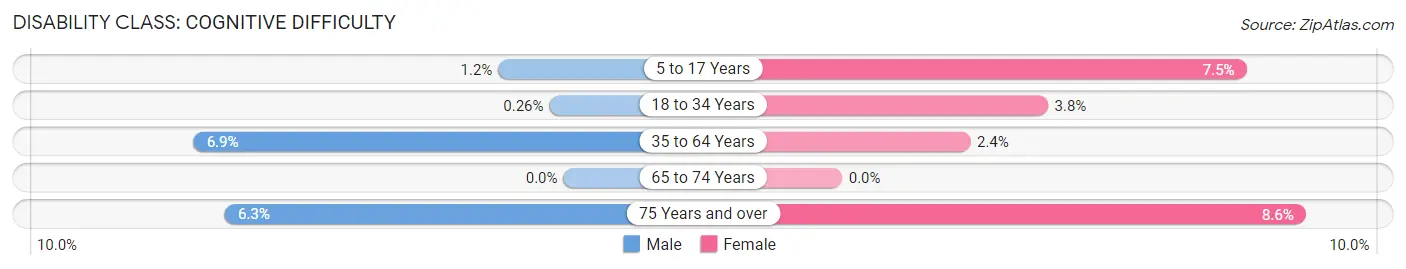
| Age Bracket | Male | Female |
| 5 to 17 Years | 13 (1.2%) | 67 (7.5%) |
| 18 to 34 Years | 2 (0.3%) | 29 (3.8%) |
| 35 to 64 Years | 88 (6.9%) | 35 (2.4%) |
| 65 to 74 Years | 0 (0.0%) | 0 (0.0%) |
| 75 Years and over | 14 (6.3%) | 23 (8.6%) |
Disability Class: Ambulatory Difficulty
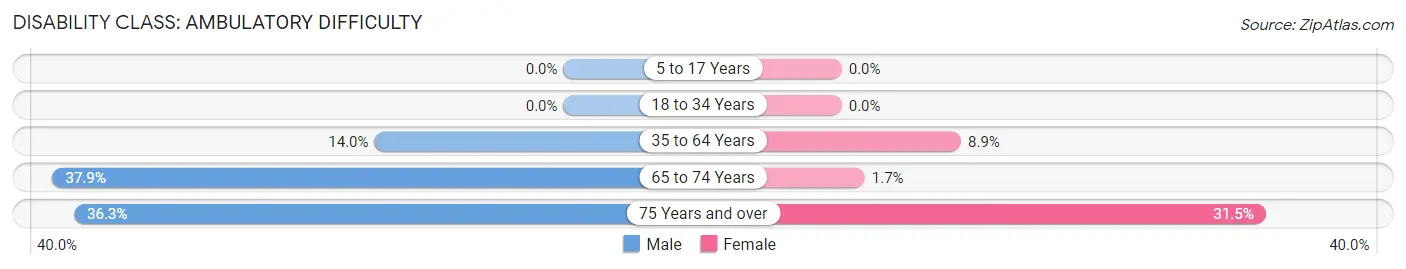
| Age Bracket | Male | Female |
| 5 to 17 Years | 0 (0.0%) | 0 (0.0%) |
| 18 to 34 Years | 0 (0.0%) | 0 (0.0%) |
| 35 to 64 Years | 180 (14.0%) | 130 (8.9%) |
| 65 to 74 Years | 124 (37.9%) | 7 (1.7%) |
| 75 Years and over | 81 (36.3%) | 84 (31.5%) |
Disability Class: Self-Care Difficulty
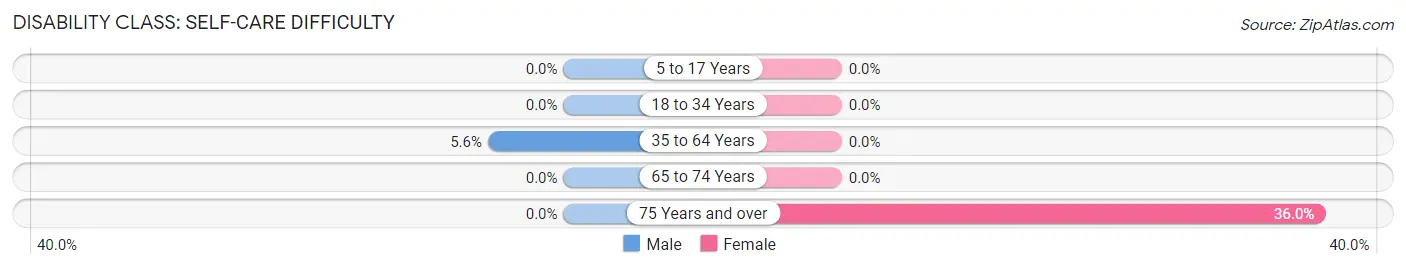
| Age Bracket | Male | Female |
| 5 to 17 Years | 0 (0.0%) | 0 (0.0%) |
| 18 to 34 Years | 0 (0.0%) | 0 (0.0%) |
| 35 to 64 Years | 72 (5.6%) | 0 (0.0%) |
| 65 to 74 Years | 0 (0.0%) | 0 (0.0%) |
| 75 Years and over | 0 (0.0%) | 96 (36.0%) |
Technology Access in Orland
Computing Device Access in Orland
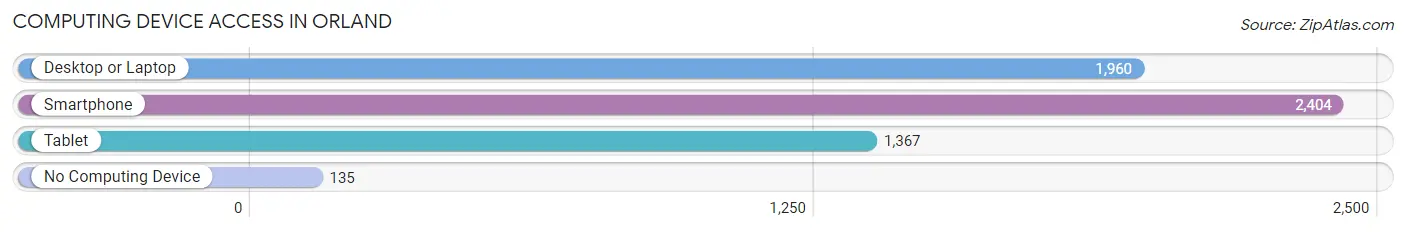
| Device Type | # Households | % Households |
| Desktop or Laptop | 1,960 | 70.3% |
| Smartphone | 2,404 | 86.2% |
| Tablet | 1,367 | 49.0% |
| No Computing Device | 135 | 4.8% |
| Total | 2,788 | 100.0% |
Internet Access in Orland
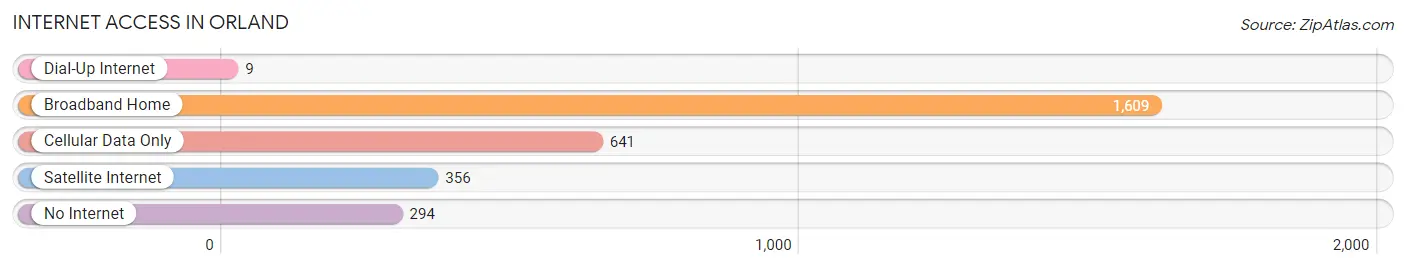
| Internet Type | # Households | % Households |
| Dial-Up Internet | 9 | 0.3% |
| Broadband Home | 1,609 | 57.7% |
| Cellular Data Only | 641 | 23.0% |
| Satellite Internet | 356 | 12.8% |
| No Internet | 294 | 10.5% |
| Total | 2,788 | 100.0% |
Orland Summary
Orland, California is a small city located in Glenn County, California, United States. It is situated in the Sacramento Valley, about 90 miles north of Sacramento and about 100 miles south of Redding. The city is home to a population of 7,291 people, according to the 2010 United States Census.
History
The area that is now Orland was originally inhabited by the Wintun Native American tribe. The first European settlers arrived in the area in the 1850s, and the town was officially founded in 1875. The town was named after Orland Bartlett, a local rancher.
In the late 19th century, Orland was a major stop on the Central Pacific Railroad, and the town grew rapidly. The railroad brought in new settlers and businesses, and the town soon became a center for agriculture and commerce.
In the early 20th century, Orland was a major center for the production of walnuts, prunes, and other fruits and nuts. The town also had a thriving dairy industry, and the local economy was bolstered by the construction of a cannery in the 1920s.
Geography
Orland is located in the Sacramento Valley, about 90 miles north of Sacramento and about 100 miles south of Redding. The city is situated at an elevation of about 200 feet above sea level.
The city is surrounded by rolling hills and farmland, and the nearby Sacramento River provides a scenic backdrop. The climate in Orland is mild, with hot summers and cool winters.
Economy
Orland’s economy is largely based on agriculture. The city is home to a number of farms and ranches, and the local economy is bolstered by the production of walnuts, prunes, and other fruits and nuts.
The city is also home to a number of manufacturing and service-based businesses, including a cannery, a lumber mill, and a number of small businesses.
Demographics
As of the 2010 United States Census, Orland had a population of 7,291 people. The racial makeup of the city was 79.3% White, 0.7% African American, 0.9% Native American, 0.7% Asian, 0.1% Pacific Islander, 15.2% from other races, and 3.2% from two or more races. Hispanic or Latino of any race were 28.2% of the population.
The median household income in Orland was $37,917, and the median family income was $45,917. The per capita income in Orland was $17,845. About 17.2% of families and 21.3% of the population were below the poverty line, including 28.3% of those under age 18 and 8.2% of those age 65 or over.
Common Questions
What is Per Capita Income in Orland?
Per Capita income in Orland is $23,601.
What is the Median Family Income in Orland?
Median Family Income in Orland is $64,261.
What is the Median Household income in Orland?
Median Household Income in Orland is $61,587.
What is Income or Wage Gap in Orland?
Income or Wage Gap in Orland is 23.9%.
Women in Orland earn 76.1 cents for every dollar earned by a man.
What is Family Income Deficit in Orland?
Family Income Deficit in Orland is $8,286.
Families that are below poverty line in Orland earn $8,286 less on average than the poverty threshold level.
What is Inequality or Gini Index in Orland?
Inequality or Gini Index in Orland is 0.37.
What is the Total Population of Orland?
Total Population of Orland is 8,221.
What is the Total Male Population of Orland?
Total Male Population of Orland is 4,087.
What is the Total Female Population of Orland?
Total Female Population of Orland is 4,134.
What is the Ratio of Males per 100 Females in Orland?
There are 98.86 Males per 100 Females in Orland.
What is the Ratio of Females per 100 Males in Orland?
There are 101.15 Females per 100 Males in Orland.
What is the Median Population Age in Orland?
Median Population Age in Orland is 34.3 Years.
What is the Average Family Size in Orland
Average Family Size in Orland is 3.6 People.
What is the Average Household Size in Orland
Average Household Size in Orland is 2.9 People.
How Large is the Labor Force in Orland?
There are 3,637 People in the Labor Forcein in Orland.
What is the Percentage of People in the Labor Force in Orland?
63.4% of People are in the Labor Force in Orland.
What is the Unemployment Rate in Orland?
Unemployment Rate in Orland is 7.2%.