Cities with the Most Births per 1,000 Teenage Women Under the Age of 20 in Georgia

RELATED REPORTS & OPTIONS

Highest Birth Rate | Women 15-19
Population
Families and Households
Female Fertility
Female Fertility (Unmarried)
Race (Community Size)
Race (Percentage)
Ancestry (Community Size)
AfghanAfricanAlaska NativeAlaskan AthabascanAlbanianAleutAlsatianAmericanApacheArabArapahoArgentineanArmenianAssyrian / Chaldean / SyriacAustralianAustrianBahamianBangladeshiBarbadianBasqueBelgianBelizeanBermudanBhutaneseBlackfeetBolivianBrazilianBritishBritish West IndianBulgarianBurmeseCajunCambodianCanadianCape VerdeanCarpatho RusynCelticCentral AmericanCentral American IndianCherokeeCheyenneChickasawChileanChineseChippewaChoctawColombianColvilleComancheCosta RicanCreeCreekCroatianCrowCubanCypriotCzechCzechoslovakianDanishDelawareDominicanDutchDutch West IndianEastern EuropeanEcuadorianEgyptianEnglishEstonianEthiopianEuropeanFijianFilipinoFinnishFrenchFrench American IndianFrench CanadianGermanGerman RussianGhanaianGreekGuamanian / ChamorroGuatemalanGuyaneseHaitianHmongHonduranHopiHoumaHungarianIcelanderIndian (Asian)IndonesianInupiatIranianIraqiIrishIroquoisIsraeliItalianJamaicanJapaneseJordanianKenyanKiowaKoreanLaotianLatvianLebaneseLiberianLithuanianLumbeeLuxembourgerMacedonianMalaysianMalteseMarshalleseMenomineeMexicanMexican American IndianMongolianMoroccanNative HawaiianNavajoNepaleseNew ZealanderNicaraguanNigerianNorthern EuropeanNorwegianOkinawanOsageOttawaPaiutePakistaniPalestinianPanamanianParaguayanPennsylvania GermanPeruvianPimaPolishPortuguesePotawatomiPuebloPuerto RicanPuget Sound SalishRomanianRussianSalvadoranSamoanScandinavianScotch-IrishScottishSeminoleSenegaleseSerbianShoshoneSierra LeoneanSiouxSlavicSlovakSloveneSomaliSouth AfricanSouth AmericanSouth American IndianSoviet UnionSpaniardSpanishSpanish AmericanSpanish American IndianSri LankanSubsaharan AfricanSudaneseSwedishSwissSyrianTaiwaneseThaiTlingit-HaidaTohono O'OdhamTonganTrinidadian and TobagonianTsimshianTurkishU.S. Virgin IslanderUgandanUkrainianUruguayanUteVenezuelanVietnameseWelshWest IndianYakamaYaquiYugoslavianYumanYup'ikZimbabwean
Ancestry (Percentage)
AfghanAfricanAlaska NativeAlaskan AthabascanAlbanianAleutAlsatianAmericanApacheArabArapahoArgentineanArmenianAssyrian / Chaldean / SyriacAustralianAustrianBahamianBangladeshiBarbadianBasqueBelgianBelizeanBermudanBhutaneseBlackfeetBolivianBrazilianBritishBritish West IndianBulgarianBurmeseCajunCambodianCanadianCape VerdeanCarpatho RusynCelticCentral AmericanCentral American IndianCherokeeCheyenneChickasawChileanChineseChippewaChoctawColombianColvilleComancheCosta RicanCreeCreekCroatianCrowCubanCypriotCzechCzechoslovakianDanishDelawareDominicanDutchDutch West IndianEastern EuropeanEcuadorianEgyptianEnglishEstonianEthiopianEuropeanFijianFilipinoFinnishFrenchFrench American IndianFrench CanadianGermanGerman RussianGhanaianGreekGuamanian / ChamorroGuatemalanGuyaneseHaitianHmongHonduranHopiHoumaHungarianIcelanderIndian (Asian)IndonesianInupiatIranianIraqiIrishIroquoisIsraeliItalianJamaicanJapaneseJordanianKenyanKiowaKoreanLaotianLatvianLebaneseLiberianLithuanianLumbeeLuxembourgerMacedonianMalaysianMalteseMarshalleseMenomineeMexicanMexican American IndianMongolianMoroccanNative HawaiianNavajoNepaleseNew ZealanderNicaraguanNigerianNorthern EuropeanNorwegianOkinawanOsageOttawaPaiutePakistaniPalestinianPanamanianParaguayanPennsylvania GermanPeruvianPimaPolishPortuguesePotawatomiPuebloPuerto RicanPuget Sound SalishRomanianRussianSalvadoranSamoanScandinavianScotch-IrishScottishSeminoleSenegaleseSerbianShoshoneSierra LeoneanSiouxSlavicSlovakSloveneSomaliSouth AfricanSouth AmericanSouth American IndianSoviet UnionSpaniardSpanishSpanish AmericanSpanish American IndianSri LankanSubsaharan AfricanSudaneseSwedishSwissSyrianTaiwaneseThaiTlingit-HaidaTohono O'OdhamTonganTrinidadian and TobagonianTsimshianTurkishU.S. Virgin IslanderUgandanUkrainianUruguayanUteVenezuelanVietnameseWelshWest IndianYakamaYaquiYugoslavianYumanYup'ikZimbabwean
Immigrant Origin (Total)
AfghanistanAfricaAlbaniaArgentinaArmeniaAsiaAustraliaAustriaAzoresBahamasBangladeshBarbadosBelarusBelgiumBelizeBoliviaBosnia and HerzegovinaBrazilBulgariaBurma / MyanmarCabo VerdeCambodiaCameroonCanadaCaribbeanCentral AmericaChileChinaColombiaCongoCosta RicaCroatiaCubaCzechoslovakiaDenmarkDominicaDominican RepublicEastern AfricaEastern AsiaEastern EuropeEcuadorEgyptEl SalvadorEnglandEritreaEthiopiaEuropeFijiFranceGermanyGhanaGreeceGrenadaGuatemalaGuyanaHaitiHondurasHong KongHungaryIndiaIndonesiaIranIraqIrelandIsraelItalyJamaicaJapanJordanKazakhstanKenyaKoreaKuwaitLaosLatin AmericaLatviaLebanonLiberiaLithuaniaMalaysiaMexicoMicronesiaMiddle AfricaMoldovaMoroccoNepalNetherlandsNicaraguaNigeriaNorth MacedoniaNorthern AfricaNorthern EuropeNorwayOceaniaPakistanPanamaPeruPhilippinesPolandPortugalRomaniaRussiaSaudi ArabiaScotlandSenegalSerbiaSierra LeoneSingaporeSomaliaSouth AfricaSouth AmericaSouth Central AsiaSouth Eastern AsiaSouthern EuropeSpainSri LankaSt. Vincent and the GrenadinesSudanSwedenSwitzerlandSyriaTaiwanThailandTrinidad and TobagoTurkeyUgandaUkraineUruguayUzbekistanVenezuelaVietnamWest IndiesWestern AfricaWestern AsiaWestern EuropeYemenZaireZimbabwe
Immigrant Origin (Percentage)
AfghanistanAfricaAlbaniaArgentinaArmeniaAsiaAustraliaAustriaAzoresBahamasBangladeshBarbadosBelarusBelgiumBelizeBoliviaBosnia and HerzegovinaBrazilBulgariaBurma / MyanmarCabo VerdeCambodiaCameroonCanadaCaribbeanCentral AmericaChileChinaColombiaCongoCosta RicaCroatiaCubaCzechoslovakiaDenmarkDominicaDominican RepublicEastern AfricaEastern AsiaEastern EuropeEcuadorEgyptEl SalvadorEnglandEritreaEthiopiaEuropeFijiFranceGermanyGhanaGreeceGrenadaGuatemalaGuyanaHaitiHondurasHong KongHungaryIndiaIndonesiaIranIraqIrelandIsraelItalyJamaicaJapanJordanKazakhstanKenyaKoreaKuwaitLaosLatin AmericaLatviaLebanonLiberiaLithuaniaMalaysiaMexicoMicronesiaMiddle AfricaMoldovaMoroccoNepalNetherlandsNicaraguaNigeriaNorth MacedoniaNorthern AfricaNorthern EuropeNorwayOceaniaPakistanPanamaPeruPhilippinesPolandPortugalRomaniaRussiaSaudi ArabiaScotlandSenegalSerbiaSierra LeoneSingaporeSomaliaSouth AfricaSouth AmericaSouth Central AsiaSouth Eastern AsiaSouthern EuropeSpainSri LankaSt. Vincent and the GrenadinesSudanSwedenSwitzerlandSyriaTaiwanThailandTrinidad and TobagoTurkeyUgandaUkraineUruguayUzbekistanVenezuelaVietnamWest IndiesWestern AfricaWestern AsiaWestern EuropeYemenZaireZimbabwe
Income
Income (Families)
Income (Households)
Poverty
Poverty (Families)
Unemployment
Employment Occupations
Employment Industries
Employer Class
Commute Time
Commute Means
School Enrollment
Education by Degree Field
Occupancy
Finances
Physical Characteristics
Georgia
Compare Cities
Comparison Subject

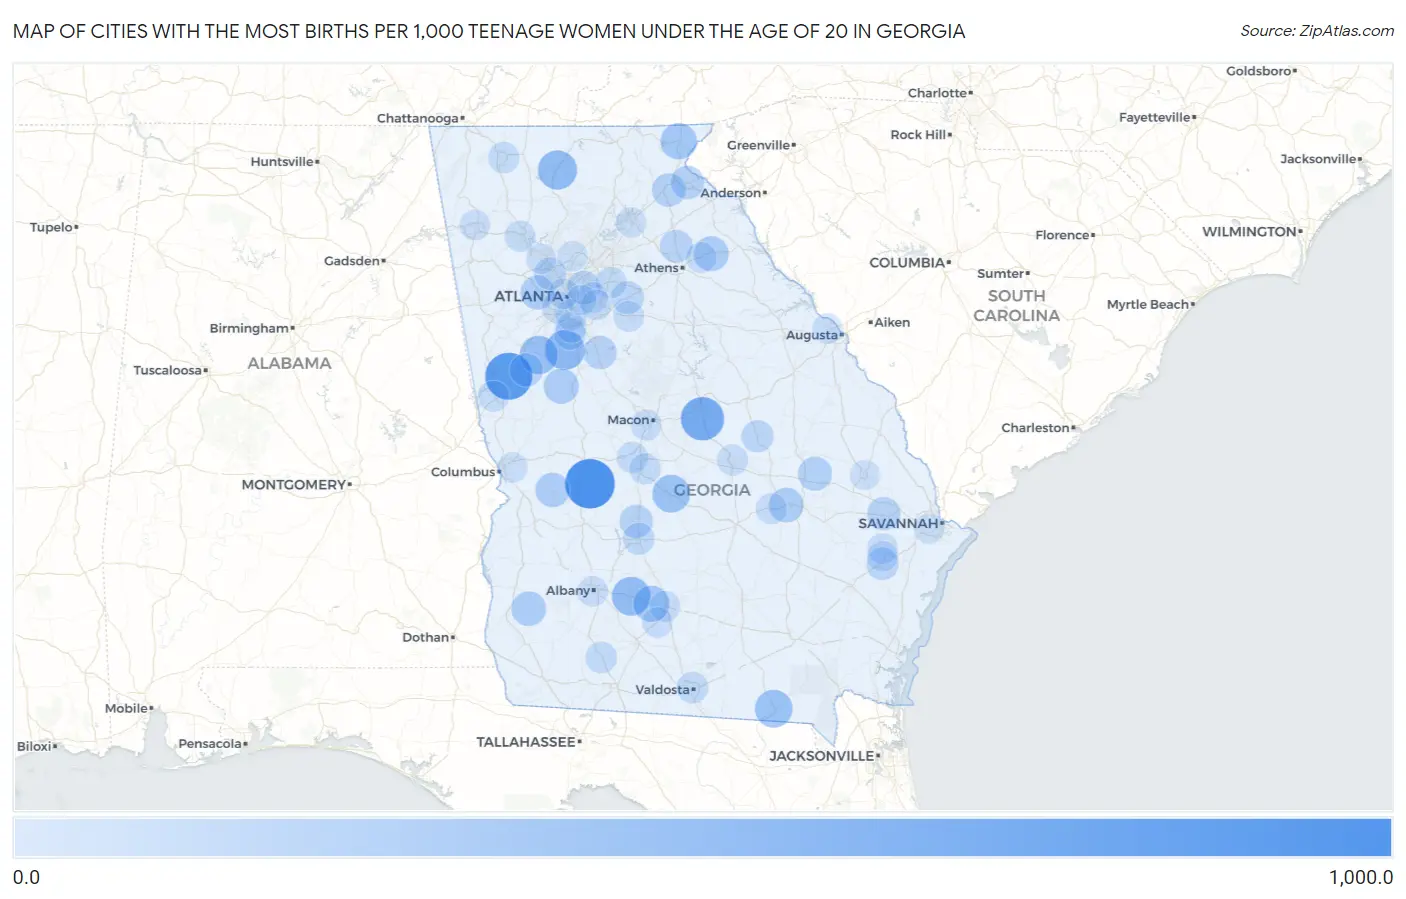
Map of Cities with the Most Births per 1,000 Teenage Women Under the Age of 20 in Georgia

0.0
1,000.0
Cities with the Most Births per 1,000 Teenage Women Under the Age of 20 in Georgia Map

Cities with the Most Births per 1,000 Teenage Women Under the Age of 20 in Georgia

City Births / 1,000 Women vs State vs National
1.Ideal888.013.0(+875)#110.0(+878)#53
2.Hogansville775.013.0(+762)#210.0(+765)#60
3.Mcintyre595.013.0(+582)#310.0(+585)#101
4.Woolsey429.013.0(+416)#410.0(+419)#168
5.East Ellijay400.013.0(+387)#510.0(+390)#188
6.Sylvester382.013.0(+369)#610.0(+372)#202
7.Turin364.013.0(+351)#710.0(+354)#214
8.Hawkinsville333.013.0(+320)#810.0(+323)#232
9.Fargo333.013.0(+320)#910.0(+323)#241
10.Clayton271.013.0(+258)#1010.0(+261)#310
11.Ty Ty267.013.0(+254)#1110.0(+257)#316
12.Comer218.013.0(+205)#1210.0(+208)#393
13.Concord217.013.0(+204)#1310.0(+207)#394
14.Arlington200.013.0(+187)#1410.0(+190)#422
15.Higgston196.013.0(+183)#1510.0(+186)#445
16.Buena Vista189.013.0(+176)#1610.0(+179)#463
17.Lithia Springs178.013.0(+165)#1710.0(+168)#490
18.Stillmore172.013.0(+159)#1810.0(+162)#506
19.Mount Airy154.013.0(+141)#1910.0(+144)#572
20.Toccoa149.013.0(+136)#2010.0(+139)#590
21.Luthersville143.013.0(+130)#2110.0(+133)#618
22.Locust Grove141.013.0(+128)#2210.0(+131)#630
23.Clarkston140.013.0(+127)#2310.0(+130)#632
24.Vienna140.013.0(+127)#2410.0(+130)#633
25.Pembroke139.013.0(+126)#2510.0(+129)#636
26.Nicholson120.013.0(+107)#2610.0(+110)#710
27.Walnut Grove111.013.0(+98.0)#2710.0(+101)#758
28.Walthourville100.013.0(+87.0)#2810.0(+90.0)#830
29.Wrightsville90.013.0(+77.0)#2910.0(+80.0)#889
30.Fair Oaks86.013.0(+73.0)#3010.0(+76.0)#912
31.Irondale80.013.0(+67.0)#3110.0(+70.0)#958
32.Cordele75.013.0(+62.0)#3210.0(+65.0)#996
33.Valdosta65.013.0(+52.0)#3310.0(+55.0)#1,064
34.Meigs61.013.0(+48.0)#3410.0(+51.0)#1,116
35.Dalton53.013.0(+40.0)#3510.0(+43.0)#1,176
36.Fort Valley48.013.0(+35.0)#3610.0(+38.0)#1,240
37.Perry47.013.0(+34.0)#3710.0(+37.0)#1,249
38.Snellville44.013.0(+31.0)#3810.0(+34.0)#1,288
39.Forest Park44.013.0(+31.0)#3910.0(+34.0)#1,290
40.Cartersville41.013.0(+28.0)#4010.0(+31.0)#1,329
41.Dublin40.013.0(+27.0)#4110.0(+30.0)#1,340
42.Mount Vernon40.013.0(+27.0)#4210.0(+30.0)#1,346
43.Macon Bibb County36.013.0(+23.0)#4310.0(+26.0)#1,396
44.East Point36.013.0(+23.0)#4410.0(+26.0)#1,398
45.Redan33.013.0(+20.0)#4510.0(+23.0)#1,452
46.Lagrange33.013.0(+20.0)#4610.0(+23.0)#1,453
47.Covington32.013.0(+19.0)#4710.0(+22.0)#1,470
48.Tifton30.013.0(+17.0)#4810.0(+20.0)#1,507
49.Colbert29.013.0(+16.0)#4910.0(+19.0)#1,539
50.Augusta-Richmond County Consolidated Government (Balance)28.013.0(+15.0)#5010.0(+18.0)#1,541
51.Stonecrest28.013.0(+15.0)#5110.0(+18.0)#1,545
52.Albany27.013.0(+14.0)#5210.0(+17.0)#1,554
53.Atlanta26.013.0(+13.0)#5310.0(+16.0)#1,580
54.Rome22.013.0(+9.00)#5410.0(+12.0)#1,693
55.Fort Stewart22.013.0(+9.00)#5510.0(+12.0)#1,708
56.Omega19.013.0(+6.00)#5610.0(+9.00)#1,775
57.Jonesboro15.013.0(+2.00)#5710.0(+5.00)#1,897
58.Hinesville14.013.0(+1.000)#5810.0(+4.00)#1,921
59.Martinez13.013.0(=0.000)#5910.0(+3.00)#1,955
60.Candler Mcafee11.013.0(-2.00)#6010.0(+1.000)#2,042
61.Columbus10.013.0(-3.00)#6110.0(=0.000)#2,057
62.Roswell8.013.0(-5.00)#6210.0(-2.00)#2,139
63.Savannah7.013.0(-6.00)#6310.0(-3.00)#2,178
64.Kennesaw7.013.0(-6.00)#6410.0(-3.00)#2,199
65.Gainesville6.013.0(-7.00)#6510.0(-4.00)#2,237
66.Statesboro5.013.0(-8.00)#6610.0(-5.00)#2,276

Common Questions

What are the Top 10 Cities with the Most Births per 1,000 Teenage Women Under the Age of 20 in Georgia?
Top 10 Cities with the Most Births per 1,000 Teenage Women Under the Age of 20 in Georgia are:
#1
888.0
#2
775.0
#3
595.0
#4
429.0
#5
400.0
#6
382.0
#7
364.0
#8
333.0
#9
333.0
#10
271.0
What city has the Most Births per 1,000 Teenage Women Under the Age of 20 in Georgia?
Ideal has the Most Births per 1,000 Teenage Women Under the Age of 20 in Georgia with 888.0.
What is the Number of Births per 1,000 Teenage Women Under the Age of 20 in the State of Georgia?
Number of Births per 1,000 Teenage Women Under the Age of 20 in Georgia is 13.0.
What is the Number of Births per 1,000 Teenage Women Under the Age of 20 in the United States?
Number of Births per 1,000 Teenage Women Under the Age of 20 in the United States is 10.0.