Cities with the Most Births per 1,000 Teenage Women Under the Age of 20 in Illinois
RELATED REPORTS & OPTIONS
Highest Birth Rate | Women 15-19
Illinois
Compare Cities
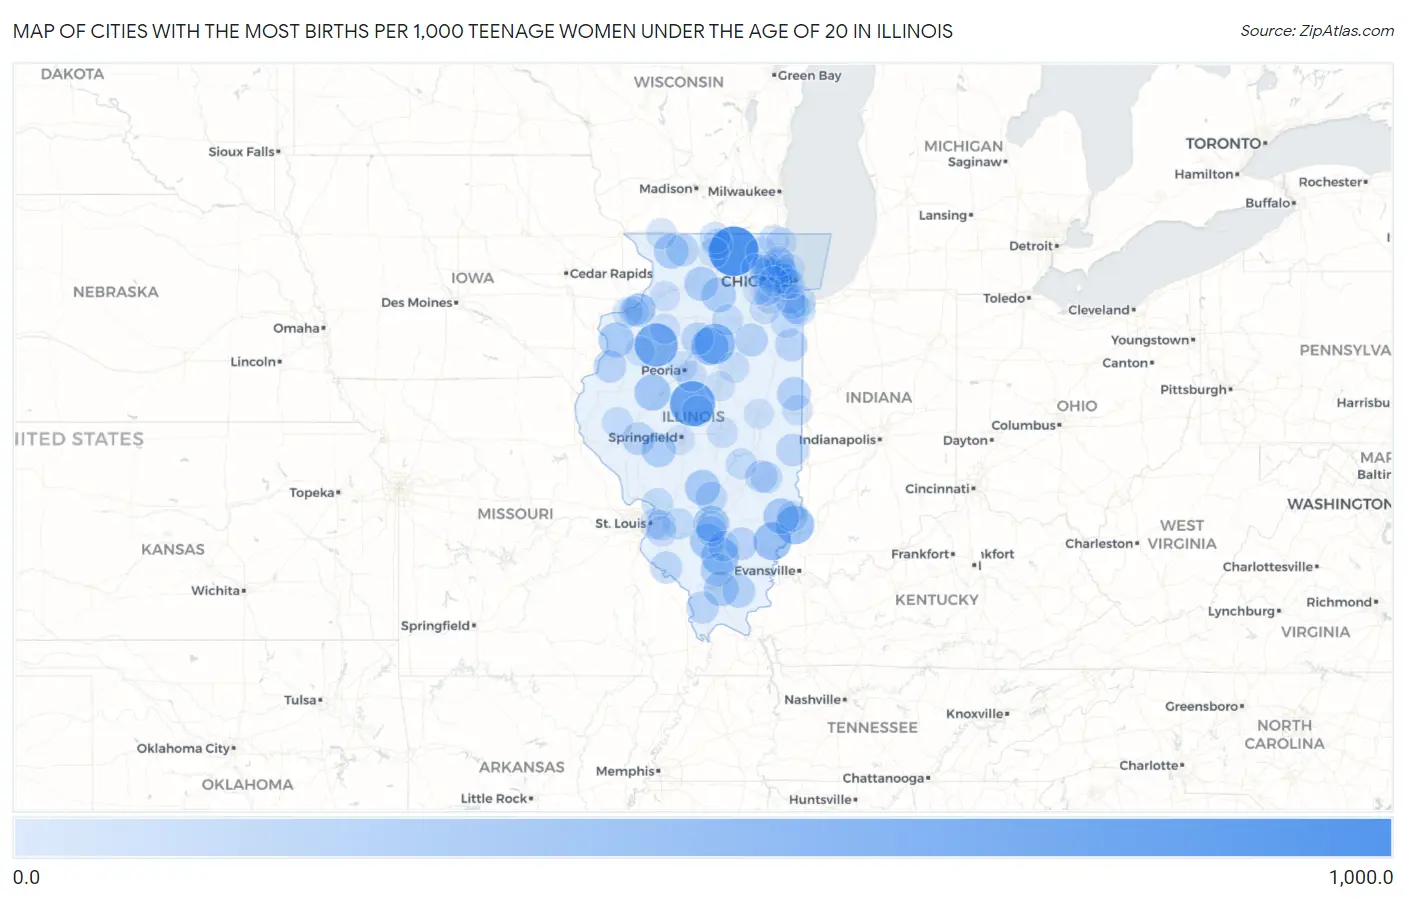
Map of Cities with the Most Births per 1,000 Teenage Women Under the Age of 20 in Illinois
0.0
1,000.0
Cities with the Most Births per 1,000 Teenage Women Under the Age of 20 in Illinois
| City | Births / 1,000 Women | vs State | vs National | |
| 1. | Garden Prairie | 1,000.0 | 7.0(+993)#1 | 10.0(+990)#29 |
| 2. | Hartsburg | 762.0 | 7.0(+755)#2 | 10.0(+752)#63 |
| 3. | Victoria | 667.0 | 7.0(+660)#3 | 10.0(+657)#79 |
| 4. | Wenona | 500.0 | 7.0(+493)#4 | 10.0(+490)#124 |
| 5. | St Francisville | 417.0 | 7.0(+410)#5 | 10.0(+407)#174 |
| 6. | Albion | 394.0 | 7.0(+387)#6 | 10.0(+384)#196 |
| 7. | Nason | 375.0 | 7.0(+368)#7 | 10.0(+365)#208 |
| 8. | Toluca | 370.0 | 7.0(+363)#8 | 10.0(+360)#210 |
| 9. | Lewistown | 300.0 | 7.0(+293)#9 | 10.0(+290)#272 |
| 10. | Sandoval | 286.0 | 7.0(+279)#10 | 10.0(+276)#287 |
| 11. | Sumner | 275.0 | 7.0(+268)#11 | 10.0(+265)#303 |
| 12. | Fillmore | 250.0 | 7.0(+243)#12 | 10.0(+240)#341 |
| 13. | Seaton | 250.0 | 7.0(+243)#13 | 10.0(+240)#342 |
| 14. | Richview | 250.0 | 7.0(+243)#14 | 10.0(+240)#343 |
| 15. | Marion | 232.0 | 7.0(+225)#15 | 10.0(+222)#358 |
| 16. | Pearl City | 227.0 | 7.0(+220)#16 | 10.0(+217)#376 |
| 17. | Paw Paw | 219.0 | 7.0(+212)#17 | 10.0(+209)#390 |
| 18. | Franklin Grove | 207.0 | 7.0(+200)#18 | 10.0(+197)#412 |
| 19. | Franklin | 207.0 | 7.0(+200)#19 | 10.0(+197)#413 |
| 20. | Stone Park | 204.0 | 7.0(+197)#20 | 10.0(+194)#418 |
| 21. | Carbon Cliff | 168.0 | 7.0(+161)#21 | 10.0(+158)#516 |
| 22. | Rossville | 167.0 | 7.0(+160)#22 | 10.0(+157)#523 |
| 23. | Buckner | 167.0 | 7.0(+160)#23 | 10.0(+157)#528 |
| 24. | Carrier Mills | 155.0 | 7.0(+148)#24 | 10.0(+145)#569 |
| 25. | Dwight | 145.0 | 7.0(+138)#25 | 10.0(+135)#611 |
| 26. | Chapin | 143.0 | 7.0(+136)#26 | 10.0(+133)#620 |
| 27. | Stronghurst | 133.0 | 7.0(+126)#27 | 10.0(+123)#658 |
| 28. | Wayne City | 132.0 | 7.0(+125)#28 | 10.0(+122)#665 |
| 29. | Henry | 128.0 | 7.0(+121)#29 | 10.0(+118)#679 |
| 30. | Freeport | 125.0 | 7.0(+118)#30 | 10.0(+115)#687 |
| 31. | St Anne | 120.0 | 7.0(+113)#31 | 10.0(+110)#713 |
| 32. | Jonesboro | 118.0 | 7.0(+111)#32 | 10.0(+108)#719 |
| 33. | Paris | 117.0 | 7.0(+110)#33 | 10.0(+107)#725 |
| 34. | Ellis Grove | 107.0 | 7.0(+100.0)#34 | 10.0(+97.0)#795 |
| 35. | Toledo | 104.0 | 7.0(+97.0)#35 | 10.0(+94.0)#807 |
| 36. | Greenup | 89.0 | 7.0(+82.0)#36 | 10.0(+79.0)#895 |
| 37. | Vandalia | 84.0 | 7.0(+77.0)#37 | 10.0(+74.0)#932 |
| 38. | Wood Dale | 77.0 | 7.0(+70.0)#38 | 10.0(+67.0)#980 |
| 39. | Sauk Village | 68.0 | 7.0(+61.0)#39 | 10.0(+58.0)#1,039 |
| 40. | Rosewood Heights | 68.0 | 7.0(+61.0)#40 | 10.0(+58.0)#1,042 |
| 41. | Calumet City | 64.0 | 7.0(+57.0)#41 | 10.0(+54.0)#1,080 |
| 42. | Lincoln | 64.0 | 7.0(+57.0)#42 | 10.0(+54.0)#1,083 |
| 43. | Trenton | 64.0 | 7.0(+57.0)#43 | 10.0(+54.0)#1,085 |
| 44. | Bloomingdale | 61.0 | 7.0(+54.0)#44 | 10.0(+51.0)#1,110 |
| 45. | La Grange | 56.0 | 7.0(+49.0)#45 | 10.0(+46.0)#1,153 |
| 46. | Windsor | 53.0 | 7.0(+46.0)#46 | 10.0(+43.0)#1,186 |
| 47. | Ottawa | 52.0 | 7.0(+45.0)#47 | 10.0(+42.0)#1,194 |
| 48. | Rockton | 52.0 | 7.0(+45.0)#48 | 10.0(+42.0)#1,199 |
| 49. | Oakwood Hills | 51.0 | 7.0(+44.0)#49 | 10.0(+41.0)#1,207 |
| 50. | Lawrenceville | 49.0 | 7.0(+42.0)#50 | 10.0(+39.0)#1,228 |
| 51. | Peotone | 48.0 | 7.0(+41.0)#51 | 10.0(+38.0)#1,244 |
| 52. | Junction City | 47.0 | 7.0(+40.0)#52 | 10.0(+37.0)#1,259 |
| 53. | Mount Sterling | 45.0 | 7.0(+38.0)#53 | 10.0(+35.0)#1,273 |
| 54. | Lisle | 43.0 | 7.0(+36.0)#54 | 10.0(+33.0)#1,302 |
| 55. | East Moline | 41.0 | 7.0(+34.0)#55 | 10.0(+31.0)#1,330 |
| 56. | East St Louis | 40.0 | 7.0(+33.0)#56 | 10.0(+30.0)#1,338 |
| 57. | Warren | 40.0 | 7.0(+33.0)#57 | 10.0(+30.0)#1,347 |
| 58. | Chenoa | 38.0 | 7.0(+31.0)#58 | 10.0(+28.0)#1,369 |
| 59. | Decatur | 37.0 | 7.0(+30.0)#59 | 10.0(+27.0)#1,377 |
| 60. | Mount Vernon | 36.0 | 7.0(+29.0)#60 | 10.0(+26.0)#1,403 |
| 61. | Danville | 35.0 | 7.0(+28.0)#61 | 10.0(+25.0)#1,419 |
| 62. | Joliet | 33.0 | 7.0(+26.0)#62 | 10.0(+23.0)#1,448 |
| 63. | Schaumburg | 33.0 | 7.0(+26.0)#63 | 10.0(+23.0)#1,449 |
| 64. | Morton | 32.0 | 7.0(+25.0)#64 | 10.0(+22.0)#1,467 |
| 65. | Hazel Crest | 32.0 | 7.0(+25.0)#65 | 10.0(+22.0)#1,471 |
| 66. | Rock Island | 31.0 | 7.0(+24.0)#66 | 10.0(+21.0)#1,480 |
| 67. | Hanover Park | 31.0 | 7.0(+24.0)#67 | 10.0(+21.0)#1,481 |
| 68. | Prospect Heights | 30.0 | 7.0(+23.0)#68 | 10.0(+20.0)#1,508 |
| 69. | Kewanee | 25.0 | 7.0(+18.0)#69 | 10.0(+15.0)#1,620 |
| 70. | Peoria | 24.0 | 7.0(+17.0)#70 | 10.0(+14.0)#1,627 |
| 71. | Streamwood | 24.0 | 7.0(+17.0)#71 | 10.0(+14.0)#1,633 |
| 72. | Rosemont | 24.0 | 7.0(+17.0)#72 | 10.0(+14.0)#1,647 |
| 73. | Fairview Heights | 22.0 | 7.0(+15.0)#73 | 10.0(+12.0)#1,704 |
| 74. | Lindenhurst | 21.0 | 7.0(+14.0)#74 | 10.0(+11.0)#1,723 |
| 75. | Crestwood | 21.0 | 7.0(+14.0)#75 | 10.0(+11.0)#1,724 |
| 76. | Berwyn | 19.0 | 7.0(+12.0)#76 | 10.0(+9.00)#1,756 |
| 77. | Centralia | 19.0 | 7.0(+12.0)#77 | 10.0(+9.00)#1,771 |
| 78. | Des Plaines | 18.0 | 7.0(+11.0)#78 | 10.0(+8.00)#1,786 |
| 79. | Chicago Heights | 18.0 | 7.0(+11.0)#79 | 10.0(+8.00)#1,795 |
| 80. | Moline | 17.0 | 7.0(+10.00)#80 | 10.0(+7.00)#1,825 |
| 81. | Belleville | 17.0 | 7.0(+10.00)#81 | 10.0(+7.00)#1,826 |
| 82. | Waukegan | 16.0 | 7.0(+9.00)#82 | 10.0(+6.00)#1,848 |
| 83. | Romeoville | 15.0 | 7.0(+8.00)#83 | 10.0(+5.00)#1,883 |
| 84. | Prophetstown | 15.0 | 7.0(+8.00)#84 | 10.0(+5.00)#1,898 |
| 85. | Hoffman Estates | 13.0 | 7.0(+6.00)#85 | 10.0(+3.00)#1,952 |
| 86. | Melrose Park | 13.0 | 7.0(+6.00)#86 | 10.0(+3.00)#1,956 |
| 87. | Machesney Park | 13.0 | 7.0(+6.00)#87 | 10.0(+3.00)#1,957 |
| 88. | Champaign | 10.0 | 7.0(+3.00)#88 | 10.0(=0.000)#2,065 |
| 89. | Rockford | 9.0 | 7.0(+2.00)#89 | 10.0(-1.000)#2,096 |
| 90. | Chicago | 8.0 | 7.0(+1.000)#90 | 10.0(-2.00)#2,125 |
| 91. | Wheeling | 8.0 | 7.0(+1.000)#91 | 10.0(-2.00)#2,156 |
| 92. | Naperville | 5.0 | 7.0(-2.00)#92 | 10.0(-5.00)#2,255 |
| 93. | Springfield | 4.0 | 7.0(-3.00)#93 | 10.0(-6.00)#2,308 |
| 94. | Elgin | 4.0 | 7.0(-3.00)#94 | 10.0(-6.00)#2,309 |
| 95. | Bloomington | 4.0 | 7.0(-3.00)#95 | 10.0(-6.00)#2,317 |
| 96. | Aurora | 3.0 | 7.0(-4.00)#96 | 10.0(-7.00)#2,342 |
| 97. | Skokie | 3.0 | 7.0(-4.00)#97 | 10.0(-7.00)#2,358 |
| 98. | Galesburg | 3.0 | 7.0(-4.00)#98 | 10.0(-7.00)#2,365 |
| 99. | Lombard | 2.0 | 7.0(-5.00)#99 | 10.0(-8.00)#2,392 |
Common Questions
What are the Top 10 Cities with the Most Births per 1,000 Teenage Women Under the Age of 20 in Illinois?
Top 10 Cities with the Most Births per 1,000 Teenage Women Under the Age of 20 in Illinois are:
#1
1,000.0
#2
762.0
#3
667.0
#4
500.0
#5
417.0
#6
394.0
#7
375.0
#8
370.0
#9
300.0
#10
286.0
What city has the Most Births per 1,000 Teenage Women Under the Age of 20 in Illinois?
Garden Prairie has the Most Births per 1,000 Teenage Women Under the Age of 20 in Illinois with 1,000.0.
What is the Number of Births per 1,000 Teenage Women Under the Age of 20 in the State of Illinois?
Number of Births per 1,000 Teenage Women Under the Age of 20 in Illinois is 7.0.
What is the Number of Births per 1,000 Teenage Women Under the Age of 20 in the United States?
Number of Births per 1,000 Teenage Women Under the Age of 20 in the United States is 10.0.