Cities with the Most Births per 1,000 Teenage Women Under the Age of 20 in Louisiana

RELATED REPORTS & OPTIONS

Highest Birth Rate | Women 15-19
Population
Families and Households
Female Fertility
Female Fertility (Unmarried)
Race (Community Size)
Race (Percentage)
Ancestry (Community Size)
AfghanAfricanAlaska NativeAlaskan AthabascanAlbanianAleutAlsatianAmericanApacheArabArapahoArgentineanArmenianAssyrian / Chaldean / SyriacAustralianAustrianBahamianBangladeshiBarbadianBasqueBelgianBelizeanBermudanBhutaneseBlackfeetBolivianBrazilianBritishBritish West IndianBulgarianBurmeseCajunCambodianCanadianCape VerdeanCarpatho RusynCelticCentral AmericanCentral American IndianCherokeeCheyenneChickasawChileanChineseChippewaChoctawColombianColvilleComancheCosta RicanCreeCreekCroatianCrowCubanCypriotCzechCzechoslovakianDanishDelawareDominicanDutchDutch West IndianEastern EuropeanEcuadorianEgyptianEnglishEstonianEthiopianEuropeanFijianFilipinoFinnishFrenchFrench American IndianFrench CanadianGermanGerman RussianGhanaianGreekGuamanian / ChamorroGuatemalanGuyaneseHaitianHmongHonduranHopiHoumaHungarianIcelanderIndian (Asian)IndonesianInupiatIranianIraqiIrishIroquoisIsraeliItalianJamaicanJapaneseJordanianKenyanKiowaKoreanLaotianLatvianLebaneseLiberianLithuanianLumbeeLuxembourgerMacedonianMalaysianMalteseMarshalleseMenomineeMexicanMexican American IndianMongolianMoroccanNative HawaiianNavajoNepaleseNew ZealanderNicaraguanNigerianNorthern EuropeanNorwegianOkinawanOsageOttawaPaiutePakistaniPalestinianPanamanianParaguayanPennsylvania GermanPeruvianPimaPolishPortuguesePotawatomiPuebloPuerto RicanPuget Sound SalishRomanianRussianSalvadoranSamoanScandinavianScotch-IrishScottishSeminoleSenegaleseSerbianShoshoneSierra LeoneanSiouxSlavicSlovakSloveneSomaliSouth AfricanSouth AmericanSouth American IndianSoviet UnionSpaniardSpanishSpanish AmericanSpanish American IndianSri LankanSubsaharan AfricanSudaneseSwedishSwissSyrianTaiwaneseThaiTlingit-HaidaTohono O'OdhamTonganTrinidadian and TobagonianTsimshianTurkishU.S. Virgin IslanderUgandanUkrainianUruguayanUteVenezuelanVietnameseWelshWest IndianYakamaYaquiYugoslavianYumanYup'ikZimbabwean
Ancestry (Percentage)
AfghanAfricanAlaska NativeAlaskan AthabascanAlbanianAleutAlsatianAmericanApacheArabArapahoArgentineanArmenianAssyrian / Chaldean / SyriacAustralianAustrianBahamianBangladeshiBarbadianBasqueBelgianBelizeanBermudanBhutaneseBlackfeetBolivianBrazilianBritishBritish West IndianBulgarianBurmeseCajunCambodianCanadianCape VerdeanCarpatho RusynCelticCentral AmericanCentral American IndianCherokeeCheyenneChickasawChileanChineseChippewaChoctawColombianColvilleComancheCosta RicanCreeCreekCroatianCrowCubanCypriotCzechCzechoslovakianDanishDelawareDominicanDutchDutch West IndianEastern EuropeanEcuadorianEgyptianEnglishEstonianEthiopianEuropeanFijianFilipinoFinnishFrenchFrench American IndianFrench CanadianGermanGerman RussianGhanaianGreekGuamanian / ChamorroGuatemalanGuyaneseHaitianHmongHonduranHopiHoumaHungarianIcelanderIndian (Asian)IndonesianInupiatIranianIraqiIrishIroquoisIsraeliItalianJamaicanJapaneseJordanianKenyanKiowaKoreanLaotianLatvianLebaneseLiberianLithuanianLumbeeLuxembourgerMacedonianMalaysianMalteseMarshalleseMenomineeMexicanMexican American IndianMongolianMoroccanNative HawaiianNavajoNepaleseNew ZealanderNicaraguanNigerianNorthern EuropeanNorwegianOkinawanOsageOttawaPaiutePakistaniPalestinianPanamanianParaguayanPennsylvania GermanPeruvianPimaPolishPortuguesePotawatomiPuebloPuerto RicanPuget Sound SalishRomanianRussianSalvadoranSamoanScandinavianScotch-IrishScottishSeminoleSenegaleseSerbianShoshoneSierra LeoneanSiouxSlavicSlovakSloveneSomaliSouth AfricanSouth AmericanSouth American IndianSoviet UnionSpaniardSpanishSpanish AmericanSpanish American IndianSri LankanSubsaharan AfricanSudaneseSwedishSwissSyrianTaiwaneseThaiTlingit-HaidaTohono O'OdhamTonganTrinidadian and TobagonianTsimshianTurkishU.S. Virgin IslanderUgandanUkrainianUruguayanUteVenezuelanVietnameseWelshWest IndianYakamaYaquiYugoslavianYumanYup'ikZimbabwean
Immigrant Origin (Total)
AfghanistanAfricaAlbaniaArgentinaArmeniaAsiaAustraliaAustriaAzoresBahamasBangladeshBarbadosBelarusBelgiumBelizeBoliviaBosnia and HerzegovinaBrazilBulgariaBurma / MyanmarCabo VerdeCambodiaCameroonCanadaCaribbeanCentral AmericaChileChinaColombiaCongoCosta RicaCroatiaCubaCzechoslovakiaDenmarkDominicaDominican RepublicEastern AfricaEastern AsiaEastern EuropeEcuadorEgyptEl SalvadorEnglandEritreaEthiopiaEuropeFijiFranceGermanyGhanaGreeceGrenadaGuatemalaGuyanaHaitiHondurasHong KongHungaryIndiaIndonesiaIranIraqIrelandIsraelItalyJamaicaJapanJordanKazakhstanKenyaKoreaKuwaitLaosLatin AmericaLatviaLebanonLiberiaLithuaniaMalaysiaMexicoMicronesiaMiddle AfricaMoldovaMoroccoNepalNetherlandsNicaraguaNigeriaNorth MacedoniaNorthern AfricaNorthern EuropeNorwayOceaniaPakistanPanamaPeruPhilippinesPolandPortugalRomaniaRussiaSaudi ArabiaScotlandSenegalSerbiaSierra LeoneSingaporeSomaliaSouth AfricaSouth AmericaSouth Central AsiaSouth Eastern AsiaSouthern EuropeSpainSri LankaSt. Vincent and the GrenadinesSudanSwedenSwitzerlandSyriaTaiwanThailandTrinidad and TobagoTurkeyUgandaUkraineUruguayUzbekistanVenezuelaVietnamWest IndiesWestern AfricaWestern AsiaWestern EuropeYemenZaireZimbabwe
Immigrant Origin (Percentage)
AfghanistanAfricaAlbaniaArgentinaArmeniaAsiaAustraliaAustriaAzoresBahamasBangladeshBarbadosBelarusBelgiumBelizeBoliviaBosnia and HerzegovinaBrazilBulgariaBurma / MyanmarCabo VerdeCambodiaCameroonCanadaCaribbeanCentral AmericaChileChinaColombiaCongoCosta RicaCroatiaCubaCzechoslovakiaDenmarkDominicaDominican RepublicEastern AfricaEastern AsiaEastern EuropeEcuadorEgyptEl SalvadorEnglandEritreaEthiopiaEuropeFijiFranceGermanyGhanaGreeceGrenadaGuatemalaGuyanaHaitiHondurasHong KongHungaryIndiaIndonesiaIranIraqIrelandIsraelItalyJamaicaJapanJordanKazakhstanKenyaKoreaKuwaitLaosLatin AmericaLatviaLebanonLiberiaLithuaniaMalaysiaMexicoMicronesiaMiddle AfricaMoldovaMoroccoNepalNetherlandsNicaraguaNigeriaNorth MacedoniaNorthern AfricaNorthern EuropeNorwayOceaniaPakistanPanamaPeruPhilippinesPolandPortugalRomaniaRussiaSaudi ArabiaScotlandSenegalSerbiaSierra LeoneSingaporeSomaliaSouth AfricaSouth AmericaSouth Central AsiaSouth Eastern AsiaSouthern EuropeSpainSri LankaSt. Vincent and the GrenadinesSudanSwedenSwitzerlandSyriaTaiwanThailandTrinidad and TobagoTurkeyUgandaUkraineUruguayUzbekistanVenezuelaVietnamWest IndiesWestern AfricaWestern AsiaWestern EuropeYemenZaireZimbabwe
Income
Income (Families)
Income (Households)
Poverty
Poverty (Families)
Unemployment
Employment Occupations
Employment Industries
Employer Class
Commute Time
Commute Means
School Enrollment
Education by Degree Field
Occupancy
Finances
Physical Characteristics
Louisiana
Compare Cities
Comparison Subject

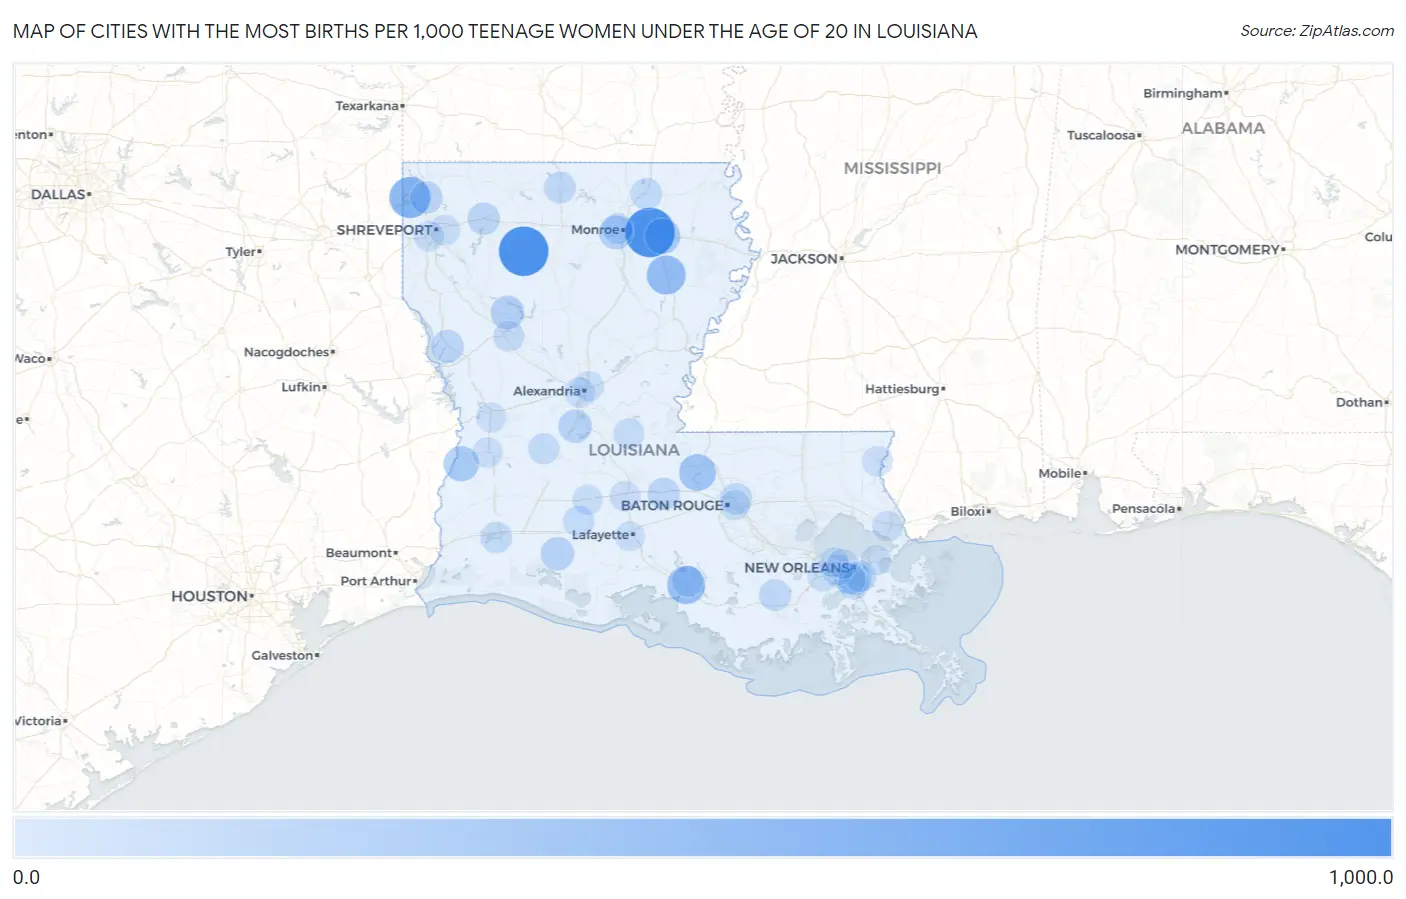
Map of Cities with the Most Births per 1,000 Teenage Women Under the Age of 20 in Louisiana

0.0
1,000.0
Cities with the Most Births per 1,000 Teenage Women Under the Age of 20 in Louisiana Map

Cities with the Most Births per 1,000 Teenage Women Under the Age of 20 in Louisiana

City Births / 1,000 Women vs State vs National
1.Start1,000.014.0(+986)#110.0(+990)#10
2.Bienville1,000.014.0(+986)#210.0(+990)#40
3.Oil City556.014.0(+542)#310.0(+546)#110
4.Winnsboro442.014.0(+428)#410.0(+432)#160
5.Baldwin400.014.0(+386)#510.0(+390)#184
6.New Roads333.014.0(+319)#610.0(+323)#231
7.Rayville275.014.0(+261)#710.0(+265)#302
8.Merryville250.014.0(+236)#810.0(+240)#334
9.Brownsville193.014.0(+179)#910.0(+183)#448
10.Campti175.014.0(+161)#1010.0(+165)#501
11.Forest Hill160.014.0(+146)#1110.0(+150)#546
12.Lake Arthur158.014.0(+144)#1210.0(+148)#555
13.Zwolle123.014.0(+109)#1310.0(+113)#699
14.Belcher111.014.0(+97.0)#1410.0(+101)#769
15.Dixie Inn111.014.0(+97.0)#1510.0(+101)#770
16.Krotz Springs108.014.0(+94.0)#1610.0(+98.0)#784
17.Harvey107.014.0(+93.0)#1710.0(+97.0)#785
18.Lafourche Crossing86.014.0(+72.0)#1810.0(+76.0)#913
19.Bernice85.014.0(+71.0)#1910.0(+75.0)#926
20.Merrydale82.014.0(+68.0)#2010.0(+72.0)#943
21.Bastrop72.014.0(+58.0)#2110.0(+62.0)#1,013
22.Lake Charles71.014.0(+57.0)#2210.0(+61.0)#1,016
23.Woodmere68.014.0(+54.0)#2310.0(+58.0)#1,038
24.Terrytown65.014.0(+51.0)#2410.0(+55.0)#1,067
25.Marrero59.014.0(+45.0)#2510.0(+49.0)#1,133
26.Elizabeth54.014.0(+40.0)#2610.0(+44.0)#1,175
27.Iota50.014.0(+36.0)#2710.0(+40.0)#1,217
28.Charenton45.014.0(+31.0)#2810.0(+35.0)#1,282
29.Cottonport41.014.0(+27.0)#2910.0(+31.0)#1,333
30.River Ridge36.014.0(+22.0)#3010.0(+26.0)#1,404
31.Natchitoches33.014.0(+19.0)#3110.0(+23.0)#1,455
32.West Monroe33.014.0(+19.0)#3210.0(+23.0)#1,458
33.Opelousas26.014.0(+12.0)#3310.0(+16.0)#1,593
34.Slidell23.014.0(+9.00)#3410.0(+13.0)#1,660
35.Bossier City22.014.0(+8.00)#3510.0(+12.0)#1,688
36.Deridder21.014.0(+7.00)#3610.0(+11.0)#1,726
37.Pineville19.014.0(+5.00)#3710.0(+9.00)#1,768
38.Shreveport17.014.0(+3.00)#3810.0(+7.00)#1,812
39.Eunice17.014.0(+3.00)#3910.0(+7.00)#1,833
40.Alexandria16.014.0(+2.00)#4010.0(+6.00)#1,853
41.Bogalusa16.014.0(+2.00)#4110.0(+6.00)#1,862
42.Luling13.014.0(-1.000)#4210.0(+3.00)#1,962
43.Kenner12.014.0(-2.00)#4310.0(+2.00)#1,989
44.Leesville12.014.0(-2.00)#4410.0(+2.00)#2,002
45.New Orleans11.014.0(-3.00)#4510.0(+1.000)#2,010
46.Baton Rouge7.014.0(-7.00)#4610.0(-3.00)#2,172
47.Metairie4.014.0(-10.00)#4710.0(-6.00)#2,302
48.Lafayette4.014.0(-10.00)#4810.0(-6.00)#2,305

Common Questions

What are the Top 10 Cities with the Most Births per 1,000 Teenage Women Under the Age of 20 in Louisiana?
Top 10 Cities with the Most Births per 1,000 Teenage Women Under the Age of 20 in Louisiana are:
#1
1,000.0
#2
1,000.0
#3
556.0
#4
442.0
#5
400.0
#6
333.0
#7
275.0
#8
250.0
#9
193.0
#10
175.0
What city has the Most Births per 1,000 Teenage Women Under the Age of 20 in Louisiana?
Start has the Most Births per 1,000 Teenage Women Under the Age of 20 in Louisiana with 1,000.0.
What is the Number of Births per 1,000 Teenage Women Under the Age of 20 in the State of Louisiana?
Number of Births per 1,000 Teenage Women Under the Age of 20 in Louisiana is 14.0.
What is the Number of Births per 1,000 Teenage Women Under the Age of 20 in the United States?
Number of Births per 1,000 Teenage Women Under the Age of 20 in the United States is 10.0.