Cities with the Most Births per 1,000 Teenage Women Under the Age of 20 in Ohio
RELATED REPORTS & OPTIONS
Highest Birth Rate | Women 15-19
Ohio
Compare Cities
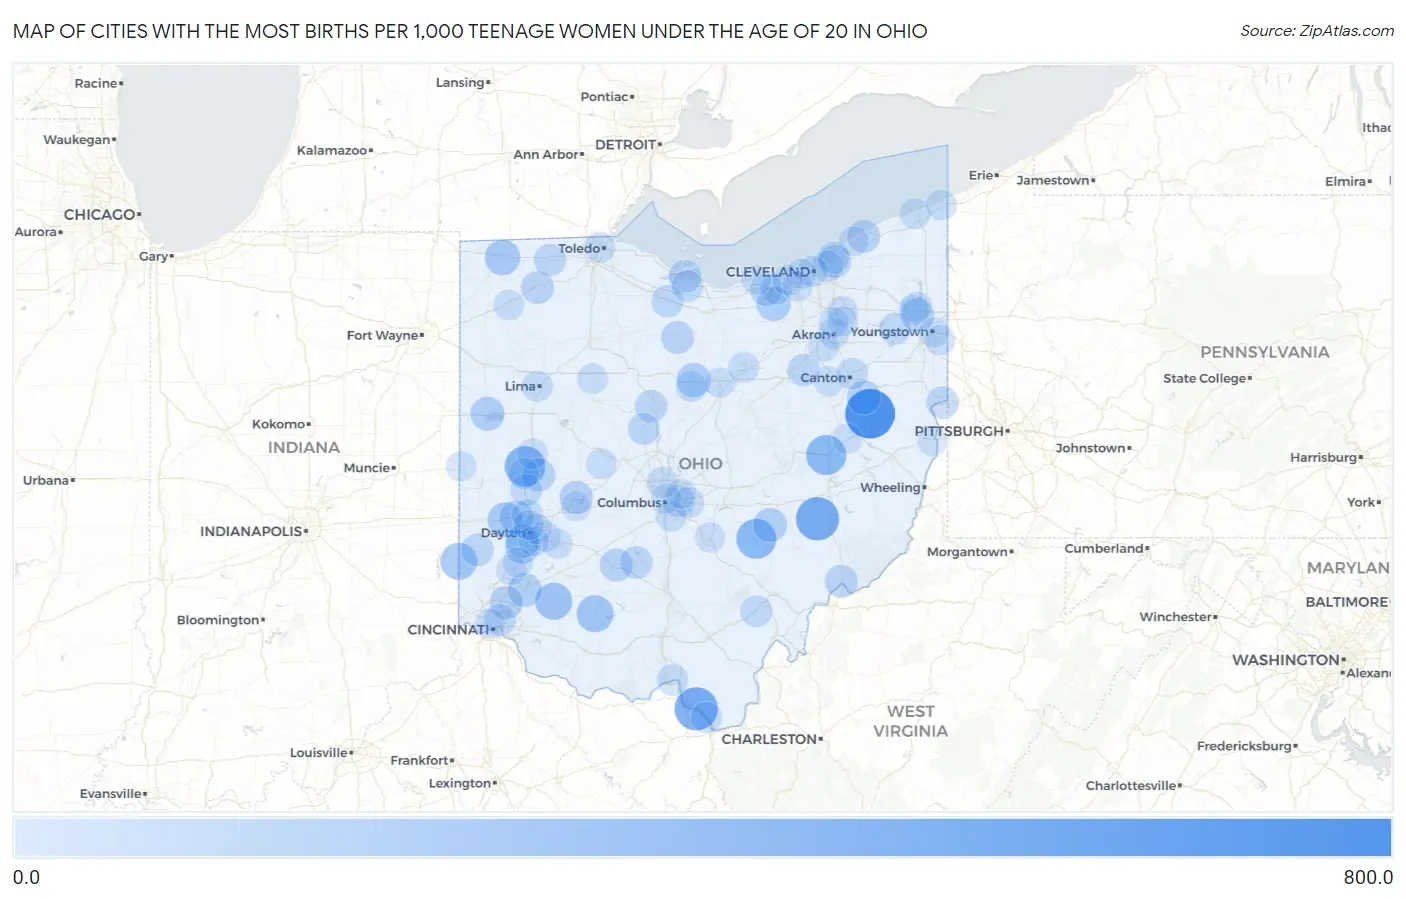
Map of Cities with the Most Births per 1,000 Teenage Women Under the Age of 20 in Ohio
0.0
800.0
Cities with the Most Births per 1,000 Teenage Women Under the Age of 20 in Ohio
| City | Births / 1,000 Women | vs State | vs National | |
| 1. | Dellroy | 750.0 | 12.0(+738)#1 | 10.0(+740)#66 |
| 2. | Cumberland | 500.0 | 12.0(+488)#2 | 10.0(+490)#126 |
| 3. | Hanging Rock | 500.0 | 12.0(+488)#3 | 10.0(+490)#137 |
| 4. | Lockington | 400.0 | 12.0(+388)#4 | 10.0(+390)#195 |
| 5. | Newcomerstown | 378.0 | 12.0(+366)#5 | 10.0(+368)#204 |
| 6. | New Lexington | 373.0 | 12.0(+361)#6 | 10.0(+363)#209 |
| 7. | Oakwood Village Cuyahoga County | 267.0 | 12.0(+255)#7 | 10.0(+257)#314 |
| 8. | Blanchester | 262.0 | 12.0(+250)#8 | 10.0(+252)#320 |
| 9. | Hillsboro | 255.0 | 12.0(+243)#9 | 10.0(+245)#327 |
| 10. | College Corner | 250.0 | 12.0(+238)#10 | 10.0(+240)#340 |
| 11. | West Unity | 207.0 | 12.0(+195)#11 | 10.0(+197)#411 |
| 12. | Brookville | 196.0 | 12.0(+184)#12 | 10.0(+186)#444 |
| 13. | West Carrollton | 176.0 | 12.0(+164)#13 | 10.0(+166)#492 |
| 14. | Grafton | 167.0 | 12.0(+155)#14 | 10.0(+157)#518 |
| 15. | Crestline | 157.0 | 12.0(+145)#15 | 10.0(+147)#562 |
| 16. | Celina | 154.0 | 12.0(+142)#16 | 10.0(+144)#570 |
| 17. | Roseville | 148.0 | 12.0(+136)#17 | 10.0(+138)#595 |
| 18. | Waynesburg | 148.0 | 12.0(+136)#18 | 10.0(+138)#597 |
| 19. | South Lebanon | 145.0 | 12.0(+133)#19 | 10.0(+135)#610 |
| 20. | Englewood | 142.0 | 12.0(+130)#20 | 10.0(+132)#627 |
| 21. | Moraine | 137.0 | 12.0(+125)#21 | 10.0(+127)#642 |
| 22. | Bolindale | 129.0 | 12.0(+117)#22 | 10.0(+119)#675 |
| 23. | Sharonville | 127.0 | 12.0(+115)#23 | 10.0(+117)#681 |
| 24. | Northridge | 126.0 | 12.0(+114)#24 | 10.0(+116)#685 |
| 25. | Fletcher | 118.0 | 12.0(+106)#25 | 10.0(+108)#724 |
| 26. | Washington Court House | 115.0 | 12.0(+103)#26 | 10.0(+105)#731 |
| 27. | Napoleon | 111.0 | 12.0(+99.0)#27 | 10.0(+101)#755 |
| 28. | Attica | 111.0 | 12.0(+99.0)#28 | 10.0(+101)#764 |
| 29. | Painesville | 108.0 | 12.0(+96.0)#29 | 10.0(+98.0)#780 |
| 30. | Marietta | 105.0 | 12.0(+93.0)#30 | 10.0(+95.0)#798 |
| 31. | Bay View | 103.0 | 12.0(+91.0)#31 | 10.0(+93.0)#815 |
| 32. | Richmond Heights | 102.0 | 12.0(+90.0)#32 | 10.0(+92.0)#818 |
| 33. | Camden | 98.0 | 12.0(+86.0)#33 | 10.0(+88.0)#843 |
| 34. | East Liverpool | 92.0 | 12.0(+80.0)#34 | 10.0(+82.0)#871 |
| 35. | Orrville | 92.0 | 12.0(+80.0)#35 | 10.0(+82.0)#872 |
| 36. | New Holland | 91.0 | 12.0(+79.0)#36 | 10.0(+81.0)#882 |
| 37. | Marion | 89.0 | 12.0(+77.0)#37 | 10.0(+79.0)#890 |
| 38. | Delta | 83.0 | 12.0(+71.0)#38 | 10.0(+73.0)#935 |
| 39. | Elyria | 82.0 | 12.0(+70.0)#39 | 10.0(+72.0)#941 |
| 40. | Clyde | 80.0 | 12.0(+68.0)#40 | 10.0(+70.0)#959 |
| 41. | Prospect | 75.0 | 12.0(+63.0)#41 | 10.0(+65.0)#998 |
| 42. | Craig Beach | 73.0 | 12.0(+61.0)#42 | 10.0(+63.0)#1,006 |
| 43. | Norwood | 71.0 | 12.0(+59.0)#43 | 10.0(+61.0)#1,019 |
| 44. | Albany | 69.0 | 12.0(+57.0)#44 | 10.0(+59.0)#1,035 |
| 45. | Troy | 65.0 | 12.0(+53.0)#45 | 10.0(+55.0)#1,066 |
| 46. | Euclid | 61.0 | 12.0(+49.0)#46 | 10.0(+51.0)#1,109 |
| 47. | Whitehall | 61.0 | 12.0(+49.0)#47 | 10.0(+51.0)#1,111 |
| 48. | Canton | 60.0 | 12.0(+48.0)#48 | 10.0(+50.0)#1,118 |
| 49. | Coal Grove | 60.0 | 12.0(+48.0)#49 | 10.0(+50.0)#1,128 |
| 50. | Castalia | 59.0 | 12.0(+47.0)#50 | 10.0(+49.0)#1,139 |
| 51. | North Ridgeville | 57.0 | 12.0(+45.0)#51 | 10.0(+47.0)#1,146 |
| 52. | Vandalia | 51.0 | 12.0(+39.0)#52 | 10.0(+41.0)#1,205 |
| 53. | Portsmouth | 50.0 | 12.0(+38.0)#53 | 10.0(+40.0)#1,210 |
| 54. | Galion | 50.0 | 12.0(+38.0)#54 | 10.0(+40.0)#1,213 |
| 55. | East Cleveland | 49.0 | 12.0(+37.0)#55 | 10.0(+39.0)#1,226 |
| 56. | Worthington | 45.0 | 12.0(+33.0)#56 | 10.0(+35.0)#1,268 |
| 57. | Morgandale | 45.0 | 12.0(+33.0)#57 | 10.0(+35.0)#1,279 |
| 58. | Lima | 41.0 | 12.0(+29.0)#58 | 10.0(+31.0)#1,326 |
| 59. | Beavercreek | 40.0 | 12.0(+28.0)#59 | 10.0(+30.0)#1,336 |
| 60. | Piqua | 38.0 | 12.0(+26.0)#60 | 10.0(+28.0)#1,362 |
| 61. | Cleveland | 37.0 | 12.0(+25.0)#61 | 10.0(+27.0)#1,373 |
| 62. | Ashland | 37.0 | 12.0(+25.0)#62 | 10.0(+27.0)#1,381 |
| 63. | Toledo | 36.0 | 12.0(+24.0)#63 | 10.0(+26.0)#1,394 |
| 64. | Akron | 36.0 | 12.0(+24.0)#64 | 10.0(+26.0)#1,395 |
| 65. | Sidney | 35.0 | 12.0(+23.0)#65 | 10.0(+25.0)#1,426 |
| 66. | Ashtabula | 35.0 | 12.0(+23.0)#66 | 10.0(+25.0)#1,427 |
| 67. | Reynoldsburg | 33.0 | 12.0(+21.0)#67 | 10.0(+23.0)#1,451 |
| 68. | Dunkirk | 32.0 | 12.0(+20.0)#68 | 10.0(+22.0)#1,478 |
| 69. | Westlake | 29.0 | 12.0(+17.0)#69 | 10.0(+19.0)#1,524 |
| 70. | Barberton | 27.0 | 12.0(+15.0)#70 | 10.0(+17.0)#1,564 |
| 71. | Defiance | 27.0 | 12.0(+15.0)#71 | 10.0(+17.0)#1,568 |
| 72. | North Lewisburg | 27.0 | 12.0(+15.0)#72 | 10.0(+17.0)#1,575 |
| 73. | Riverside | 26.0 | 12.0(+14.0)#73 | 10.0(+16.0)#1,590 |
| 74. | Obetz | 26.0 | 12.0(+14.0)#74 | 10.0(+16.0)#1,601 |
| 75. | Conneaut | 25.0 | 12.0(+13.0)#75 | 10.0(+15.0)#1,619 |
| 76. | Middletown | 24.0 | 12.0(+12.0)#76 | 10.0(+14.0)#1,631 |
| 77. | Lancaster | 23.0 | 12.0(+11.0)#77 | 10.0(+13.0)#1,657 |
| 78. | Hudson | 22.0 | 12.0(+10.00)#78 | 10.0(+12.0)#1,700 |
| 79. | Struthers | 21.0 | 12.0(+9.00)#79 | 10.0(+11.0)#1,725 |
| 80. | Stow | 20.0 | 12.0(+8.00)#80 | 10.0(+10.00)#1,740 |
| 81. | Xenia | 19.0 | 12.0(+7.00)#81 | 10.0(+9.00)#1,765 |
| 82. | Tuscarawas | 18.0 | 12.0(+6.00)#82 | 10.0(+8.00)#1,805 |
| 83. | Massillon | 16.0 | 12.0(+4.00)#83 | 10.0(+6.00)#1,858 |
| 84. | Cincinnati | 15.0 | 12.0(+3.00)#84 | 10.0(+5.00)#1,867 |
| 85. | Kettering | 15.0 | 12.0(+3.00)#85 | 10.0(+5.00)#1,877 |
| 86. | Mansfield | 15.0 | 12.0(+3.00)#86 | 10.0(+5.00)#1,879 |
| 87. | Lakewood | 13.0 | 12.0(+1.000)#87 | 10.0(+3.00)#1,953 |
| 88. | Union City | 13.0 | 12.0(+1.000)#88 | 10.0(+3.00)#1,969 |
| 89. | Springfield | 12.0 | 12.0(=0.000)#89 | 10.0(+2.00)#1,991 |
| 90. | Steubenville | 12.0 | 12.0(=0.000)#90 | 10.0(+2.00)#1,997 |
| 91. | Franklin | 12.0 | 12.0(=0.000)#91 | 10.0(+2.00)#2,000 |
| 92. | Columbus | 11.0 | 12.0(-1.000)#92 | 10.0(+1.000)#2,005 |
| 93. | Warren | 11.0 | 12.0(-1.000)#93 | 10.0(+1.000)#2,032 |
| 94. | Dayton | 10.0 | 12.0(-2.00)#94 | 10.0(=0.000)#2,059 |
| 95. | Cuyahoga Falls | 10.0 | 12.0(-2.00)#95 | 10.0(=0.000)#2,073 |
| 96. | Brook Park | 10.0 | 12.0(-2.00)#96 | 10.0(=0.000)#2,082 |
| 97. | Mentor | 9.0 | 12.0(-3.00)#97 | 10.0(-1.000)#2,114 |
| 98. | Youngstown | 8.0 | 12.0(-4.00)#98 | 10.0(-2.00)#2,144 |
| 99. | Gahanna | 7.0 | 12.0(-5.00)#99 | 10.0(-3.00)#2,197 |
| 100. | Lorain | 6.0 | 12.0(-6.00)#100 | 10.0(-4.00)#2,229 |
Common Questions
What are the Top 10 Cities with the Most Births per 1,000 Teenage Women Under the Age of 20 in Ohio?
Top 10 Cities with the Most Births per 1,000 Teenage Women Under the Age of 20 in Ohio are:
#1
750.0
#2
500.0
#3
500.0
#4
400.0
#5
378.0
#6
373.0
#7
262.0
#8
255.0
#9
250.0
#10
207.0
What city has the Most Births per 1,000 Teenage Women Under the Age of 20 in Ohio?
Dellroy has the Most Births per 1,000 Teenage Women Under the Age of 20 in Ohio with 750.0.
What is the Number of Births per 1,000 Teenage Women Under the Age of 20 in the State of Ohio?
Number of Births per 1,000 Teenage Women Under the Age of 20 in Ohio is 12.0.
What is the Number of Births per 1,000 Teenage Women Under the Age of 20 in the United States?
Number of Births per 1,000 Teenage Women Under the Age of 20 in the United States is 10.0.