Cities with the Most Births per 1,000 Teenage Women Under the Age of 20 in Indiana
RELATED REPORTS & OPTIONS
Highest Birth Rate | Women 15-19
Indiana
Compare Cities
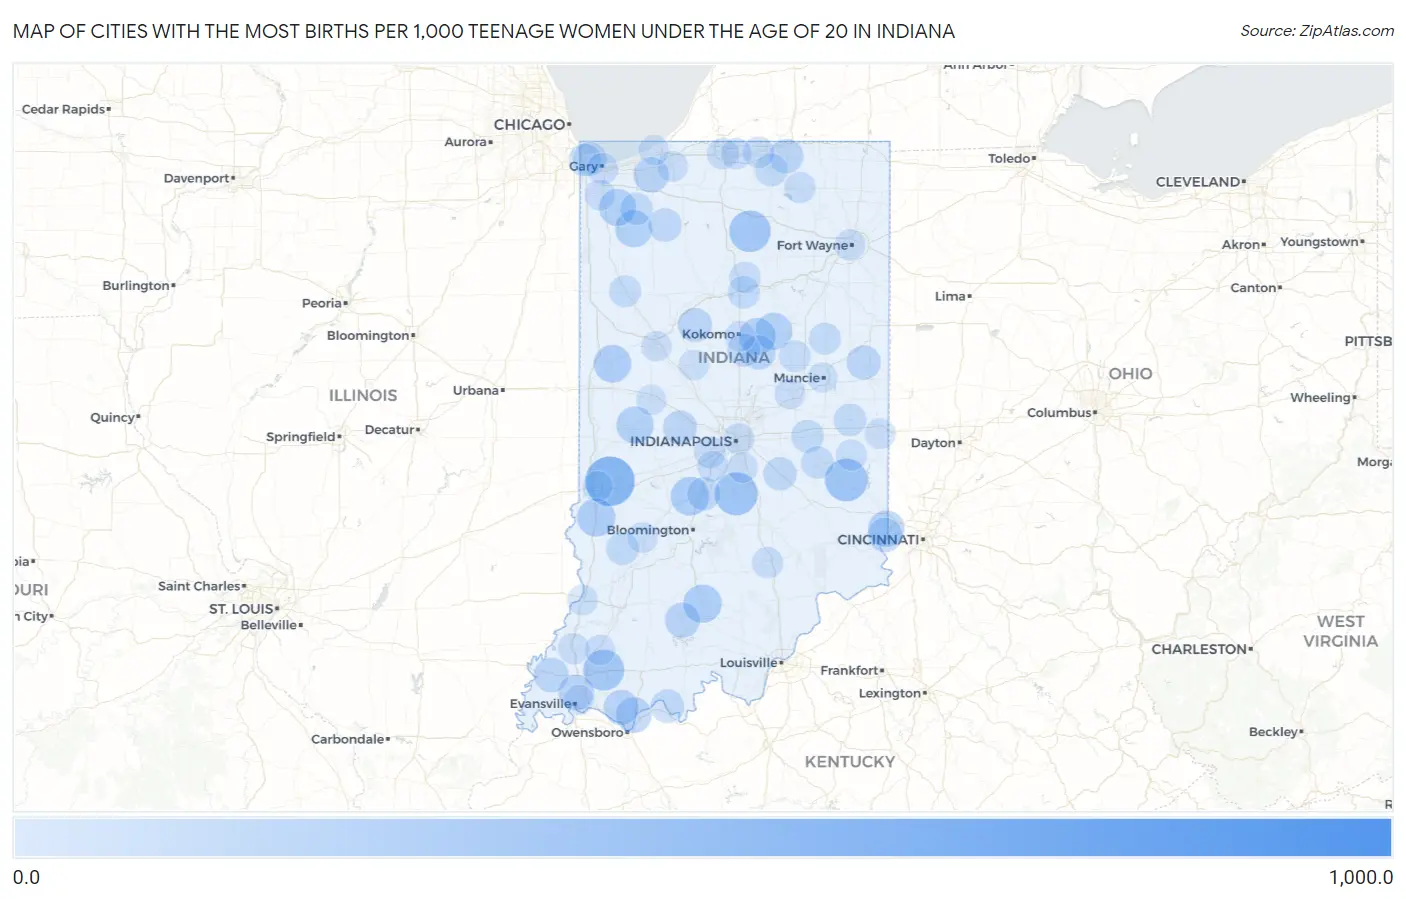
Map of Cities with the Most Births per 1,000 Teenage Women Under the Age of 20 in Indiana
0.0
1,000.0
Cities with the Most Births per 1,000 Teenage Women Under the Age of 20 in Indiana
| City | Births / 1,000 Women | vs State | vs National | |
| 1. | Amity | 1,000.0 | 11.0(+989)#1 | 10.0(+990)#28 |
| 2. | Seelyville | 514.0 | 11.0(+503)#2 | 10.0(+504)#123 |
| 3. | Trafalgar | 341.0 | 11.0(+330)#3 | 10.0(+331)#228 |
| 4. | Laurel | 333.0 | 11.0(+322)#4 | 10.0(+323)#239 |
| 5. | Mentone | 300.0 | 11.0(+289)#5 | 10.0(+290)#274 |
| 6. | Lynnville | 286.0 | 11.0(+275)#6 | 10.0(+276)#285 |
| 7. | Paragon | 222.0 | 11.0(+211)#7 | 10.0(+212)#383 |
| 8. | Orleans | 216.0 | 11.0(+205)#8 | 10.0(+206)#396 |
| 9. | Farmersburg | 214.0 | 11.0(+203)#9 | 10.0(+204)#399 |
| 10. | Attica | 197.0 | 11.0(+186)#10 | 10.0(+187)#441 |
| 11. | Swayzee | 182.0 | 11.0(+171)#11 | 10.0(+172)#477 |
| 12. | Wheatfield | 182.0 | 11.0(+171)#12 | 10.0(+172)#478 |
| 13. | Waveland | 182.0 | 11.0(+171)#13 | 10.0(+172)#482 |
| 14. | Hebron | 181.0 | 11.0(+170)#14 | 10.0(+171)#485 |
| 15. | Greentown | 175.0 | 11.0(+164)#15 | 10.0(+165)#499 |
| 16. | Hidden Valley | 164.0 | 11.0(+153)#16 | 10.0(+154)#534 |
| 17. | Rockport | 146.0 | 11.0(+135)#17 | 10.0(+136)#607 |
| 18. | Highland | 143.0 | 11.0(+132)#18 | 10.0(+133)#616 |
| 19. | French Lick | 135.0 | 11.0(+124)#19 | 10.0(+125)#651 |
| 20. | Westville | 132.0 | 11.0(+121)#20 | 10.0(+122)#661 |
| 21. | Richland | 130.0 | 11.0(+119)#21 | 10.0(+120)#672 |
| 22. | Poseyville | 121.0 | 11.0(+110)#22 | 10.0(+111)#707 |
| 23. | Greendale | 112.0 | 11.0(+101)#23 | 10.0(+102)#750 |
| 24. | Middlebury | 110.0 | 11.0(+99.0)#24 | 10.0(+100.0)#773 |
| 25. | Windfall City | 109.0 | 11.0(+98.0)#25 | 10.0(+99.0)#779 |
| 26. | Ridgeville | 107.0 | 11.0(+96.0)#26 | 10.0(+97.0)#793 |
| 27. | Flora | 105.0 | 11.0(+94.0)#27 | 10.0(+95.0)#802 |
| 28. | North Salem | 103.0 | 11.0(+92.0)#28 | 10.0(+93.0)#816 |
| 29. | Tell City | 90.0 | 11.0(+79.0)#29 | 10.0(+80.0)#888 |
| 30. | North Judson | 88.0 | 11.0(+77.0)#30 | 10.0(+78.0)#899 |
| 31. | Shelbyville | 86.0 | 11.0(+75.0)#31 | 10.0(+76.0)#910 |
| 32. | East Chicago | 84.0 | 11.0(+73.0)#32 | 10.0(+74.0)#929 |
| 33. | Martinsville | 83.0 | 11.0(+72.0)#33 | 10.0(+73.0)#934 |
| 34. | Sharpsville | 79.0 | 11.0(+68.0)#34 | 10.0(+69.0)#969 |
| 35. | Knightstown | 74.0 | 11.0(+63.0)#35 | 10.0(+64.0)#1,001 |
| 36. | Goshen | 71.0 | 11.0(+60.0)#36 | 10.0(+61.0)#1,017 |
| 37. | Linton | 68.0 | 11.0(+57.0)#37 | 10.0(+58.0)#1,041 |
| 38. | Rushville | 66.0 | 11.0(+55.0)#38 | 10.0(+56.0)#1,060 |
| 39. | Hammond | 65.0 | 11.0(+54.0)#39 | 10.0(+55.0)#1,063 |
| 40. | Hagerstown | 65.0 | 11.0(+54.0)#40 | 10.0(+55.0)#1,077 |
| 41. | Kouts | 61.0 | 11.0(+50.0)#41 | 10.0(+51.0)#1,115 |
| 42. | Peru | 53.0 | 11.0(+42.0)#42 | 10.0(+43.0)#1,179 |
| 43. | Hartford City | 47.0 | 11.0(+36.0)#43 | 10.0(+37.0)#1,253 |
| 44. | Remington | 47.0 | 11.0(+36.0)#44 | 10.0(+37.0)#1,257 |
| 45. | Summitville | 43.0 | 11.0(+32.0)#45 | 10.0(+33.0)#1,314 |
| 46. | Plainfield | 39.0 | 11.0(+28.0)#46 | 10.0(+29.0)#1,351 |
| 47. | Denver | 37.0 | 11.0(+26.0)#47 | 10.0(+27.0)#1,391 |
| 48. | Elkhart | 32.0 | 11.0(+21.0)#48 | 10.0(+22.0)#1,464 |
| 49. | Ligonier | 32.0 | 11.0(+21.0)#49 | 10.0(+22.0)#1,477 |
| 50. | Gary | 30.0 | 11.0(+19.0)#50 | 10.0(+20.0)#1,496 |
| 51. | South Bend | 29.0 | 11.0(+18.0)#51 | 10.0(+19.0)#1,520 |
| 52. | Connersville | 29.0 | 11.0(+18.0)#52 | 10.0(+19.0)#1,528 |
| 53. | Seymour | 27.0 | 11.0(+16.0)#53 | 10.0(+17.0)#1,566 |
| 54. | Indianapolis | 26.0 | 11.0(+15.0)#54 | 10.0(+16.0)#1,578 |
| 55. | Fort Wayne | 22.0 | 11.0(+11.0)#55 | 10.0(+12.0)#1,678 |
| 56. | Crown Point | 22.0 | 11.0(+11.0)#56 | 10.0(+12.0)#1,697 |
| 57. | La Porte | 22.0 | 11.0(+11.0)#57 | 10.0(+12.0)#1,701 |
| 58. | Princeton | 22.0 | 11.0(+11.0)#58 | 10.0(+12.0)#1,709 |
| 59. | Mishawaka | 19.0 | 11.0(+8.00)#59 | 10.0(+9.00)#1,758 |
| 60. | Kokomo | 18.0 | 11.0(+7.00)#60 | 10.0(+8.00)#1,788 |
| 61. | Worthington | 17.0 | 11.0(+6.00)#61 | 10.0(+7.00)#1,837 |
| 62. | Greenwood | 16.0 | 11.0(+5.00)#62 | 10.0(+6.00)#1,851 |
| 63. | Mooresville | 16.0 | 11.0(+5.00)#63 | 10.0(+6.00)#1,863 |
| 64. | Anderson | 14.0 | 11.0(+3.00)#64 | 10.0(+4.00)#1,915 |
| 65. | Richmond | 14.0 | 11.0(+3.00)#65 | 10.0(+4.00)#1,919 |
| 66. | Oakland City | 14.0 | 11.0(+3.00)#66 | 10.0(+4.00)#1,939 |
| 67. | Lafayette | 13.0 | 11.0(+2.00)#67 | 10.0(+3.00)#1,950 |
| 68. | Vincennes | 13.0 | 11.0(+2.00)#68 | 10.0(+3.00)#1,959 |
| 69. | Michigan City | 10.0 | 11.0(-1.000)#69 | 10.0(=0.000)#2,079 |
| 70. | Crawfordsville | 10.0 | 11.0(-1.000)#70 | 10.0(=0.000)#2,083 |
| 71. | Frankfort | 9.0 | 11.0(-2.00)#71 | 10.0(-1.000)#2,121 |
| 72. | Terre Haute | 6.0 | 11.0(-5.00)#72 | 10.0(-4.00)#2,232 |
| 73. | Muncie | 4.0 | 11.0(-7.00)#73 | 10.0(-6.00)#2,324 |
| 74. | Evansville | 2.0 | 11.0(-9.00)#74 | 10.0(-8.00)#2,379 |
Common Questions
What are the Top 10 Cities with the Most Births per 1,000 Teenage Women Under the Age of 20 in Indiana?
Top 10 Cities with the Most Births per 1,000 Teenage Women Under the Age of 20 in Indiana are:
#1
514.0
#2
341.0
#3
333.0
#4
300.0
#5
286.0
#6
222.0
#7
216.0
#8
214.0
#9
197.0
#10
182.0
What city has the Most Births per 1,000 Teenage Women Under the Age of 20 in Indiana?
Seelyville has the Most Births per 1,000 Teenage Women Under the Age of 20 in Indiana with 514.0.
What is the Number of Births per 1,000 Teenage Women Under the Age of 20 in the State of Indiana?
Number of Births per 1,000 Teenage Women Under the Age of 20 in Indiana is 11.0.
What is the Number of Births per 1,000 Teenage Women Under the Age of 20 in the United States?
Number of Births per 1,000 Teenage Women Under the Age of 20 in the United States is 10.0.