Cities with the Most Births per 1,000 Teenage Women Under the Age of 20 in Wisconsin
RELATED REPORTS & OPTIONS
Highest Birth Rate | Women 15-19
Wisconsin
Compare Cities
Map of Cities with the Most Births per 1,000 Teenage Women Under the Age of 20 in Wisconsin
0.0
500.0
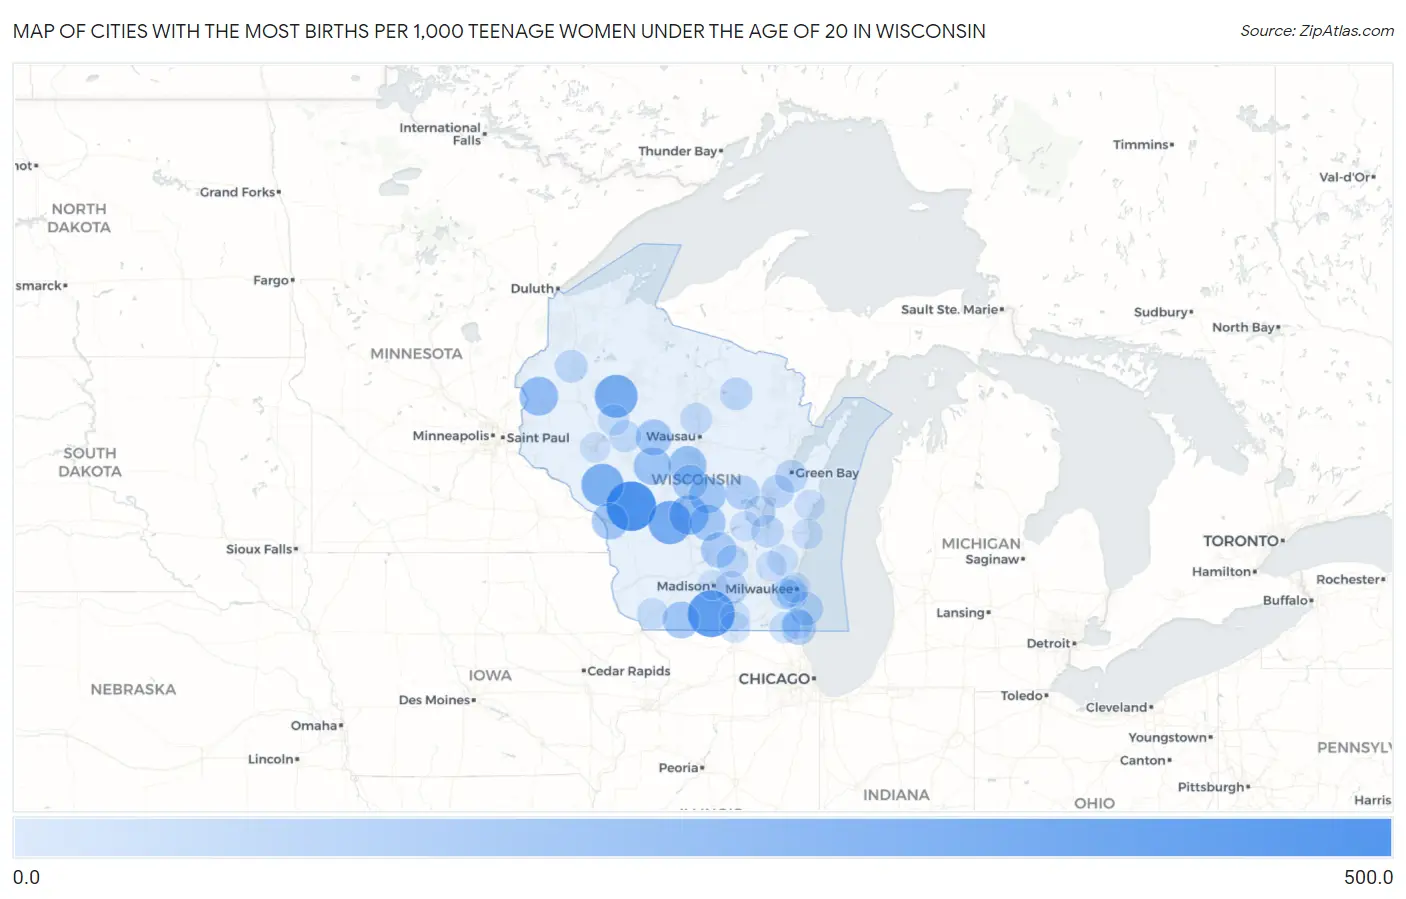
Cities with the Most Births per 1,000 Teenage Women Under the Age of 20 in Wisconsin
| City | Births / 1,000 Women | vs State | vs National | |
| 1. | Cataract | 500.0 | 7.0(+493)#1 | 10.0(+490)#133 |
| 2. | Albany | 429.0 | 7.0(+422)#2 | 10.0(+419)#165 |
| 3. | New Lisbon | 333.0 | 7.0(+326)#3 | 10.0(+323)#235 |
| 4. | Ladysmith | 326.0 | 7.0(+319)#4 | 10.0(+316)#254 |
| 5. | Whitehall | 309.0 | 7.0(+302)#5 | 10.0(+299)#265 |
| 6. | Friendship | 231.0 | 7.0(+224)#6 | 10.0(+221)#364 |
| 7. | Balsam Lake | 214.0 | 7.0(+207)#7 | 10.0(+204)#401 |
| 8. | Milladore | 194.0 | 7.0(+187)#8 | 10.0(+184)#447 |
| 9. | Granton | 182.0 | 7.0(+175)#9 | 10.0(+172)#483 |
| 10. | Wiota | 167.0 | 7.0(+160)#10 | 10.0(+157)#529 |
| 11. | Plainfield | 162.0 | 7.0(+155)#11 | 10.0(+152)#541 |
| 12. | Onalaska | 159.0 | 7.0(+152)#12 | 10.0(+149)#547 |
| 13. | Curtiss | 150.0 | 7.0(+143)#13 | 10.0(+140)#588 |
| 14. | Westfield | 148.0 | 7.0(+141)#14 | 10.0(+138)#596 |
| 15. | Pardeeville | 132.0 | 7.0(+125)#15 | 10.0(+122)#663 |
| 16. | Wisconsin Rapids | 123.0 | 7.0(+116)#16 | 10.0(+113)#696 |
| 17. | Pleasant Prairie | 112.0 | 7.0(+105)#17 | 10.0(+102)#748 |
| 18. | Fremont | 100.0 | 7.0(+93.0)#18 | 10.0(+90.0)#832 |
| 19. | Wind Point | 87.0 | 7.0(+80.0)#19 | 10.0(+77.0)#906 |
| 20. | Kaukauna | 66.0 | 7.0(+59.0)#20 | 10.0(+56.0)#1,057 |
| 21. | Deerfield | 64.0 | 7.0(+57.0)#21 | 10.0(+54.0)#1,086 |
| 22. | Allouez | 63.0 | 7.0(+56.0)#22 | 10.0(+53.0)#1,089 |
| 23. | Spooner | 63.0 | 7.0(+56.0)#23 | 10.0(+53.0)#1,096 |
| 24. | Mole Lake | 63.0 | 7.0(+56.0)#24 | 10.0(+53.0)#1,099 |
| 25. | Fond Du Lac | 58.0 | 7.0(+51.0)#25 | 10.0(+48.0)#1,141 |
| 26. | Fall River | 57.0 | 7.0(+50.0)#26 | 10.0(+47.0)#1,150 |
| 27. | Stanley | 45.0 | 7.0(+38.0)#27 | 10.0(+35.0)#1,270 |
| 28. | Merrill | 42.0 | 7.0(+35.0)#28 | 10.0(+32.0)#1,320 |
| 29. | Platteville | 30.0 | 7.0(+23.0)#29 | 10.0(+20.0)#1,511 |
| 30. | Cornell | 29.0 | 7.0(+22.0)#30 | 10.0(+19.0)#1,538 |
| 31. | West Allis | 27.0 | 7.0(+20.0)#31 | 10.0(+17.0)#1,556 |
| 32. | Salem Lakes | 27.0 | 7.0(+20.0)#32 | 10.0(+17.0)#1,570 |
| 33. | Greenfield | 24.0 | 7.0(+17.0)#33 | 10.0(+14.0)#1,635 |
| 34. | New Berlin | 23.0 | 7.0(+16.0)#34 | 10.0(+13.0)#1,658 |
| 35. | Kenosha | 22.0 | 7.0(+15.0)#35 | 10.0(+12.0)#1,681 |
| 36. | Oshkosh | 19.0 | 7.0(+12.0)#36 | 10.0(+9.00)#1,755 |
| 37. | Beloit | 19.0 | 7.0(+12.0)#37 | 10.0(+9.00)#1,762 |
| 38. | West Bend | 14.0 | 7.0(+7.00)#38 | 10.0(+4.00)#1,922 |
| 39. | Milwaukee | 11.0 | 7.0(+4.00)#39 | 10.0(+1.000)#2,006 |
| 40. | Hartford | 11.0 | 7.0(+4.00)#40 | 10.0(+1.000)#2,046 |
| 41. | Eau Claire | 10.0 | 7.0(+3.00)#41 | 10.0(=0.000)#2,069 |
| 42. | Manitowoc | 10.0 | 7.0(+3.00)#42 | 10.0(=0.000)#2,078 |
| 43. | Ripon | 10.0 | 7.0(+3.00)#43 | 10.0(=0.000)#2,086 |
| 44. | Sheboygan | 9.0 | 7.0(+2.00)#44 | 10.0(-1.000)#2,112 |
| 45. | Janesville | 4.0 | 7.0(-3.00)#45 | 10.0(-6.00)#2,323 |
| 46. | Madison | 1.0 | 7.0(-6.00)#46 | 10.0(-9.00)#2,399 |
Common Questions
What are the Top 10 Cities with the Most Births per 1,000 Teenage Women Under the Age of 20 in Wisconsin?
Top 10 Cities with the Most Births per 1,000 Teenage Women Under the Age of 20 in Wisconsin are:
#1
500.0
#2
429.0
#3
333.0
#4
326.0
#5
309.0
#6
231.0
#7
214.0
#8
194.0
#9
182.0
#10
167.0
What city has the Most Births per 1,000 Teenage Women Under the Age of 20 in Wisconsin?
Cataract has the Most Births per 1,000 Teenage Women Under the Age of 20 in Wisconsin with 500.0.
What is the Number of Births per 1,000 Teenage Women Under the Age of 20 in the State of Wisconsin?
Number of Births per 1,000 Teenage Women Under the Age of 20 in Wisconsin is 7.0.
What is the Number of Births per 1,000 Teenage Women Under the Age of 20 in the United States?
Number of Births per 1,000 Teenage Women Under the Age of 20 in the United States is 10.0.