Cities with the Most Births per 1,000 Teenage Women Under the Age of 20 in Texas
RELATED REPORTS & OPTIONS
Highest Birth Rate | Women 15-19
Texas
Compare Cities
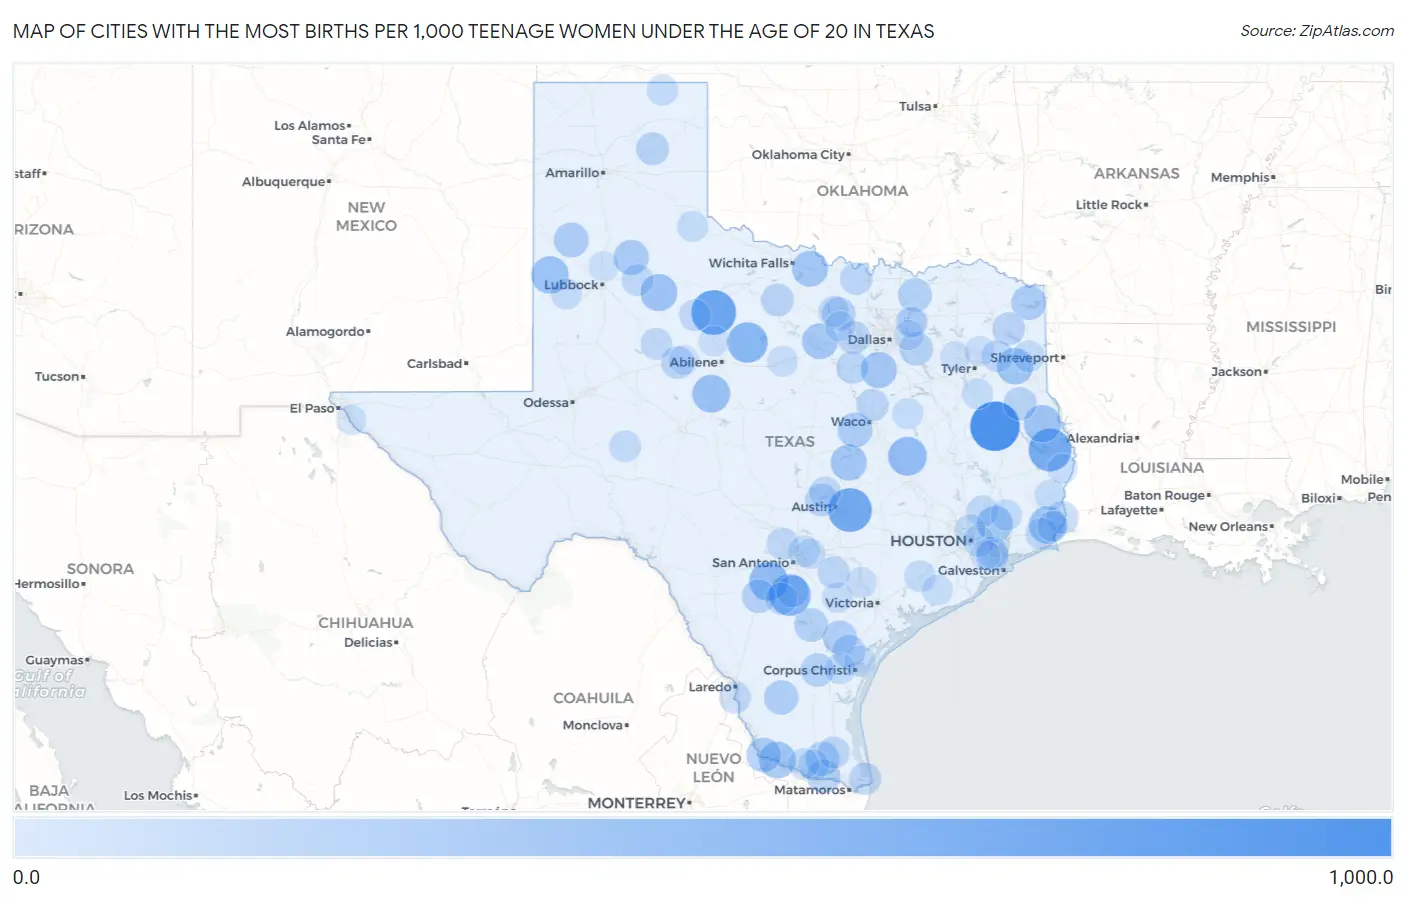
Map of Cities with the Most Births per 1,000 Teenage Women Under the Age of 20 in Texas
0.0
1,000.0
Cities with the Most Births per 1,000 Teenage Women Under the Age of 20 in Texas
| City | Births / 1,000 Women | vs State | vs National | |
| 1. | Wells | 1,000.0 | 16.0(+984)#1 | 10.0(+990)#13 |
| 2. | Rule | 762.0 | 16.0(+746)#2 | 10.0(+752)#62 |
| 3. | Webberville | 714.0 | 16.0(+698)#3 | 10.0(+704)#70 |
| 4. | Browndell | 667.0 | 16.0(+651)#4 | 10.0(+657)#81 |
| 5. | Jourdanton | 602.0 | 16.0(+586)#5 | 10.0(+592)#97 |
| 6. | Albany | 547.0 | 16.0(+531)#6 | 10.0(+537)#116 |
| 7. | Devine | 488.0 | 16.0(+472)#7 | 10.0(+478)#139 |
| 8. | Franklin | 468.0 | 16.0(+452)#8 | 10.0(+458)#146 |
| 9. | Winters | 430.0 | 16.0(+414)#9 | 10.0(+420)#164 |
| 10. | Central Gardens | 412.0 | 16.0(+396)#10 | 10.0(+402)#177 |
| 11. | Morton | 409.0 | 16.0(+393)#11 | 10.0(+399)#181 |
| 12. | San Augustine | 400.0 | 16.0(+384)#12 | 10.0(+390)#185 |
| 13. | Spur | 389.0 | 16.0(+373)#13 | 10.0(+379)#197 |
| 14. | Garza Salinas Ii | 380.0 | 16.0(+364)#14 | 10.0(+370)#203 |
| 15. | Easton | 364.0 | 16.0(+348)#15 | 10.0(+354)#213 |
| 16. | Maypearl | 350.0 | 16.0(+334)#16 | 10.0(+340)#221 |
| 17. | Salado | 345.0 | 16.0(+329)#17 | 10.0(+335)#225 |
| 18. | Henrietta | 344.0 | 16.0(+328)#18 | 10.0(+334)#226 |
| 19. | Dayton | 340.0 | 16.0(+324)#19 | 10.0(+330)#229 |
| 20. | Millsap | 333.0 | 16.0(+317)#20 | 10.0(+323)#242 |
| 21. | Floydada | 307.0 | 16.0(+291)#21 | 10.0(+297)#268 |
| 22. | Mcgregor | 287.0 | 16.0(+271)#22 | 10.0(+277)#283 |
| 23. | Earth | 286.0 | 16.0(+270)#23 | 10.0(+276)#286 |
| 24. | Roma | 278.0 | 16.0(+262)#24 | 10.0(+268)#295 |
| 25. | Maud | 278.0 | 16.0(+262)#25 | 10.0(+268)#297 |
| 26. | Hebbronville | 264.0 | 16.0(+248)#26 | 10.0(+254)#318 |
| 27. | Monte Alto | 250.0 | 16.0(+234)#27 | 10.0(+240)#329 |
| 28. | Skidmore | 250.0 | 16.0(+234)#28 | 10.0(+240)#330 |
| 29. | Three Rivers | 237.0 | 16.0(+221)#29 | 10.0(+227)#354 |
| 30. | Trenton | 235.0 | 16.0(+219)#30 | 10.0(+225)#355 |
| 31. | Post Oak Bend City | 231.0 | 16.0(+215)#31 | 10.0(+221)#366 |
| 32. | Pearsall | 229.0 | 16.0(+213)#32 | 10.0(+219)#370 |
| 33. | Alice | 227.0 | 16.0(+211)#33 | 10.0(+217)#371 |
| 34. | Paradise | 222.0 | 16.0(+206)#34 | 10.0(+212)#384 |
| 35. | Progreso | 219.0 | 16.0(+203)#35 | 10.0(+209)#389 |
| 36. | Garrison | 214.0 | 16.0(+198)#36 | 10.0(+204)#400 |
| 37. | Sinton | 206.0 | 16.0(+190)#37 | 10.0(+196)#414 |
| 38. | Pampa | 204.0 | 16.0(+188)#38 | 10.0(+194)#417 |
| 39. | Lake Worth | 199.0 | 16.0(+183)#39 | 10.0(+189)#437 |
| 40. | Point Venture | 193.0 | 16.0(+177)#40 | 10.0(+183)#449 |
| 41. | Bacliff | 191.0 | 16.0(+175)#41 | 10.0(+181)#453 |
| 42. | Olney | 191.0 | 16.0(+175)#42 | 10.0(+181)#454 |
| 43. | Roscoe | 189.0 | 16.0(+173)#43 | 10.0(+179)#464 |
| 44. | Lone Star | 186.0 | 16.0(+170)#44 | 10.0(+176)#469 |
| 45. | Muenster | 177.0 | 16.0(+161)#45 | 10.0(+167)#491 |
| 46. | Cleburne | 171.0 | 16.0(+155)#46 | 10.0(+161)#507 |
| 47. | West | 170.0 | 16.0(+154)#47 | 10.0(+160)#509 |
| 48. | Port Isabel | 167.0 | 16.0(+151)#48 | 10.0(+157)#519 |
| 49. | Pinehurst | 167.0 | 16.0(+151)#49 | 10.0(+157)#520 |
| 50. | Nixon | 159.0 | 16.0(+143)#50 | 10.0(+149)#549 |
| 51. | Pleasanton | 157.0 | 16.0(+141)#51 | 10.0(+147)#560 |
| 52. | Raymondville | 155.0 | 16.0(+139)#52 | 10.0(+145)#568 |
| 53. | Charlotte | 154.0 | 16.0(+138)#53 | 10.0(+144)#573 |
| 54. | Clarksville City | 151.0 | 16.0(+135)#54 | 10.0(+141)#580 |
| 55. | El Cenizo | 150.0 | 16.0(+134)#55 | 10.0(+140)#583 |
| 56. | Jonestown | 149.0 | 16.0(+133)#56 | 10.0(+139)#591 |
| 57. | Patton Village | 149.0 | 16.0(+133)#57 | 10.0(+139)#593 |
| 58. | Scenic Oaks | 148.0 | 16.0(+132)#58 | 10.0(+138)#594 |
| 59. | Seabrook | 147.0 | 16.0(+131)#59 | 10.0(+137)#599 |
| 60. | Crosbyton | 147.0 | 16.0(+131)#60 | 10.0(+137)#600 |
| 61. | Snyder | 146.0 | 16.0(+130)#61 | 10.0(+136)#603 |
| 62. | Aspermont | 145.0 | 16.0(+129)#62 | 10.0(+135)#612 |
| 63. | Taylor Landing | 143.0 | 16.0(+127)#63 | 10.0(+133)#624 |
| 64. | Marshall | 135.0 | 16.0(+119)#64 | 10.0(+125)#648 |
| 65. | Big Lake | 133.0 | 16.0(+117)#65 | 10.0(+123)#657 |
| 66. | El Campo | 129.0 | 16.0(+113)#66 | 10.0(+119)#673 |
| 67. | Selma | 124.0 | 16.0(+108)#67 | 10.0(+114)#695 |
| 68. | Galena Park | 123.0 | 16.0(+107)#68 | 10.0(+113)#697 |
| 69. | Sundown | 122.0 | 16.0(+106)#69 | 10.0(+112)#703 |
| 70. | Childress | 118.0 | 16.0(+102)#70 | 10.0(+108)#717 |
| 71. | Portland | 116.0 | 16.0(+100.0)#71 | 10.0(+106)#726 |
| 72. | Aldine | 115.0 | 16.0(+99.0)#72 | 10.0(+105)#730 |
| 73. | Perryton | 115.0 | 16.0(+99.0)#73 | 10.0(+105)#734 |
| 74. | Murillo | 114.0 | 16.0(+98.0)#74 | 10.0(+104)#740 |
| 75. | Alton | 111.0 | 16.0(+95.0)#75 | 10.0(+101)#752 |
| 76. | Hardin | 111.0 | 16.0(+95.0)#76 | 10.0(+101)#763 |
| 77. | Jacksonville | 109.0 | 16.0(+93.0)#77 | 10.0(+99.0)#776 |
| 78. | Buna | 109.0 | 16.0(+93.0)#78 | 10.0(+99.0)#778 |
| 79. | Robstown | 108.0 | 16.0(+92.0)#79 | 10.0(+98.0)#781 |
| 80. | Mexia | 107.0 | 16.0(+91.0)#80 | 10.0(+97.0)#787 |
| 81. | Bridgeport | 107.0 | 16.0(+91.0)#81 | 10.0(+97.0)#788 |
| 82. | Port Neches | 103.0 | 16.0(+87.0)#82 | 10.0(+93.0)#809 |
| 83. | Runge | 103.0 | 16.0(+87.0)#83 | 10.0(+93.0)#814 |
| 84. | Cuero | 100.0 | 16.0(+84.0)#84 | 10.0(+90.0)#829 |
| 85. | Bay City | 98.0 | 16.0(+82.0)#85 | 10.0(+88.0)#840 |
| 86. | Ranger | 94.0 | 16.0(+78.0)#86 | 10.0(+84.0)#861 |
| 87. | Cibolo | 92.0 | 16.0(+76.0)#87 | 10.0(+82.0)#868 |
| 88. | Anson | 91.0 | 16.0(+75.0)#88 | 10.0(+81.0)#879 |
| 89. | Nevada | 89.0 | 16.0(+73.0)#89 | 10.0(+79.0)#896 |
| 90. | Lavon | 88.0 | 16.0(+72.0)#90 | 10.0(+78.0)#898 |
| 91. | Newton | 82.0 | 16.0(+66.0)#91 | 10.0(+72.0)#948 |
| 92. | Hawkins | 82.0 | 16.0(+66.0)#92 | 10.0(+72.0)#949 |
| 93. | Reno City Parker And Tarrant Counties | 81.0 | 16.0(+65.0)#93 | 10.0(+71.0)#953 |
| 94. | San Elizario | 80.0 | 16.0(+64.0)#94 | 10.0(+70.0)#957 |
| 95. | Heath | 79.0 | 16.0(+63.0)#95 | 10.0(+69.0)#963 |
| 96. | Springtown | 79.0 | 16.0(+63.0)#96 | 10.0(+69.0)#965 |
| 97. | Webster | 78.0 | 16.0(+62.0)#97 | 10.0(+68.0)#973 |
| 98. | Sweetwater | 75.0 | 16.0(+59.0)#98 | 10.0(+65.0)#995 |
| 99. | Abernathy | 75.0 | 16.0(+59.0)#99 | 10.0(+65.0)#997 |
| 100. | Van | 68.0 | 16.0(+52.0)#100 | 10.0(+58.0)#1,043 |
Common Questions
What are the Top 10 Cities with the Most Births per 1,000 Teenage Women Under the Age of 20 in Texas?
Top 10 Cities with the Most Births per 1,000 Teenage Women Under the Age of 20 in Texas are:
#1
1,000.0
#2
762.0
#3
714.0
#4
667.0
#5
602.0
#6
547.0
#7
488.0
#8
468.0
#9
430.0
#10
412.0
What city has the Most Births per 1,000 Teenage Women Under the Age of 20 in Texas?
Wells has the Most Births per 1,000 Teenage Women Under the Age of 20 in Texas with 1,000.0.
What is the Number of Births per 1,000 Teenage Women Under the Age of 20 in the State of Texas?
Number of Births per 1,000 Teenage Women Under the Age of 20 in Texas is 16.0.
What is the Number of Births per 1,000 Teenage Women Under the Age of 20 in the United States?
Number of Births per 1,000 Teenage Women Under the Age of 20 in the United States is 10.0.