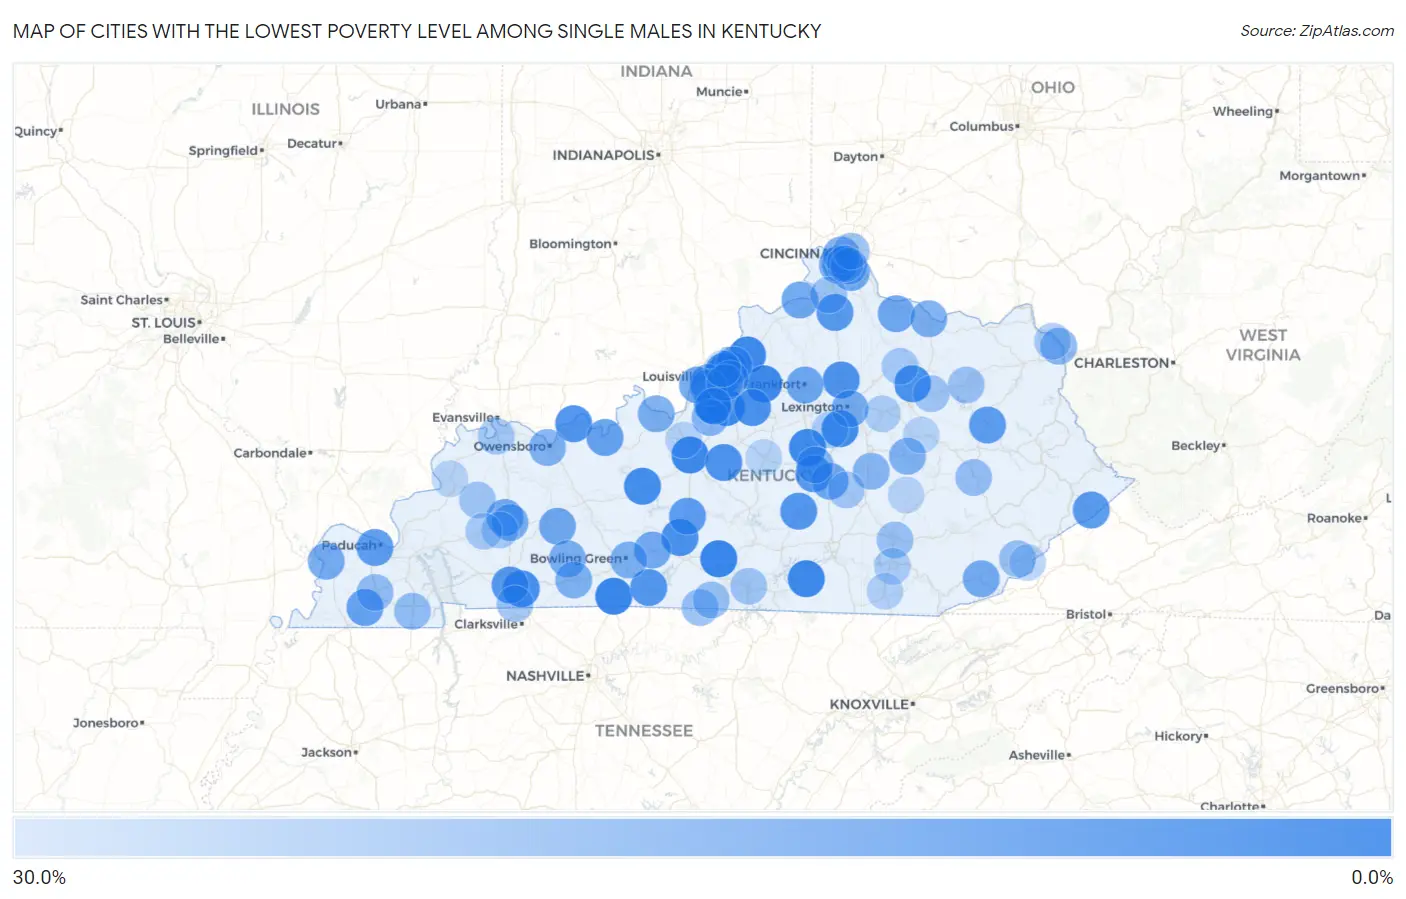
Cities with the Lowest Poverty Level Among Single Males in Kentucky
RELATED REPORTS & OPTIONS
Lowest Poverty | Single Male
Kentucky
Compare Cities
Map of Cities with the Lowest Poverty Level Among Single Males in Kentucky
30.0%
0.0%
Cities with the Lowest Poverty Level Among Single Males in Kentucky
| City | Single Male Poverty | vs State | vs National | |
| 1. | Edmonton | 1.8% | 16.7%(-14.9)#1 | 12.4%(-10.6)#142 |
| 2. | Franklin | 2.1% | 16.7%(-14.6)#2 | 12.4%(-10.3)#193 |
| 3. | Mount Washington | 2.3% | 16.7%(-14.4)#3 | 12.4%(-10.1)#241 |
| 4. | La Grange | 2.9% | 16.7%(-13.8)#4 | 12.4%(-9.52)#342 |
| 5. | Shelbyville | 3.0% | 16.7%(-13.7)#5 | 12.4%(-9.42)#355 |
| 6. | Harrodsburg | 3.2% | 16.7%(-13.5)#6 | 12.4%(-9.21)#398 |
| 7. | Monticello | 3.3% | 16.7%(-13.4)#7 | 12.4%(-9.10)#422 |
| 8. | Elizabethtown | 3.3% | 16.7%(-13.3)#8 | 12.4%(-9.10)#425 |
| 9. | Lyndon | 3.8% | 16.7%(-12.9)#9 | 12.4%(-8.67)#520 |
| 10. | Thruston | 4.0% | 16.7%(-12.7)#10 | 12.4%(-8.46)#572 |
| 11. | Nicholasville | 4.2% | 16.7%(-12.5)#11 | 12.4%(-8.27)#619 |
| 12. | Leitchfield | 4.6% | 16.7%(-12.1)#12 | 12.4%(-7.81)#737 |
| 13. | Pembroke | 5.0% | 16.7%(-11.7)#13 | 12.4%(-7.44)#843 |
| 14. | Cave City | 5.2% | 16.7%(-11.5)#14 | 12.4%(-7.26)#878 |
| 15. | Taylorsville | 5.7% | 16.7%(-11.0)#15 | 12.4%(-6.72)#1,018 |
| 16. | Sharpsburg | 5.9% | 16.7%(-10.8)#16 | 12.4%(-6.55)#1,066 |
| 17. | Georgetown | 6.3% | 16.7%(-10.4)#17 | 12.4%(-6.14)#1,173 |
| 18. | New Haven | 6.5% | 16.7%(-10.2)#18 | 12.4%(-5.98)#1,213 |
| 19. | Lewisport | 6.9% | 16.7%(-9.79)#19 | 12.4%(-5.54)#1,351 |
| 20. | Fincastle | 7.1% | 16.7%(-9.54)#20 | 12.4%(-5.29)#1,423 |
| 21. | Liberty | 7.7% | 16.7%(-8.99)#21 | 12.4%(-4.74)#1,583 |
| 22. | Scottsville | 7.8% | 16.7%(-8.84)#22 | 12.4%(-4.59)#1,630 |
| 23. | Pioneer Village | 7.9% | 16.7%(-8.75)#23 | 12.4%(-4.50)#1,665 |
| 24. | Junction City | 8.3% | 16.7%(-8.35)#24 | 12.4%(-4.10)#1,783 |
| 25. | Hopkinsville | 8.4% | 16.7%(-8.29)#25 | 12.4%(-4.04)#1,824 |
| 26. | Dry Ridge | 8.6% | 16.7%(-8.06)#26 | 12.4%(-3.81)#1,885 |
| 27. | Elkhorn City | 9.1% | 16.7%(-7.59)#27 | 12.4%(-3.34)#2,013 |
| 28. | Paducah | 9.2% | 16.7%(-7.45)#28 | 12.4%(-3.20)#2,068 |
| 29. | West Liberty | 9.4% | 16.7%(-7.31)#29 | 12.4%(-3.06)#2,097 |
| 30. | Munfordville | 9.6% | 16.7%(-7.07)#30 | 12.4%(-2.82)#2,173 |
| 31. | Langdon Place | 10.0% | 16.7%(-6.69)#31 | 12.4%(-2.44)#2,302 |
| 32. | Louisville | 11.0% | 16.7%(-5.69)#32 | 12.4%(-1.44)#2,590 |
| 33. | Wingo | 11.1% | 16.7%(-5.57)#33 | 12.4%(-1.32)#2,645 |
| 34. | Hillview | 11.7% | 16.7%(-4.96)#34 | 12.4%(-0.714)#2,830 |
| 35. | Cloverport | 11.8% | 16.7%(-4.92)#35 | 12.4%(-0.671)#2,855 |
| 36. | Crestwood | 12.1% | 16.7%(-4.60)#36 | 12.4%(-0.355)#2,942 |
| 37. | Warsaw | 12.8% | 16.7%(-3.86)#37 | 12.4%(+0.385)#3,162 |
| 38. | Frankfort | 13.0% | 16.7%(-3.68)#38 | 12.4%(+0.569)#3,205 |
| 39. | Earlington | 13.0% | 16.7%(-3.64)#39 | 12.4%(+0.608)#3,222 |
| 40. | Ryland Heights | 13.0% | 16.7%(-3.64)#40 | 12.4%(+0.608)#3,224 |
| 41. | Brooksville | 13.3% | 16.7%(-3.35)#41 | 12.4%(+0.898)#3,299 |
| 42. | Drakesboro | 13.3% | 16.7%(-3.35)#42 | 12.4%(+0.898)#3,305 |
| 43. | Smiths Grove | 13.8% | 16.7%(-2.89)#43 | 12.4%(+1.36)#3,409 |
| 44. | Middletown | 14.0% | 16.7%(-2.70)#44 | 12.4%(+1.55)#3,466 |
| 45. | Stanford | 14.0% | 16.7%(-2.65)#45 | 12.4%(+1.60)#3,474 |
| 46. | Erlanger | 14.2% | 16.7%(-2.50)#46 | 12.4%(+1.75)#3,506 |
| 47. | Harlan | 14.3% | 16.7%(-2.40)#47 | 12.4%(+1.85)#3,534 |
| 48. | Lynnview | 14.3% | 16.7%(-2.40)#48 | 12.4%(+1.85)#3,556 |
| 49. | Shively | 14.3% | 16.7%(-2.38)#49 | 12.4%(+1.87)#3,591 |
| 50. | Crestview Hills | 14.8% | 16.7%(-1.87)#50 | 12.4%(+2.38)#3,684 |
| 51. | Lexington | 15.0% | 16.7%(-1.71)#51 | 12.4%(+2.54)#3,719 |
| 52. | Wickliffe | 15.0% | 16.7%(-1.69)#52 | 12.4%(+2.56)#3,731 |
| 53. | Brandenburg | 15.6% | 16.7%(-1.13)#53 | 12.4%(+3.12)#3,879 |
| 54. | Maysville | 15.7% | 16.7%(-1.03)#54 | 12.4%(+3.22)#3,903 |
| 55. | Lewisburg | 15.8% | 16.7%(-0.896)#55 | 12.4%(+3.35)#3,947 |
| 56. | Ludlow | 15.9% | 16.7%(-0.812)#56 | 12.4%(+3.44)#3,971 |
| 57. | Mortons Gap | 15.9% | 16.7%(-0.776)#57 | 12.4%(+3.47)#3,976 |
| 58. | Bowling Green | 16.0% | 16.7%(-0.651)#58 | 12.4%(+3.60)#4,004 |
| 59. | Taylor Mill | 16.2% | 16.7%(-0.531)#59 | 12.4%(+3.72)#4,038 |
| 60. | Russellville | 16.7% | 16.7%(-0.019)#60 | 12.4%(+4.23)#4,126 |
| 61. | Irvine | 16.9% | 16.7%(+0.238)#61 | 12.4%(+4.49)#4,249 |
| 62. | Owensboro | 17.0% | 16.7%(+0.352)#62 | 12.4%(+4.60)#4,270 |
| 63. | Jeffersontown | 17.2% | 16.7%(+0.556)#63 | 12.4%(+4.81)#4,311 |
| 64. | Shepherdsville | 18.0% | 16.7%(+1.30)#64 | 12.4%(+5.55)#4,464 |
| 65. | Danville | 18.7% | 16.7%(+1.98)#65 | 12.4%(+6.23)#4,603 |
| 66. | Ashland | 19.0% | 16.7%(+2.31)#66 | 12.4%(+6.56)#4,663 |
| 67. | Berea | 19.0% | 16.7%(+2.33)#67 | 12.4%(+6.58)#4,668 |
| 68. | Hebron Estates | 19.4% | 16.7%(+2.76)#68 | 12.4%(+7.01)#4,766 |
| 69. | Mayfield | 20.9% | 16.7%(+4.18)#69 | 12.4%(+8.43)#5,086 |
| 70. | Murray | 21.2% | 16.7%(+4.54)#70 | 12.4%(+8.79)#5,159 |
| 71. | Jackson | 21.4% | 16.7%(+4.74)#71 | 12.4%(+8.99)#5,183 |
| 72. | Gamaliel | 21.4% | 16.7%(+4.74)#72 | 12.4%(+8.99)#5,207 |
| 73. | Tompkinsville | 22.2% | 16.7%(+5.54)#73 | 12.4%(+9.79)#5,319 |
| 74. | Cumberland | 22.2% | 16.7%(+5.54)#74 | 12.4%(+9.79)#5,324 |
| 75. | Morehead | 22.6% | 16.7%(+5.90)#75 | 12.4%(+10.1)#5,398 |
| 76. | Dayton | 22.6% | 16.7%(+5.91)#76 | 12.4%(+10.2)#5,409 |
| 77. | London | 22.6% | 16.7%(+5.95)#77 | 12.4%(+10.2)#5,413 |
| 78. | Oak Grove | 22.8% | 16.7%(+6.14)#78 | 12.4%(+10.4)#5,450 |
| 79. | Verona | 23.3% | 16.7%(+6.57)#79 | 12.4%(+10.8)#5,532 |
| 80. | Owingsville | 23.7% | 16.7%(+7.04)#80 | 12.4%(+11.3)#5,598 |
| 81. | Burkesville | 23.8% | 16.7%(+7.12)#81 | 12.4%(+11.4)#5,613 |
| 82. | Providence | 24.1% | 16.7%(+7.37)#82 | 12.4%(+11.6)#5,657 |
| 83. | Crab Orchard | 24.3% | 16.7%(+7.64)#83 | 12.4%(+11.9)#5,691 |
| 84. | Henderson | 24.8% | 16.7%(+8.13)#84 | 12.4%(+12.4)#5,764 |
| 85. | Carlisle | 25.0% | 16.7%(+8.31)#85 | 12.4%(+12.6)#5,796 |
| 86. | Bellefonte | 25.0% | 16.7%(+8.31)#86 | 12.4%(+12.6)#5,829 |
| 87. | St Charles | 25.0% | 16.7%(+8.31)#87 | 12.4%(+12.6)#5,904 |
| 88. | Dawson Springs | 25.8% | 16.7%(+9.12)#88 | 12.4%(+13.4)#5,986 |
| 89. | Wilmore | 26.7% | 16.7%(+9.98)#89 | 12.4%(+14.2)#6,094 |
| 90. | Winchester | 26.7% | 16.7%(+9.99)#90 | 12.4%(+14.2)#6,114 |
| 91. | Corbin | 26.7% | 16.7%(+10.0)#91 | 12.4%(+14.3)#6,118 |
| 92. | Lynch | 27.3% | 16.7%(+10.6)#92 | 12.4%(+14.8)#6,192 |
| 93. | Williamsburg | 27.7% | 16.7%(+11.0)#93 | 12.4%(+15.3)#6,247 |
| 94. | Radcliff | 28.0% | 16.7%(+11.3)#94 | 12.4%(+15.6)#6,292 |
| 95. | Stanton | 28.3% | 16.7%(+11.6)#95 | 12.4%(+15.9)#6,337 |
| 96. | Springfield | 28.3% | 16.7%(+11.6)#96 | 12.4%(+15.9)#6,338 |
| 97. | Sturgis | 28.6% | 16.7%(+11.9)#97 | 12.4%(+16.1)#6,375 |
| 98. | Mckee | 28.6% | 16.7%(+11.9)#98 | 12.4%(+16.1)#6,379 |
| 99. | Brownsboro Farm | 28.6% | 16.7%(+11.9)#99 | 12.4%(+16.1)#6,388 |
| 100. | Covington | 28.8% | 16.7%(+12.1)#100 | 12.4%(+16.4)#6,425 |
Common Questions
What are the Top 10 Cities with the Lowest Poverty Level Among Single Males in Kentucky?
Top 10 Cities with the Lowest Poverty Level Among Single Males in Kentucky are:
#1
1.8%
#2
2.1%
#3
2.3%
#4
2.9%
#5
3.0%
#6
3.2%
#7
3.3%
#8
3.3%
#9
3.8%
#10
4.2%
What city has the Lowest Poverty Level Among Single Males in Kentucky?
Edmonton has the Lowest Poverty Level Among Single Males in Kentucky with 1.8%.
What is the Poverty Level Among Single Males in the State of Kentucky?
Poverty Level Among Single Males in Kentucky is 16.7%.
What is the Poverty Level Among Single Males in the United States?
Poverty Level Among Single Males in the United States is 12.4%.