Cities with the Lowest Poverty Level Among Single Males in Maryland
RELATED REPORTS & OPTIONS
Lowest Poverty | Single Male
Maryland
Compare Cities
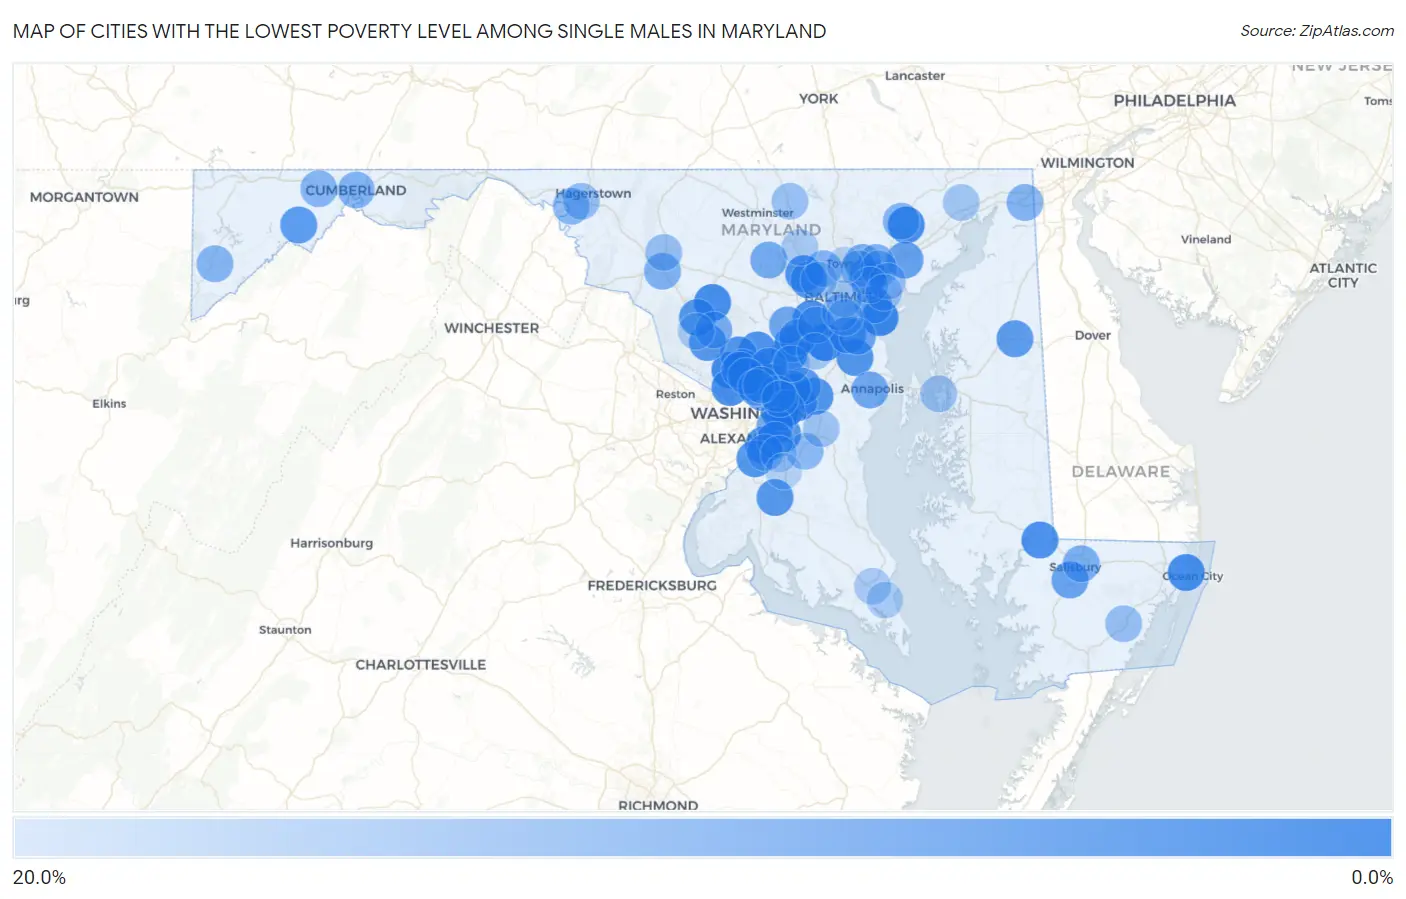
Map of Cities with the Lowest Poverty Level Among Single Males in Maryland
20.0%
0.0%
Cities with the Lowest Poverty Level Among Single Males in Maryland
| City | Single Male Poverty | vs State | vs National | |
| 1. | Severn | 0.64% | 8.3%(-7.65)#1 | 12.4%(-11.8)#16 |
| 2. | Edgemere | 1.5% | 8.3%(-6.83)#2 | 12.4%(-11.0)#95 |
| 3. | North Bethesda | 1.6% | 8.3%(-6.69)#3 | 12.4%(-10.8)#115 |
| 4. | Silver Spring | 2.2% | 8.3%(-6.14)#4 | 12.4%(-10.3)#205 |
| 5. | Damascus | 2.6% | 8.3%(-5.66)#5 | 12.4%(-9.80)#285 |
| 6. | Bel Air | 2.7% | 8.3%(-5.64)#6 | 12.4%(-9.78)#289 |
| 7. | West Ocean City | 2.7% | 8.3%(-5.61)#7 | 12.4%(-9.75)#292 |
| 8. | Bethesda | 2.7% | 8.3%(-5.60)#8 | 12.4%(-9.74)#295 |
| 9. | Laurel | 2.8% | 8.3%(-5.46)#9 | 12.4%(-9.60)#315 |
| 10. | Randallstown | 2.9% | 8.3%(-5.40)#10 | 12.4%(-9.54)#335 |
| 11. | Ilchester | 3.2% | 8.3%(-5.13)#11 | 12.4%(-9.27)#387 |
| 12. | Kemp Mill | 3.2% | 8.3%(-5.11)#12 | 12.4%(-9.25)#392 |
| 13. | Mardela Springs | 3.4% | 8.3%(-4.85)#13 | 12.4%(-8.99)#450 |
| 14. | Lanham | 3.5% | 8.3%(-4.76)#14 | 12.4%(-8.90)#472 |
| 15. | Cloverly | 3.6% | 8.3%(-4.70)#15 | 12.4%(-8.84)#486 |
| 16. | North Laurel | 3.9% | 8.3%(-4.40)#16 | 12.4%(-8.53)#549 |
| 17. | Oxon Hill | 4.0% | 8.3%(-4.29)#17 | 12.4%(-8.43)#582 |
| 18. | Fort Washington | 4.0% | 8.3%(-4.25)#18 | 12.4%(-8.39)#592 |
| 19. | Adelphi | 4.1% | 8.3%(-4.21)#19 | 12.4%(-8.35)#604 |
| 20. | Bowie | 4.1% | 8.3%(-4.20)#20 | 12.4%(-8.34)#605 |
| 21. | Severna Park | 4.2% | 8.3%(-4.09)#21 | 12.4%(-8.23)#637 |
| 22. | Aspen Hill | 4.2% | 8.3%(-4.08)#22 | 12.4%(-8.22)#638 |
| 23. | Morningside | 4.4% | 8.3%(-3.85)#23 | 12.4%(-7.99)#688 |
| 24. | Gaithersburg | 4.5% | 8.3%(-3.80)#24 | 12.4%(-7.94)#704 |
| 25. | Mitchellville | 4.6% | 8.3%(-3.72)#25 | 12.4%(-7.86)#719 |
| 26. | Waldorf | 4.6% | 8.3%(-3.66)#26 | 12.4%(-7.80)#739 |
| 27. | Clarksburg | 4.7% | 8.3%(-3.58)#27 | 12.4%(-7.72)#762 |
| 28. | Wheaton | 4.7% | 8.3%(-3.57)#28 | 12.4%(-7.71)#768 |
| 29. | Glenn Dale | 5.0% | 8.3%(-3.30)#29 | 12.4%(-7.44)#830 |
| 30. | College Park | 5.2% | 8.3%(-3.07)#30 | 12.4%(-7.21)#894 |
| 31. | Barton | 5.3% | 8.3%(-3.03)#31 | 12.4%(-7.17)#911 |
| 32. | Seabrook | 5.5% | 8.3%(-2.81)#32 | 12.4%(-6.95)#964 |
| 33. | Barclay | 5.6% | 8.3%(-2.74)#33 | 12.4%(-6.88)#980 |
| 34. | Peppermill Village | 5.6% | 8.3%(-2.71)#34 | 12.4%(-6.85)#984 |
| 35. | North Kensington | 5.7% | 8.3%(-2.56)#35 | 12.4%(-6.70)#1,025 |
| 36. | Milford Mill | 5.8% | 8.3%(-2.48)#36 | 12.4%(-6.62)#1,039 |
| 37. | Glen Burnie | 5.8% | 8.3%(-2.47)#37 | 12.4%(-6.61)#1,040 |
| 38. | Dundalk | 6.3% | 8.3%(-2.04)#38 | 12.4%(-6.17)#1,166 |
| 39. | Calverton | 6.5% | 8.3%(-1.75)#39 | 12.4%(-5.89)#1,237 |
| 40. | Overlea | 6.6% | 8.3%(-1.73)#40 | 12.4%(-5.87)#1,246 |
| 41. | Joppatowne | 6.7% | 8.3%(-1.63)#41 | 12.4%(-5.77)#1,267 |
| 42. | Seat Pleasant | 6.7% | 8.3%(-1.59)#42 | 12.4%(-5.73)#1,294 |
| 43. | Fruitland | 6.8% | 8.3%(-1.49)#43 | 12.4%(-5.63)#1,323 |
| 44. | Chillum | 6.8% | 8.3%(-1.49)#44 | 12.4%(-5.63)#1,324 |
| 45. | Pasadena | 7.0% | 8.3%(-1.29)#45 | 12.4%(-5.43)#1,381 |
| 46. | Summerfield | 7.6% | 8.3%(-0.693)#46 | 12.4%(-4.83)#1,552 |
| 47. | Columbia | 7.8% | 8.3%(-0.507)#47 | 12.4%(-4.65)#1,619 |
| 48. | Suitland | 7.8% | 8.3%(-0.496)#48 | 12.4%(-4.64)#1,623 |
| 49. | Annapolis | 7.9% | 8.3%(-0.380)#49 | 12.4%(-4.52)#1,656 |
| 50. | Forest Glen | 8.4% | 8.3%(+0.125)#50 | 12.4%(-4.01)#1,830 |
| 51. | Eldersburg | 8.5% | 8.3%(+0.194)#51 | 12.4%(-3.94)#1,845 |
| 52. | Montgomery Village | 8.9% | 8.3%(+0.566)#52 | 12.4%(-3.57)#1,945 |
| 53. | East Riverdale | 9.0% | 8.3%(+0.681)#53 | 12.4%(-3.46)#1,973 |
| 54. | Salisbury | 9.2% | 8.3%(+0.860)#54 | 12.4%(-3.28)#2,050 |
| 55. | Carney | 9.6% | 8.3%(+1.33)#55 | 12.4%(-2.81)#2,175 |
| 56. | Ballenger Creek | 9.9% | 8.3%(+1.59)#56 | 12.4%(-2.55)#2,243 |
| 57. | Perry Hall | 9.9% | 8.3%(+1.63)#57 | 12.4%(-2.51)#2,251 |
| 58. | Savage | 10.2% | 8.3%(+1.86)#58 | 12.4%(-2.28)#2,355 |
| 59. | Elkridge | 10.2% | 8.3%(+1.89)#59 | 12.4%(-2.25)#2,362 |
| 60. | Elkton | 10.2% | 8.3%(+1.95)#60 | 12.4%(-2.19)#2,375 |
| 61. | Cumberland | 10.3% | 8.3%(+1.98)#61 | 12.4%(-2.16)#2,383 |
| 62. | Pikesville | 10.4% | 8.3%(+2.07)#62 | 12.4%(-2.07)#2,417 |
| 63. | Mountain Lake Park | 10.5% | 8.3%(+2.23)#63 | 12.4%(-1.91)#2,452 |
| 64. | Bel Air North | 10.6% | 8.3%(+2.28)#64 | 12.4%(-1.86)#2,474 |
| 65. | Frostburg | 10.8% | 8.3%(+2.47)#65 | 12.4%(-1.67)#2,519 |
| 66. | Williamsport | 11.0% | 8.3%(+2.70)#66 | 12.4%(-1.44)#2,598 |
| 67. | Takoma Park | 11.4% | 8.3%(+3.06)#67 | 12.4%(-1.08)#2,734 |
| 68. | Marlton | 11.5% | 8.3%(+3.18)#68 | 12.4%(-0.960)#2,760 |
| 69. | Baltimore Highlands | 12.0% | 8.3%(+3.72)#69 | 12.4%(-0.422)#2,925 |
| 70. | Parkville | 12.0% | 8.3%(+3.74)#70 | 12.4%(-0.399)#2,929 |
| 71. | White Marsh | 12.0% | 8.3%(+3.75)#71 | 12.4%(-0.393)#2,930 |
| 72. | Woodlawn Cdp Prince George S County | 12.4% | 8.3%(+4.11)#72 | 12.4%(-0.027)#3,021 |
| 73. | Camp Springs | 12.4% | 8.3%(+4.11)#73 | 12.4%(-0.025)#3,022 |
| 74. | Middle River | 12.5% | 8.3%(+4.20)#74 | 12.4%(+0.065)#3,035 |
| 75. | Friendly | 12.6% | 8.3%(+4.30)#75 | 12.4%(+0.163)#3,117 |
| 76. | Halfway | 12.7% | 8.3%(+4.37)#76 | 12.4%(+0.233)#3,130 |
| 77. | Rosedale | 12.7% | 8.3%(+4.43)#77 | 12.4%(+0.287)#3,138 |
| 78. | Frederick | 12.8% | 8.3%(+4.49)#78 | 12.4%(+0.353)#3,154 |
| 79. | Snow Hill | 12.9% | 8.3%(+4.61)#79 | 12.4%(+0.468)#3,183 |
| 80. | Hampstead | 13.2% | 8.3%(+4.93)#80 | 12.4%(+0.788)#3,263 |
| 81. | Baltimore | 13.6% | 8.3%(+5.30)#81 | 12.4%(+1.16)#3,360 |
| 82. | Grasonville | 13.9% | 8.3%(+5.59)#82 | 12.4%(+1.45)#3,435 |
| 83. | Marlboro Meadows | 14.0% | 8.3%(+5.66)#83 | 12.4%(+1.52)#3,452 |
| 84. | Flower Hill | 14.0% | 8.3%(+5.68)#84 | 12.4%(+1.54)#3,462 |
| 85. | Port Deposit | 14.3% | 8.3%(+5.99)#85 | 12.4%(+1.85)#3,559 |
| 86. | Brooklyn Park | 14.6% | 8.3%(+6.28)#86 | 12.4%(+2.14)#3,632 |
| 87. | South Laurel | 14.6% | 8.3%(+6.34)#87 | 12.4%(+2.20)#3,645 |
| 88. | Lochearn | 14.7% | 8.3%(+6.44)#88 | 12.4%(+2.30)#3,669 |
| 89. | Fort Meade | 14.9% | 8.3%(+6.60)#89 | 12.4%(+2.46)#3,701 |
| 90. | Reisterstown | 15.2% | 8.3%(+6.92)#90 | 12.4%(+2.78)#3,773 |
| 91. | Essex | 15.3% | 8.3%(+7.02)#91 | 12.4%(+2.88)#3,802 |
| 92. | California | 15.3% | 8.3%(+7.02)#92 | 12.4%(+2.88)#3,803 |
| 93. | Langley Park | 15.5% | 8.3%(+7.17)#93 | 12.4%(+3.03)#3,857 |
| 94. | Lexington Park | 15.5% | 8.3%(+7.17)#94 | 12.4%(+3.03)#3,858 |
| 95. | Germantown | 15.6% | 8.3%(+7.29)#95 | 12.4%(+3.15)#3,887 |
| 96. | Woodlawn Cdp Baltimore County | 16.3% | 8.3%(+8.02)#96 | 12.4%(+3.88)#4,075 |
| 97. | Landover Hills | 16.4% | 8.3%(+8.07)#97 | 12.4%(+3.93)#4,085 |
| 98. | Clinton | 16.4% | 8.3%(+8.10)#98 | 12.4%(+3.96)#4,088 |
| 99. | Towson | 16.8% | 8.3%(+8.51)#99 | 12.4%(+4.37)#4,229 |
| 100. | Brandywine | 16.8% | 8.3%(+8.53)#100 | 12.4%(+4.39)#4,234 |
Common Questions
What are the Top 10 Cities with the Lowest Poverty Level Among Single Males in Maryland?
Top 10 Cities with the Lowest Poverty Level Among Single Males in Maryland are:
#1
0.64%
#2
1.5%
#3
1.6%
#4
2.2%
#5
2.6%
#6
2.7%
#7
2.7%
#8
2.7%
#9
2.8%
#10
2.9%
What city has the Lowest Poverty Level Among Single Males in Maryland?
Severn has the Lowest Poverty Level Among Single Males in Maryland with 0.64%.
What is the Poverty Level Among Single Males in the State of Maryland?
Poverty Level Among Single Males in Maryland is 8.3%.
What is the Poverty Level Among Single Males in the United States?
Poverty Level Among Single Males in the United States is 12.4%.