Cities with the Lowest Poverty Level Among Single Males in Michigan
RELATED REPORTS & OPTIONS
Lowest Poverty | Single Male
Michigan
Compare Cities
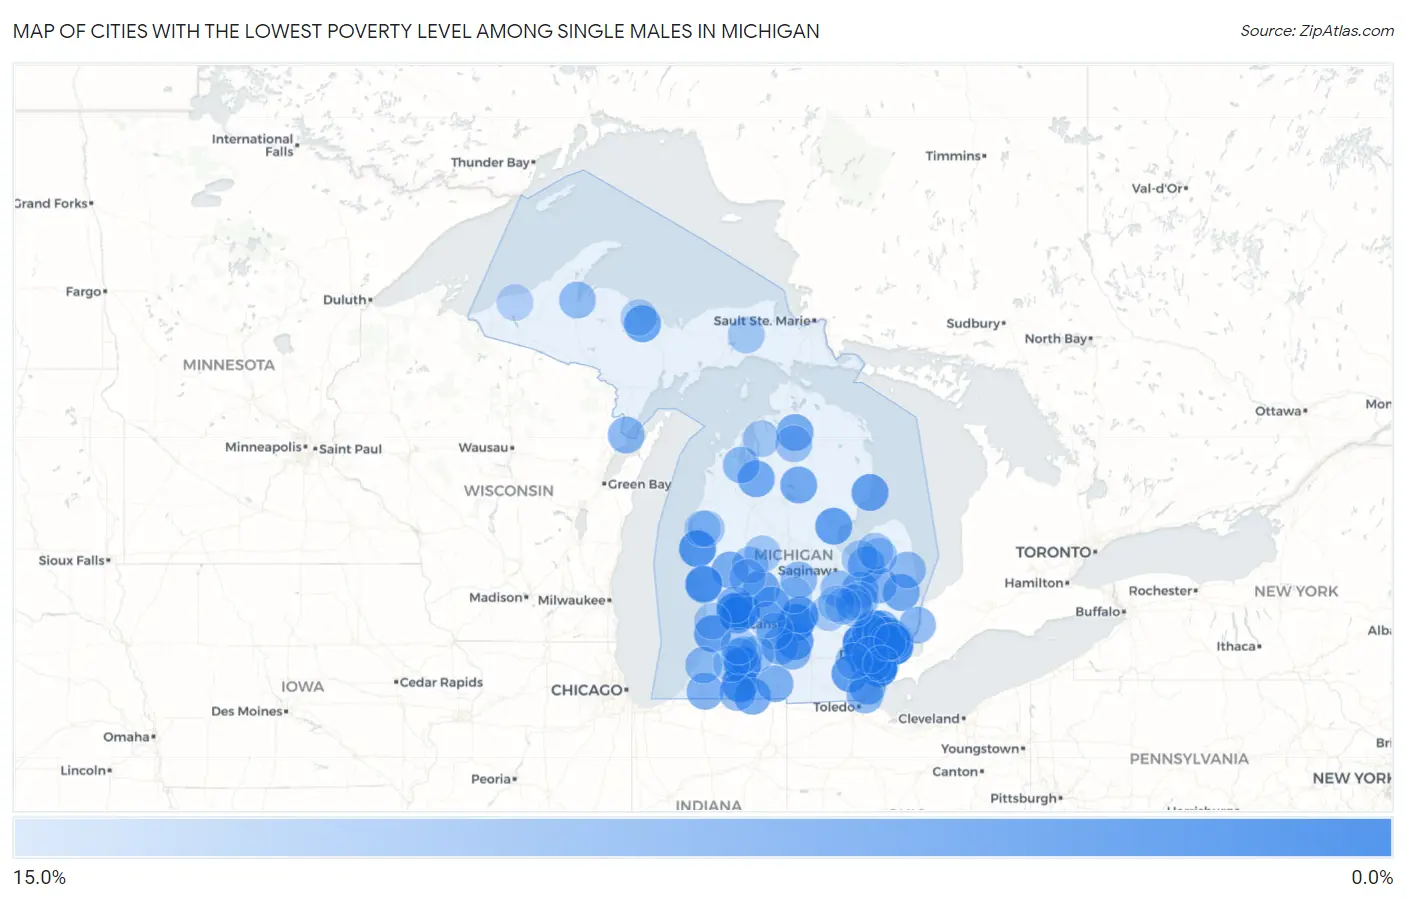
Map of Cities with the Lowest Poverty Level Among Single Males in Michigan
15.0%
0.0%
Cities with the Lowest Poverty Level Among Single Males in Michigan
| City | Single Male Poverty | vs State | vs National | |
| 1. | Kentwood | 1.0% | 13.1%(-12.1)#1 | 12.4%(-11.4)#35 |
| 2. | Novi | 1.4% | 13.1%(-11.7)#2 | 12.4%(-11.1)#77 |
| 3. | Clawson | 1.9% | 13.1%(-11.2)#3 | 12.4%(-10.6)#155 |
| 4. | Southfield | 2.1% | 13.1%(-11.0)#4 | 12.4%(-10.4)#183 |
| 5. | Portage | 2.5% | 13.1%(-10.6)#5 | 12.4%(-9.97)#262 |
| 6. | Waverly | 2.6% | 13.1%(-10.5)#6 | 12.4%(-9.82)#284 |
| 7. | Allen Park | 3.0% | 13.1%(-10.1)#7 | 12.4%(-9.41)#359 |
| 8. | Livonia | 3.0% | 13.1%(-10.1)#8 | 12.4%(-9.41)#360 |
| 9. | Farmington Hills | 3.0% | 13.1%(-10.1)#9 | 12.4%(-9.40)#362 |
| 10. | Plymouth | 3.4% | 13.1%(-9.74)#10 | 12.4%(-9.07)#429 |
| 11. | Hart | 3.7% | 13.1%(-9.44)#11 | 12.4%(-8.78)#503 |
| 12. | Auburn Hills | 3.7% | 13.1%(-9.38)#12 | 12.4%(-8.71)#513 |
| 13. | Three Rivers | 4.0% | 13.1%(-9.14)#13 | 12.4%(-8.47)#570 |
| 14. | Madison Heights | 4.0% | 13.1%(-9.08)#14 | 12.4%(-8.41)#585 |
| 15. | Harper Woods | 4.0% | 13.1%(-9.08)#15 | 12.4%(-8.41)#586 |
| 16. | Riverview | 4.1% | 13.1%(-9.00)#16 | 12.4%(-8.34)#607 |
| 17. | Romulus | 4.1% | 13.1%(-9.00)#17 | 12.4%(-8.33)#608 |
| 18. | Grosse Pointe Woods | 4.2% | 13.1%(-8.92)#18 | 12.4%(-8.25)#630 |
| 19. | Trenton | 4.3% | 13.1%(-8.83)#19 | 12.4%(-8.16)#651 |
| 20. | Wyoming | 4.4% | 13.1%(-8.65)#20 | 12.4%(-7.99)#689 |
| 21. | Milan | 4.7% | 13.1%(-8.40)#21 | 12.4%(-7.74)#760 |
| 22. | Eaton Rapids | 4.8% | 13.1%(-8.29)#22 | 12.4%(-7.63)#786 |
| 23. | Dewitt | 5.0% | 13.1%(-8.10)#23 | 12.4%(-7.44)#832 |
| 24. | Standish | 5.0% | 13.1%(-8.10)#24 | 12.4%(-7.44)#838 |
| 25. | Fennville | 5.3% | 13.1%(-7.84)#25 | 12.4%(-7.17)#906 |
| 26. | Royal Oak | 5.3% | 13.1%(-7.76)#26 | 12.4%(-7.09)#925 |
| 27. | Au Sable | 5.4% | 13.1%(-7.70)#27 | 12.4%(-7.03)#938 |
| 28. | Huntington Woods | 5.7% | 13.1%(-7.39)#28 | 12.4%(-6.72)#1,016 |
| 29. | Harvey | 5.9% | 13.1%(-7.22)#29 | 12.4%(-6.55)#1,058 |
| 30. | Greenville | 6.2% | 13.1%(-6.90)#30 | 12.4%(-6.23)#1,142 |
| 31. | Yale | 6.5% | 13.1%(-6.65)#31 | 12.4%(-5.98)#1,211 |
| 32. | Roscommon | 6.5% | 13.1%(-6.65)#32 | 12.4%(-5.98)#1,212 |
| 33. | Muskegon | 6.5% | 13.1%(-6.56)#33 | 12.4%(-5.89)#1,238 |
| 34. | Fife Lake | 6.7% | 13.1%(-6.44)#34 | 12.4%(-5.77)#1,285 |
| 35. | Sturgis | 6.7% | 13.1%(-6.38)#35 | 12.4%(-5.71)#1,300 |
| 36. | Fraser | 6.9% | 13.1%(-6.23)#36 | 12.4%(-5.57)#1,340 |
| 37. | Ionia | 6.9% | 13.1%(-6.21)#37 | 12.4%(-5.54)#1,347 |
| 38. | Troy | 7.0% | 13.1%(-6.12)#38 | 12.4%(-5.45)#1,378 |
| 39. | Monroe | 7.1% | 13.1%(-5.99)#39 | 12.4%(-5.33)#1,405 |
| 40. | Olivet | 7.1% | 13.1%(-5.96)#40 | 12.4%(-5.29)#1,417 |
| 41. | Vanderbilt | 7.1% | 13.1%(-5.96)#41 | 12.4%(-5.29)#1,427 |
| 42. | Cutlerville | 7.2% | 13.1%(-5.94)#42 | 12.4%(-5.28)#1,433 |
| 43. | Newaygo | 7.2% | 13.1%(-5.90)#43 | 12.4%(-5.23)#1,444 |
| 44. | Caro | 7.3% | 13.1%(-5.82)#44 | 12.4%(-5.15)#1,466 |
| 45. | Taylor | 7.5% | 13.1%(-5.57)#45 | 12.4%(-4.90)#1,532 |
| 46. | Coldwater | 7.6% | 13.1%(-5.54)#46 | 12.4%(-4.87)#1,540 |
| 47. | Niles | 7.6% | 13.1%(-5.47)#47 | 12.4%(-4.80)#1,567 |
| 48. | Otisville | 7.7% | 13.1%(-5.41)#48 | 12.4%(-4.74)#1,590 |
| 49. | St Clair Shores | 7.7% | 13.1%(-5.40)#49 | 12.4%(-4.73)#1,603 |
| 50. | Walker | 8.1% | 13.1%(-5.04)#50 | 12.4%(-4.38)#1,701 |
| 51. | Rochester Hills | 8.1% | 13.1%(-5.02)#51 | 12.4%(-4.36)#1,707 |
| 52. | Warren | 8.1% | 13.1%(-5.01)#52 | 12.4%(-4.34)#1,713 |
| 53. | North Muskegon | 8.3% | 13.1%(-4.83)#53 | 12.4%(-4.16)#1,763 |
| 54. | Menominee | 8.3% | 13.1%(-4.77)#54 | 12.4%(-4.10)#1,780 |
| 55. | North Branch | 8.3% | 13.1%(-4.77)#55 | 12.4%(-4.10)#1,795 |
| 56. | Springport | 8.3% | 13.1%(-4.77)#56 | 12.4%(-4.10)#1,797 |
| 57. | Sterling Heights | 8.7% | 13.1%(-4.45)#57 | 12.4%(-3.78)#1,893 |
| 58. | Luna Pier | 8.7% | 13.1%(-4.41)#58 | 12.4%(-3.74)#1,904 |
| 59. | Center Line | 8.8% | 13.1%(-4.32)#59 | 12.4%(-3.65)#1,922 |
| 60. | Marine City | 8.8% | 13.1%(-4.31)#60 | 12.4%(-3.64)#1,927 |
| 61. | Traverse City | 8.8% | 13.1%(-4.30)#61 | 12.4%(-3.64)#1,929 |
| 62. | Watervliet | 8.9% | 13.1%(-4.21)#62 | 12.4%(-3.55)#1,955 |
| 63. | Ithaca | 9.0% | 13.1%(-4.10)#63 | 12.4%(-3.44)#1,979 |
| 64. | Constantine | 9.1% | 13.1%(-4.01)#64 | 12.4%(-3.34)#2,005 |
| 65. | Carsonville | 9.1% | 13.1%(-4.01)#65 | 12.4%(-3.34)#2,027 |
| 66. | Parchment | 9.3% | 13.1%(-3.80)#66 | 12.4%(-3.13)#2,085 |
| 67. | Baraga | 9.5% | 13.1%(-3.58)#67 | 12.4%(-2.91)#2,141 |
| 68. | Montrose | 9.5% | 13.1%(-3.58)#68 | 12.4%(-2.91)#2,142 |
| 69. | Sylvan Lake | 9.5% | 13.1%(-3.58)#69 | 12.4%(-2.91)#2,143 |
| 70. | Vermontville | 9.5% | 13.1%(-3.58)#70 | 12.4%(-2.91)#2,153 |
| 71. | Garden City | 9.8% | 13.1%(-3.33)#71 | 12.4%(-2.67)#2,214 |
| 72. | Davison | 9.8% | 13.1%(-3.30)#72 | 12.4%(-2.63)#2,221 |
| 73. | Ypsilanti | 9.8% | 13.1%(-3.27)#73 | 12.4%(-2.60)#2,228 |
| 74. | Grand Blanc | 10.0% | 13.1%(-3.10)#74 | 12.4%(-2.44)#2,268 |
| 75. | Gaylord | 10.0% | 13.1%(-3.10)#75 | 12.4%(-2.44)#2,273 |
| 76. | Morley | 10.0% | 13.1%(-3.10)#76 | 12.4%(-2.44)#2,307 |
| 77. | Cass City | 10.2% | 13.1%(-2.90)#77 | 12.4%(-2.23)#2,370 |
| 78. | Augusta | 10.3% | 13.1%(-2.76)#78 | 12.4%(-2.09)#2,408 |
| 79. | Custer | 10.5% | 13.1%(-2.58)#79 | 12.4%(-1.91)#2,467 |
| 80. | Westwood | 10.8% | 13.1%(-2.29)#80 | 12.4%(-1.62)#2,531 |
| 81. | Roseville | 11.0% | 13.1%(-2.06)#81 | 12.4%(-1.40)#2,606 |
| 82. | Newberry | 11.1% | 13.1%(-1.99)#82 | 12.4%(-1.32)#2,636 |
| 83. | Central Lake | 11.1% | 13.1%(-1.99)#83 | 12.4%(-1.32)#2,641 |
| 84. | Mecosta | 11.1% | 13.1%(-1.99)#84 | 12.4%(-1.32)#2,656 |
| 85. | Bancroft | 11.1% | 13.1%(-1.99)#85 | 12.4%(-1.32)#2,657 |
| 86. | Akron | 11.1% | 13.1%(-1.99)#86 | 12.4%(-1.32)#2,663 |
| 87. | Gagetown | 11.1% | 13.1%(-1.99)#87 | 12.4%(-1.32)#2,665 |
| 88. | Pierson | 11.1% | 13.1%(-1.99)#88 | 12.4%(-1.32)#2,673 |
| 89. | Holland | 11.1% | 13.1%(-1.96)#89 | 12.4%(-1.29)#2,678 |
| 90. | Mattawan | 11.8% | 13.1%(-1.34)#90 | 12.4%(-0.671)#2,845 |
| 91. | Lennon | 11.8% | 13.1%(-1.34)#91 | 12.4%(-0.671)#2,865 |
| 92. | Marquette | 11.8% | 13.1%(-1.29)#92 | 12.4%(-0.619)#2,870 |
| 93. | Plainwell | 11.8% | 13.1%(-1.28)#93 | 12.4%(-0.617)#2,873 |
| 94. | Burton | 12.1% | 13.1%(-1.03)#94 | 12.4%(-0.361)#2,940 |
| 95. | Scottville | 12.1% | 13.1%(-0.981)#95 | 12.4%(-0.314)#2,951 |
| 96. | Lake Odessa | 12.2% | 13.1%(-0.907)#96 | 12.4%(-0.240)#2,969 |
| 97. | Swartz Creek | 12.2% | 13.1%(-0.898)#97 | 12.4%(-0.231)#2,971 |
| 98. | White Pine | 12.5% | 13.1%(-0.603)#98 | 12.4%(+0.065)#3,089 |
| 99. | Wyandotte | 12.6% | 13.1%(-0.504)#99 | 12.4%(+0.163)#3,116 |
| 100. | Maple Rapids | 12.8% | 13.1%(-0.282)#100 | 12.4%(+0.385)#3,166 |
Common Questions
What are the Top 10 Cities with the Lowest Poverty Level Among Single Males in Michigan?
Top 10 Cities with the Lowest Poverty Level Among Single Males in Michigan are:
#1
1.0%
#2
1.4%
#3
1.9%
#4
2.1%
#5
2.5%
#6
2.6%
#7
3.0%
#8
3.0%
#9
3.0%
#10
3.4%
What city has the Lowest Poverty Level Among Single Males in Michigan?
Kentwood has the Lowest Poverty Level Among Single Males in Michigan with 1.0%.
What is the Poverty Level Among Single Males in the State of Michigan?
Poverty Level Among Single Males in Michigan is 13.1%.
What is the Poverty Level Among Single Males in the United States?
Poverty Level Among Single Males in the United States is 12.4%.