Cities with the Lowest Poverty Level Among Single Males in Pennsylvania
RELATED REPORTS & OPTIONS
Lowest Poverty | Single Male
Pennsylvania
Compare Cities
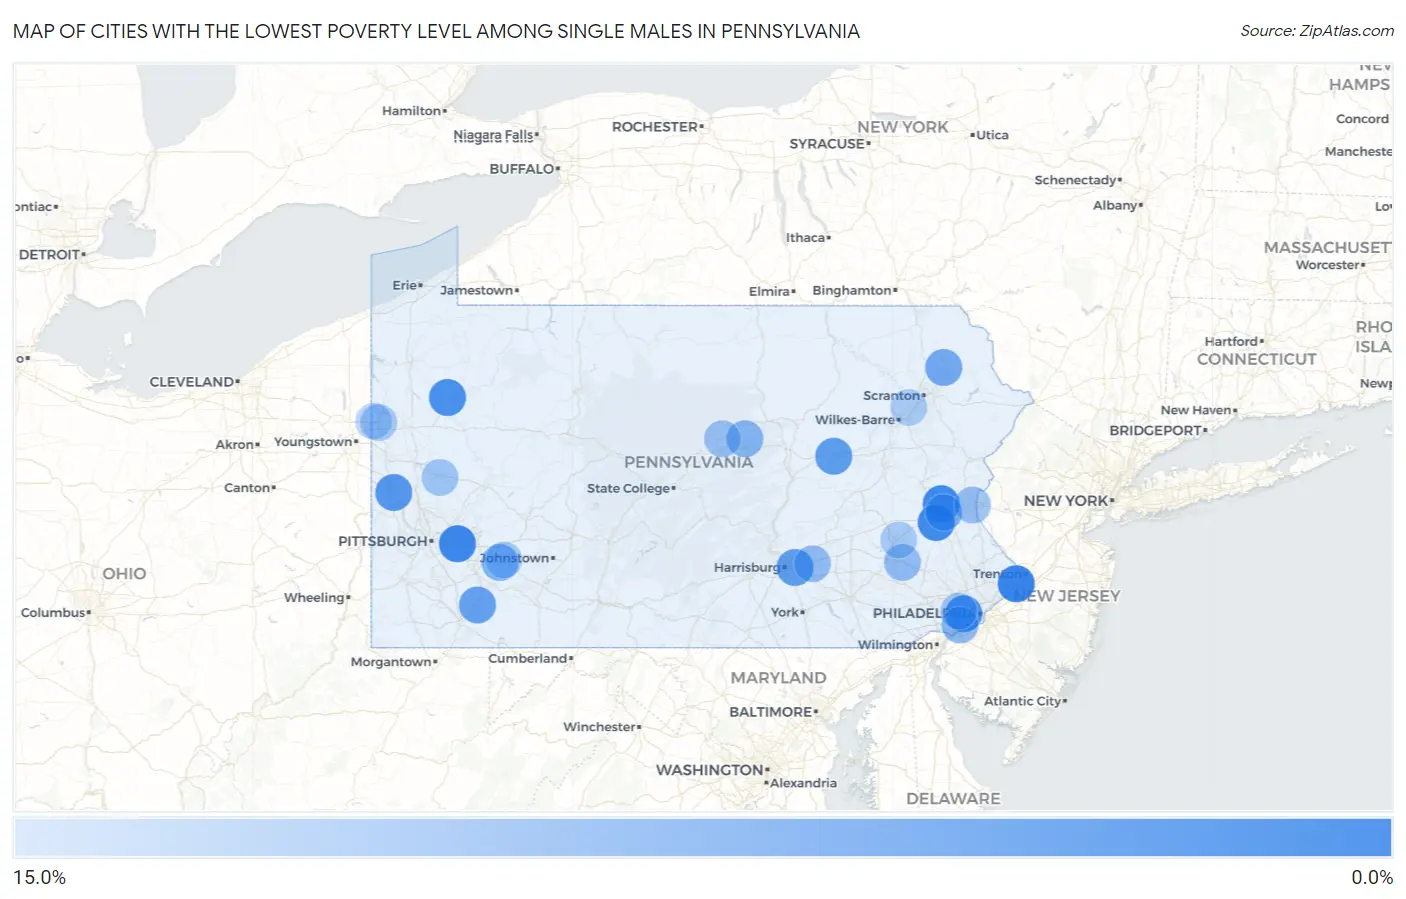
Map of Cities with the Lowest Poverty Level Among Single Males in Pennsylvania
15.0%
0.0%
Cities with the Lowest Poverty Level Among Single Males in Pennsylvania
| City | Single Male Poverty | vs State | vs National | |
| 1. | Levittown | 0.72% | 12.4%(-11.7)#1 | 12.4%(-11.7)#19 |
| 2. | Monroeville | 1.0% | 12.4%(-11.4)#2 | 12.4%(-11.4)#34 |
| 3. | Plum Borough | 1.1% | 12.4%(-11.4)#3 | 12.4%(-11.4)#41 |
| 4. | Cementon | 1.3% | 12.4%(-11.1)#4 | 12.4%(-11.1)#67 |
| 5. | Wescosville | 1.3% | 12.4%(-11.1)#5 | 12.4%(-11.1)#73 |
| 6. | Franklin | 2.2% | 12.4%(-10.3)#6 | 12.4%(-10.3)#203 |
| 7. | Drexel Hill | 2.2% | 12.4%(-10.2)#7 | 12.4%(-10.2)#219 |
| 8. | Sayre Borough | 2.3% | 12.4%(-10.1)#8 | 12.4%(-10.1)#243 |
| 9. | Beaver Falls | 2.9% | 12.4%(-9.52)#9 | 12.4%(-9.52)#340 |
| 10. | Canonsburg Borough | 3.1% | 12.4%(-9.38)#10 | 12.4%(-9.38)#365 |
| 11. | Montgomery Borough | 3.1% | 12.4%(-9.31)#11 | 12.4%(-9.31)#378 |
| 12. | Polk Borough | 3.1% | 12.4%(-9.31)#12 | 12.4%(-9.31)#379 |
| 13. | Marcus Hook Borough | 3.3% | 12.4%(-9.16)#13 | 12.4%(-9.17)#407 |
| 14. | Lawnton | 3.6% | 12.4%(-8.88)#14 | 12.4%(-8.88)#474 |
| 15. | Bloomsburg | 3.6% | 12.4%(-8.79)#15 | 12.4%(-8.80)#498 |
| 16. | Parkesburg Borough | 4.0% | 12.4%(-8.47)#16 | 12.4%(-8.47)#571 |
| 17. | Connellsville | 4.1% | 12.4%(-8.32)#17 | 12.4%(-8.32)#609 |
| 18. | Ferndale Borough | 4.3% | 12.4%(-8.14)#18 | 12.4%(-8.15)#654 |
| 19. | Camp Hill Borough | 4.4% | 12.4%(-8.01)#19 | 12.4%(-8.02)#680 |
| 20. | Laureldale Borough | 4.6% | 12.4%(-7.79)#20 | 12.4%(-7.79)#742 |
| 21. | Mount Union Borough | 4.8% | 12.4%(-7.67)#21 | 12.4%(-7.67)#777 |
| 22. | Lanesboro Borough | 4.9% | 12.4%(-7.55)#22 | 12.4%(-7.56)#804 |
| 23. | Lansdale Borough | 4.9% | 12.4%(-7.53)#23 | 12.4%(-7.54)#806 |
| 24. | Homer City Borough | 4.9% | 12.4%(-7.51)#24 | 12.4%(-7.52)#811 |
| 25. | New Eagle Borough | 5.0% | 12.4%(-7.48)#25 | 12.4%(-7.48)#817 |
| 26. | Simpson | 5.0% | 12.4%(-7.43)#26 | 12.4%(-7.44)#841 |
| 27. | Latrobe Borough | 5.1% | 12.4%(-7.28)#27 | 12.4%(-7.29)#872 |
| 28. | Hatboro Borough | 5.4% | 12.4%(-7.01)#28 | 12.4%(-7.01)#943 |
| 29. | Roaring Spring Borough | 5.6% | 12.4%(-6.87)#29 | 12.4%(-6.88)#975 |
| 30. | Brookhaven Borough | 5.7% | 12.4%(-6.77)#30 | 12.4%(-6.77)#1,002 |
| 31. | Fleetwood Borough | 5.7% | 12.4%(-6.72)#31 | 12.4%(-6.72)#1,017 |
| 32. | Tamaqua Borough | 5.7% | 12.4%(-6.69)#32 | 12.4%(-6.70)#1,026 |
| 33. | Berwick Borough | 5.8% | 12.4%(-6.60)#33 | 12.4%(-6.60)#1,042 |
| 34. | Munhall Borough | 5.9% | 12.4%(-6.55)#34 | 12.4%(-6.55)#1,055 |
| 35. | Laflin Borough | 5.9% | 12.4%(-6.55)#35 | 12.4%(-6.55)#1,059 |
| 36. | Fullerton | 6.0% | 12.4%(-6.48)#36 | 12.4%(-6.48)#1,091 |
| 37. | Lawson Heights | 6.0% | 12.4%(-6.44)#37 | 12.4%(-6.45)#1,097 |
| 38. | Norristown Borough | 6.1% | 12.4%(-6.35)#38 | 12.4%(-6.36)#1,113 |
| 39. | Ambridge Borough | 6.1% | 12.4%(-6.33)#39 | 12.4%(-6.34)#1,119 |
| 40. | Robesonia Borough | 6.1% | 12.4%(-6.33)#40 | 12.4%(-6.34)#1,120 |
| 41. | Carnegie Borough | 6.1% | 12.4%(-6.31)#41 | 12.4%(-6.31)#1,126 |
| 42. | Yoe Borough | 6.1% | 12.4%(-6.31)#42 | 12.4%(-6.31)#1,128 |
| 43. | Swissvale Borough | 6.3% | 12.4%(-6.11)#43 | 12.4%(-6.11)#1,179 |
| 44. | Jonestown Borough | 6.3% | 12.4%(-6.10)#44 | 12.4%(-6.11)#1,183 |
| 45. | Lykens Borough | 6.3% | 12.4%(-6.08)#45 | 12.4%(-6.09)#1,187 |
| 46. | Avoca Borough | 6.4% | 12.4%(-6.07)#46 | 12.4%(-6.07)#1,195 |
| 47. | Muncy Borough | 6.5% | 12.4%(-5.98)#47 | 12.4%(-5.98)#1,210 |
| 48. | Trumbauersville Borough | 6.5% | 12.4%(-5.91)#48 | 12.4%(-5.91)#1,232 |
| 49. | Matamoras Borough | 6.6% | 12.4%(-5.84)#49 | 12.4%(-5.84)#1,252 |
| 50. | Pennsburg Borough | 6.6% | 12.4%(-5.80)#50 | 12.4%(-5.81)#1,261 |
| 51. | Brookville Borough | 6.7% | 12.4%(-5.76)#51 | 12.4%(-5.77)#1,270 |
| 52. | Rauchtown | 6.7% | 12.4%(-5.76)#52 | 12.4%(-5.77)#1,280 |
| 53. | Woodlyn | 6.8% | 12.4%(-5.64)#53 | 12.4%(-5.65)#1,316 |
| 54. | Emmaus Borough | 6.8% | 12.4%(-5.63)#54 | 12.4%(-5.63)#1,322 |
| 55. | Hanover Borough | 6.9% | 12.4%(-5.57)#55 | 12.4%(-5.58)#1,337 |
| 56. | Phoenixville Borough | 6.9% | 12.4%(-5.56)#56 | 12.4%(-5.57)#1,339 |
| 57. | Columbia Borough | 7.2% | 12.4%(-5.18)#57 | 12.4%(-5.19)#1,455 |
| 58. | Knoxville Borough | 7.3% | 12.4%(-5.11)#58 | 12.4%(-5.12)#1,477 |
| 59. | Quakertown Borough | 7.4% | 12.4%(-5.07)#59 | 12.4%(-5.08)#1,484 |
| 60. | Bendersville Borough | 7.5% | 12.4%(-4.93)#60 | 12.4%(-4.94)#1,526 |
| 61. | Hershey | 7.5% | 12.4%(-4.91)#61 | 12.4%(-4.92)#1,528 |
| 62. | Lorane | 7.5% | 12.4%(-4.88)#62 | 12.4%(-4.89)#1,538 |
| 63. | Curwensville Borough | 7.6% | 12.4%(-4.82)#63 | 12.4%(-4.83)#1,554 |
| 64. | Sewickley Borough | 7.7% | 12.4%(-4.74)#64 | 12.4%(-4.74)#1,579 |
| 65. | New Oxford Borough | 7.7% | 12.4%(-4.74)#65 | 12.4%(-4.74)#1,584 |
| 66. | Glassport Borough | 7.8% | 12.4%(-4.62)#66 | 12.4%(-4.63)#1,624 |
| 67. | Blossburg Borough | 7.9% | 12.4%(-4.54)#67 | 12.4%(-4.54)#1,649 |
| 68. | Easton | 8.0% | 12.4%(-4.45)#68 | 12.4%(-4.45)#1,676 |
| 69. | Dunmore Borough | 8.0% | 12.4%(-4.40)#69 | 12.4%(-4.41)#1,696 |
| 70. | Kennett Square Borough | 8.0% | 12.4%(-4.38)#70 | 12.4%(-4.39)#1,700 |
| 71. | Castanea | 8.1% | 12.4%(-4.37)#71 | 12.4%(-4.37)#1,703 |
| 72. | Bristol Borough | 8.2% | 12.4%(-4.21)#72 | 12.4%(-4.22)#1,746 |
| 73. | Highspire Borough | 8.2% | 12.4%(-4.20)#73 | 12.4%(-4.20)#1,752 |
| 74. | Ridley Park Borough | 8.3% | 12.4%(-4.14)#74 | 12.4%(-4.15)#1,765 |
| 75. | Baldwin Borough | 8.3% | 12.4%(-4.11)#75 | 12.4%(-4.12)#1,777 |
| 76. | Broomall | 8.4% | 12.4%(-4.02)#76 | 12.4%(-4.02)#1,825 |
| 77. | Homeacre Lyndora | 8.4% | 12.4%(-4.01)#77 | 12.4%(-4.02)#1,829 |
| 78. | Olyphant Borough | 8.5% | 12.4%(-3.96)#78 | 12.4%(-3.97)#1,840 |
| 79. | Hooversville Borough | 8.7% | 12.4%(-3.73)#79 | 12.4%(-3.74)#1,905 |
| 80. | Fredericksburg Cdp Lebanon County | 8.9% | 12.4%(-3.54)#80 | 12.4%(-3.55)#1,956 |
| 81. | Hermitage | 9.0% | 12.4%(-3.43)#81 | 12.4%(-3.43)#1,980 |
| 82. | Loyalhanna | 9.1% | 12.4%(-3.34)#82 | 12.4%(-3.34)#2,001 |
| 83. | Newville Borough | 9.1% | 12.4%(-3.34)#83 | 12.4%(-3.34)#2,010 |
| 84. | East Conemaugh Borough | 9.1% | 12.4%(-3.34)#84 | 12.4%(-3.34)#2,016 |
| 85. | Saxton Borough | 9.1% | 12.4%(-3.34)#85 | 12.4%(-3.34)#2,020 |
| 86. | Blandon | 9.2% | 12.4%(-3.24)#86 | 12.4%(-3.25)#2,058 |
| 87. | Danville Borough | 9.5% | 12.4%(-2.91)#87 | 12.4%(-2.91)#2,138 |
| 88. | Atglen Borough | 9.5% | 12.4%(-2.91)#88 | 12.4%(-2.91)#2,147 |
| 89. | New Salem Borough | 9.5% | 12.4%(-2.91)#89 | 12.4%(-2.91)#2,148 |
| 90. | Pittston | 9.7% | 12.4%(-2.77)#90 | 12.4%(-2.77)#2,182 |
| 91. | Sharon | 9.9% | 12.4%(-2.55)#91 | 12.4%(-2.56)#2,240 |
| 92. | Sugarcreek Borough | 10.0% | 12.4%(-2.43)#92 | 12.4%(-2.44)#2,272 |
| 93. | Springdale Borough | 10.0% | 12.4%(-2.43)#93 | 12.4%(-2.44)#2,275 |
| 94. | Burnham Borough | 10.0% | 12.4%(-2.43)#94 | 12.4%(-2.44)#2,288 |
| 95. | Platea Borough | 10.0% | 12.4%(-2.43)#95 | 12.4%(-2.44)#2,312 |
| 96. | Little Meadows Borough | 10.0% | 12.4%(-2.43)#96 | 12.4%(-2.44)#2,318 |
| 97. | Clifton Heights Borough | 10.1% | 12.4%(-2.37)#97 | 12.4%(-2.37)#2,332 |
| 98. | Whitehall Borough | 10.2% | 12.4%(-2.23)#98 | 12.4%(-2.23)#2,368 |
| 99. | Sharpsburg Borough | 10.4% | 12.4%(-2.04)#99 | 12.4%(-2.05)#2,422 |
| 100. | Coaldale Borough Schuylkill County | 10.4% | 12.4%(-2.04)#100 | 12.4%(-2.05)#2,423 |
Common Questions
What are the Top 10 Cities with the Lowest Poverty Level Among Single Males in Pennsylvania?
Top 10 Cities with the Lowest Poverty Level Among Single Males in Pennsylvania are:
#1
0.72%
#2
1.0%
#3
1.3%
#4
1.3%
#5
2.2%
#6
2.2%
#7
2.9%
#8
3.6%
#9
3.6%
#10
4.1%
What city has the Lowest Poverty Level Among Single Males in Pennsylvania?
Levittown has the Lowest Poverty Level Among Single Males in Pennsylvania with 0.72%.
What is the Poverty Level Among Single Males in the State of Pennsylvania?
Poverty Level Among Single Males in Pennsylvania is 12.4%.
What is the Poverty Level Among Single Males in the United States?
Poverty Level Among Single Males in the United States is 12.4%.